Open Source Jobs in London

Open Source
England > London

The table below provides summary statistics for permanent job vacancies advertised in London requiring Open Source skills. It includes a benchmarking guide to the annual salaries offered in vacancies that cited Open Source over the 6 months leading up to 26 July 2024, comparing them to the same period in the previous two years.

6 months to
26 Jul 2024
Same period 2023 Same period 2022
Rank 274 179 96
Rank change year-on-year -95 -83 -11
Permanent jobs citing Open Source 223 524 2,971
As % of all permanent jobs advertised in London 1.08% 1.93% 3.96%
As % of the Processes & Methodologies category 1.20% 2.04% 4.08%
Number of salaries quoted 159 321 740
10th Percentile £51,950 £52,500 £50,000
25th Percentile £65,000 £62,500 £60,000
Median annual salary (50th Percentile) £83,000 £80,294 £78,142
Median % change year-on-year +3.37% +2.75% +4.19%
75th Percentile £105,000 £95,436 £100,000
90th Percentile £126,000 £110,000 £112,500
England median annual salary £65,000 £72,500 £70,000
% change year-on-year -10.34% +3.57% +6.87%

All Process and Methodology Skills
London

Open Source falls under the Processes and Methodologies category. For comparison with the information above, the following table provides summary statistics for all permanent job vacancies requiring process or methodology skills in London.

Permanent vacancies with a requirement for process or methodology skills 18,545 25,706 72,795
As % of all permanent jobs advertised in London 89.42% 94.78% 97.04%
Number of salaries quoted 12,808 20,124 35,328
10th Percentile £39,500 £42,500 £42,500
25th Percentile £52,500 £55,000 £53,750
Median annual salary (50th Percentile) £72,500 £74,000 £70,000
Median % change year-on-year -2.03% +5.71% -
75th Percentile £95,000 £95,000 £91,732
90th Percentile £120,000 £116,250 £110,000
England median annual salary £55,000 £62,000 £60,000
% change year-on-year -11.29% +3.33% +4.35%

Open Source
Job Vacancy Trend in London

Job postings citing Open Source as a proportion of all IT jobs advertised in London.
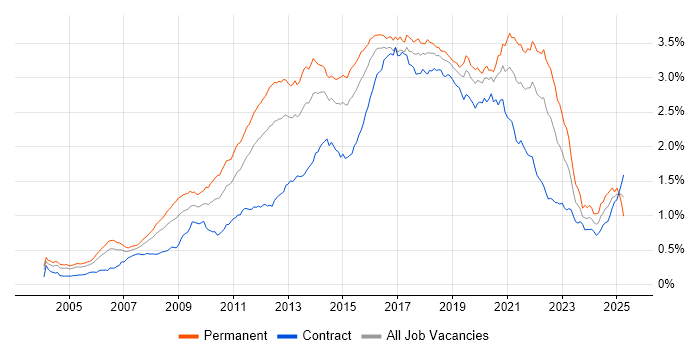
Job vacancy trend for Open Source in London

Open Source
Salary Trend in London

3-month moving average salary quoted in jobs citing Open Source in London.

Salary trend for Open Source in London

Open Source
Salary Histogram in London

Salary distribution for jobs citing Open Source in London over the 6 months to 26 July 2024.

Salary histogram for Open Source in London

Open Source
Job Locations in London

The table below looks at the demand and provides a guide to the median salaries quoted in IT jobs citing Open Source within the London region over the 6 months to 26 July 2024. The 'Rank Change' column provides an indication of the change in demand within each location based on the same 6 month period last year.

Location Rank Change
on Same Period
Last Year
Matching
Permanent
IT Job Ads
Median Salary
Past 6 Months
Median Salary
% Change
on Same Period
Last Year
Live
Jobs
Central London -70 25 £76,250 -4.69% 6
East London +23 1 - -
Open Source
England

Open Source
Co-occurring Skills and Capabilities in London by Category

The follow tables expand on the table above by listing co-occurrences grouped by category. The same employment type, locality and period is covered with up to 20 co-occurrences shown in each of the following categories:

Application Platforms
1 15 (6.73%) Apache Spark
2 8 (3.59%) Apache
3 6 (2.69%) Confluence
4 5 (2.24%) Apache Airflow
5 4 (1.79%) Apache Pulsar
5 4 (1.79%) Drupal
5 4 (1.79%) WebLogic
6 3 (1.35%) ArcGIS
7 2 (0.90%) Apache Pig
7 2 (0.90%) Jupyter
7 2 (0.90%) OpenStack
8 1 (0.45%) Adobe Experience Manager
8 1 (0.45%) CMS
8 1 (0.45%) Headless CMS
8 1 (0.45%) nginx
8 1 (0.45%) OpenZeppelin
Applications
1 2 (0.90%) MS Visio
2 1 (0.45%) Microsoft Office
2 1 (0.45%) Microsoft PowerPoint
2 1 (0.45%) Notion
Business Applications
1 4 (1.79%) Sparx Enterprise Architect
2 1 (0.45%) Ripple
2 1 (0.45%) Ripple XRP
Cloud Services
1 109 (48.88%) AWS
2 82 (36.77%) Azure
3 41 (18.39%) GCP
4 29 (13.00%) Serverless
5 25 (11.21%) Amazon S3
5 25 (11.21%) Amazon SQS
5 25 (11.21%) AWS Lambda
6 20 (8.97%) Azure DevOps
7 18 (8.07%) SaaS
8 13 (5.83%) IaaS
8 13 (5.83%) PaaS
9 12 (5.38%) Google Gemini
10 11 (4.93%) Amazon EC2
10 11 (4.93%) AWS CloudFormation
10 11 (4.93%) AWS Step Functions
10 11 (4.93%) Cloud Computing
10 11 (4.93%) GitHub
10 11 (4.93%) OpenShift
11 10 (4.48%) Amazon ECS
11 10 (4.48%) Azure ExpressRoute
Communications & Networking
1 23 (10.31%) BGP
2 19 (8.52%) WAN
3 18 (8.07%) MPLS
4 17 (7.62%) DNS
4 17 (7.62%) LAN
4 17 (7.62%) VPN
5 16 (7.17%) Firewall
6 12 (5.38%) SSL
7 10 (4.48%) Cisco ISE
7 10 (4.48%) Cisco Nexus
7 10 (4.48%) Unified Communications
7 10 (4.48%) VLAN
7 10 (4.48%) Wi-Fi
8 9 (4.04%) DMZ
8 9 (4.04%) Network Security
9 8 (3.59%) DHCP
9 8 (3.59%) Multicast
9 8 (3.59%) OSPF
9 8 (3.59%) Wireless
9 8 (3.59%) WLAN
Database & Business Intelligence
1 21 (9.42%) NoSQL
1 21 (9.42%) PostgreSQL
2 15 (6.73%) Amazon RDS
3 14 (6.28%) Amazon Redshift
3 14 (6.28%) Elasticsearch
3 14 (6.28%) Relational Database
4 8 (3.59%) Apache Cassandra
5 7 (3.14%) Big Data
5 7 (3.14%) Hadoop
5 7 (3.14%) Metadata
5 7 (3.14%) MongoDB
5 7 (3.14%) SQL Server
6 6 (2.69%) Data Warehouse
6 6 (2.69%) RDBMS
7 5 (2.24%) BigQuery
7 5 (2.24%) Data Lake
8 4 (1.79%) Bigtable
8 4 (1.79%) Flink
8 4 (1.79%) Oracle Database
8 4 (1.79%) SQLite
Development Applications
1 33 (14.80%) Git
2 26 (11.66%) Jenkins
3 10 (4.48%) Artifactory
4 7 (3.14%) JIRA
5 6 (2.69%) Cucumber
5 6 (2.69%) Selenium
6 4 (1.79%) Charles Proxy
6 4 (1.79%) JUnit
7 3 (1.35%) GitLab
7 3 (1.35%) NUnit
8 2 (0.90%) Checkstyle
8 2 (0.90%) CircleCI
8 2 (0.90%) Jaeger
8 2 (0.90%) JMeter
8 2 (0.90%) Maven
8 2 (0.90%) MLflow
8 2 (0.90%) SonarQube
8 2 (0.90%) Sonatype Nexus
8 2 (0.90%) Team Foundation Server
9 1 (0.45%) Hardhat
General
1 61 (27.35%) Finance
2 37 (16.59%) Social Skills
3 29 (13.00%) Inclusion and Diversity
4 22 (9.87%) Law
5 21 (9.42%) Front Office
6 17 (7.62%) Analytical Skills
7 11 (4.93%) Legal
8 9 (4.04%) Presentation Skills
9 7 (3.14%) Public Sector
10 5 (2.24%) Banking
11 4 (1.79%) Financial Institution
12 3 (1.35%) Marketing
13 2 (0.90%) Advertising
13 2 (0.90%) Games
13 2 (0.90%) iGaming
13 2 (0.90%) Retail
13 2 (0.90%) Telecoms
14 1 (0.45%) Digital Economy
14 1 (0.45%) Electronics
14 1 (0.45%) Publishing
Job Titles
1 80 (35.87%) Senior
2 38 (17.04%) Architect
3 36 (16.14%) Software Engineer
4 30 (13.45%) Lead
5 27 (12.11%) Developer
6 18 (8.07%) Lead Software Engineer
7 15 (6.73%) AWS Engineer
8 13 (5.83%) Analyst
8 13 (5.83%) AWS DevOps
8 13 (5.83%) AWS DevOps Engineer
8 13 (5.83%) Cloud Engineer
8 13 (5.83%) DevOps Engineer
8 13 (5.83%) Kubernetes Engineer
8 13 (5.83%) Senior Manager
8 13 (5.83%) Senior Software Engineer
8 13 (5.83%) Site Reliability Engineer
8 13 (5.83%) Technical Architect
9 12 (5.38%) Network Engineer
9 12 (5.38%) Security Engineer
9 12 (5.38%) Senior Network Engineer
Libraries, Frameworks & Software Standards
1 29 (13.00%) React
2 25 (11.21%) Kafka
3 23 (10.31%) Django
4 21 (9.42%) TensorFlow
5 18 (8.07%) HTML
5 18 (8.07%) PyTorch
6 16 (7.17%) .NET
6 16 (7.17%) .NET Core
7 13 (5.83%) J2EE
8 12 (5.38%) Apache Beam
9 11 (4.93%) .NET Framework
9 11 (4.93%) Unity DI Container
10 9 (4.04%) Spring Boot
11 8 (3.59%) 802.1X
11 8 (3.59%) RabbitMQ
11 8 (3.59%) XML
12 7 (3.14%) CSS
12 7 (3.14%) Next.js
12 7 (3.14%) Node.js
12 7 (3.14%) Spring
Miscellaneous
1 32 (14.35%) Cloud Native
2 28 (12.56%) Algorithms
3 20 (8.97%) Data Centre
4 19 (8.52%) Distributed Systems
5 17 (7.62%) Data Structures
6 16 (7.17%) Private Cloud
7 13 (5.83%) Blockchain
8 12 (5.38%) Blog
8 12 (5.38%) Hedge funds
8 12 (5.38%) Public Cloud
9 11 (4.93%) Cyber Threat
10 10 (4.48%) Management Information System
10 10 (4.48%) Tandem
11 8 (3.59%) Legacy Systems
12 7 (3.14%) Client/Server
12 7 (3.14%) Derivative
12 7 (3.14%) Hybrid Cloud
12 7 (3.14%) Legacy Applications
12 7 (3.14%) N-Tier
12 7 (3.14%) Taxonomies
Operating Systems
1 36 (16.14%) Linux
2 7 (3.14%) Android
2 7 (3.14%) Unix
2 7 (3.14%) Windows
3 4 (1.79%) Red Hat Enterprise Linux
4 3 (1.35%) Windows Server
5 2 (0.90%) Apple iOS
6 1 (0.45%) Mac OS
6 1 (0.45%) Mac OS X
6 1 (0.45%) Windows Server 2012
Processes & Methodologies
1 80 (35.87%) Software Engineering
2 79 (35.43%) Agile
3 72 (32.29%) DevOps
4 71 (31.84%) CI/CD
5 45 (20.18%) Mentoring
6 39 (17.49%) Analytics
7 35 (15.70%) Scrum
8 32 (14.35%) Artificial Intelligence
8 32 (14.35%) Machine Learning
9 31 (13.90%) Microservices
10 29 (13.00%) Data Pipeline
11 28 (12.56%) Decision-Making
12 27 (12.11%) Computer Science
13 25 (11.21%) Containerisation
13 25 (11.21%) Cybersecurity
13 25 (11.21%) OO
14 24 (10.76%) Mathematics
14 24 (10.76%) Problem-Solving
14 24 (10.76%) Roadmaps
15 23 (10.31%) Test Automation
Programming Languages
1 116 (52.02%) Python
2 80 (35.87%) Java
3 46 (20.63%) SQL
4 30 (13.45%) JavaScript
5 28 (12.56%) TypeScript
6 26 (11.66%) Go
7 23 (10.31%) PowerShell
8 18 (8.07%) C#
9 15 (6.73%) C++
10 13 (5.83%) Rust
11 12 (5.38%) Scala
12 10 (4.48%) R
13 9 (4.04%) Kotlin
13 9 (4.04%) PHP
14 8 (3.59%) C
15 6 (2.69%) Haskell
16 5 (2.24%) Ruby
17 4 (1.79%) Bash
18 1 (0.45%) Kusto Query Language
18 1 (0.45%) Solidity
Qualifications
1 35 (15.70%) Degree
2 16 (7.17%) SC Cleared
2 16 (7.17%) Security Cleared
3 12 (5.38%) Master's Degree
3 12 (5.38%) PhD
4 7 (3.14%) BPSS Clearance
4 7 (3.14%) CCNA
4 7 (3.14%) Cisco Certification
4 7 (3.14%) Computer Science Degree
5 6 (2.69%) AWS Certification
5 6 (2.69%) AWS Certified Solutions Architect
6 4 (1.79%) Azure Certification
7 2 (0.90%) CISSP
8 1 (0.45%) CISMP
8 1 (0.45%) CompTIA CySA+
8 1 (0.45%) CompTIA Security+
8 1 (0.45%) DV Cleared
8 1 (0.45%) Network+ Certification
8 1 (0.45%) Numerate Degree
Quality Assurance & Compliance
1 33 (14.80%) QA
2 8 (3.59%) NCSC
3 3 (1.35%) Accessibility
3 3 (1.35%) Data Quality
4 2 (0.90%) MiFID
System Software
1 40 (17.94%) Docker
2 6 (2.69%) Ceph
2 6 (2.69%) Virtual Machines
3 3 (1.35%) HDFS
3 3 (1.35%) Virtual Servers
4 2 (0.90%) Active Directory
5 1 (0.45%) Hyper-V
5 1 (0.45%) Virtual Desktop
5 1 (0.45%) VMware ESXi
5 1 (0.45%) VMware Infrastructure
Systems Management
1 57 (25.56%) Kubernetes
2 45 (20.18%) Terraform
3 33 (14.80%) Ansible
4 15 (6.73%) Puppet
5 11 (4.93%) Progress Chef
6 6 (2.69%) Knative
6 6 (2.69%) Nessus
7 3 (1.35%) Salt
8 2 (0.90%) CASB
8 2 (0.90%) Grafana
8 2 (0.90%) Kiali
8 2 (0.90%) Kubeflow
9 1 (0.45%) Active Directory Federation Services
9 1 (0.45%) Apache Ranger
9 1 (0.45%) Argo
9 1 (0.45%) Hadoop YARN
9 1 (0.45%) Kibana
9 1 (0.45%) Nagios
9 1 (0.45%) Prometheus
9 1 (0.45%) QRadar
Vendors
1 23 (10.31%) Google
1 23 (10.31%) Microsoft
2 17 (7.62%) Cisco
3 12 (5.38%) OpenAI
4 9 (4.04%) CheckPoint
4 9 (4.04%) Palo Alto
5 7 (3.14%) Arista
5 7 (3.14%) Bloomberg
5 7 (3.14%) Fortinet
5 7 (3.14%) Juniper
5 7 (3.14%) Tufin
6 6 (2.69%) Oracle
7 5 (2.24%) SolarWinds
8 4 (1.79%) Becrypt
8 4 (1.79%) Sparx
9 3 (1.35%) AppDynamics
9 3 (1.35%) ESRI
9 3 (1.35%) Mercator
9 3 (1.35%) Splunk
10 2 (0.90%) Intel