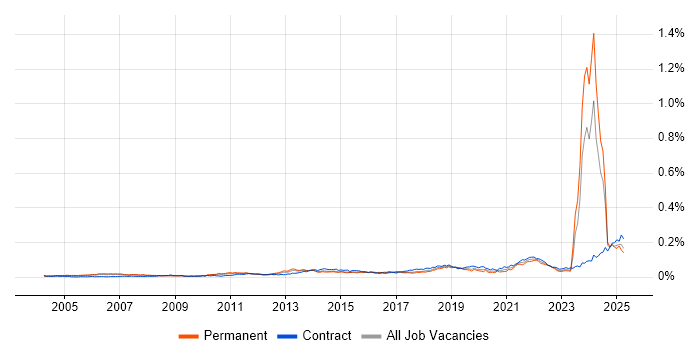
Operational Stability Jobs

Operational Stability
UK

The table below provides summary statistics for permanent job vacancies requiring Operational Stability skills. It includes a benchmarking guide to the annual salaries offered in vacancies that cited Operational Stability over the 6 months leading up to 31 May 2025, comparing them to the same period in the previous two years.

6 months to
31 May 2025
Same period 2024 Same period 2023
Rank 439 153 947
Rank change year-on-year -286 +794 +150
Permanent jobs citing Operational Stability 279 1,935 21
As % of all permanent jobs advertised in the UK 0.50% 1.87% 0.022%
As % of the Processes & Methodologies category 0.53% 2.22% 0.023%
Number of salaries quoted 40 53 16
10th Percentile £42,500 £35,920 £41,125
25th Percentile £44,375 £36,250 £41,250
Median annual salary (50th Percentile) £64,000 £62,783 £63,750
Median % change year-on-year +1.94% -1.52% -15.00%
75th Percentile - £67,968 £75,938
90th Percentile £140,677 £141,032 £83,125
UK excluding London median annual salary £50,000 £62,783 £77,500
% change year-on-year -20.36% -18.99% +70.37%

All Process and Methodology Skills
UK

Operational Stability falls under the Processes and Methodologies category. For comparison with the information above, the following table provides summary statistics for all permanent job vacancies requiring process or methodology skills.

Permanent vacancies with a requirement for process or methodology skills 52,256 87,133 91,481
As % of all permanent jobs advertised in the UK 93.58% 84.04% 95.51%
Number of salaries quoted 25,854 60,896 54,581
10th Percentile £28,822 £29,250 £34,000
25th Percentile £41,250 £40,000 £45,000
Median annual salary (50th Percentile) £57,000 £55,000 £60,899
Median % change year-on-year +3.64% -9.69% +1.50%
75th Percentile £75,000 £72,500 £81,250
90th Percentile £97,500 £92,500 £100,000
UK excluding London median annual salary £51,564 £50,000 £55,000
% change year-on-year +3.13% -9.09% +4.76%

Operational Stability
Job Vacancy Trend

Job postings citing Operational Stability as a proportion of all IT jobs advertised.

Job vacancy trend for Operational Stability in the UK

Operational Stability
Salary Trend

3-month moving average salary quoted in jobs citing Operational Stability.

Salary trend for Operational Stability in the UK

Operational Stability
Salary Histogram

Salary distribution for jobs citing Operational Stability over the 6 months to 31 May 2025.

Salary histogram for Operational Stability in the UK

Operational Stability
Top 13 Job Locations

The table below looks at the demand and provides a guide to the median salaries quoted in IT jobs citing Operational Stability within the UK over the 6 months to 31 May 2025. The 'Rank Change' column provides an indication of the change in demand within each location based on the same 6 month period last year.

Location Rank Change
on Same Period
Last Year
Matching
Permanent
IT Job Ads
Median Salary
Past 6 Months
Median Salary
% Change
on Same Period
Last Year
Live
Jobs
England +256 178 £64,000 +1.94% 67
UK excluding London -326 151 £50,000 -20.36% 49
London +205 127 £64,000 -44.25% 42
Scotland -67 100 - - 25
North of England +32 26 £50,000 -20.36% 10
Work from Home +98 23 £64,000 +1.94% 14
South West +113 21 - - 8
North West +8 17 £45,000 -28.32% 9
Yorkshire +51 8 £122,773 +95.55% 1
Midlands +58 2 - - 1
West Midlands +52 2 - - 1
East of England - 2 - - 2
North East +43 1 £47,500 -24.34%

Operational Stability
Co-occurring Skills and Capabilities by Category

The follow tables expand on the table above by listing co-occurrences grouped by category. The same employment type, locality and period is covered with up to 20 co-occurrences shown in each of the following categories:

Application Platforms
1 18 (6.45%) Apache Spark
2 7 (2.51%) Apache
3 6 (2.15%) Apache Airflow
4 4 (1.43%) Camunda
4 4 (1.43%) Oracle Workflow
5 2 (0.72%) Cloud Foundry
5 2 (0.72%) Jupyter
5 2 (0.72%) SharePoint
5 2 (0.72%) Tomcat
6 1 (0.36%) CICS
6 1 (0.36%) Microsoft Exchange
6 1 (0.36%) SAS
Business Applications
1 2 (0.72%) Cloudability
Cloud Services
1 100 (35.84%) AWS
2 24 (8.60%) Azure
3 18 (6.45%) AWS Lambda
3 18 (6.45%) Serverless
4 17 (6.09%) GCP
5 16 (5.73%) Power Platform
6 9 (3.23%) Amazon EKS
6 9 (3.23%) SaaS
7 6 (2.15%) Azure Data Factory
7 6 (2.15%) Azure DevOps
7 6 (2.15%) Azure Synapse Analytics
8 5 (1.79%) Amazon S3
8 5 (1.79%) BlazeMeter
8 5 (1.79%) GitHub
9 4 (1.43%) Amazon ECS
9 4 (1.43%) Apigee
9 4 (1.43%) Kong
9 4 (1.43%) Microsoft 365
10 3 (1.08%) npm
10 3 (1.08%) Yarn
Communications & Networking
1 3 (1.08%) FTP
1 3 (1.08%) Software-Defined Networking
2 2 (0.72%) Internet
2 2 (0.72%) PuTTY
2 2 (0.72%) SSL
2 2 (0.72%) TCP/IP
3 1 (0.36%) DNS
3 1 (0.36%) Firewall
3 1 (0.36%) LAN
3 1 (0.36%) Unified Communications
3 1 (0.36%) VPN
3 1 (0.36%) WAN
Database & Business Intelligence
1 36 (12.90%) NoSQL
2 24 (8.60%) Big Data
3 19 (6.81%) DynamoDB
4 17 (6.09%) Elasticsearch
5 16 (5.73%) Power BI
6 14 (5.02%) KDB
6 14 (5.02%) Kdb+
7 12 (4.30%) PostgreSQL
8 11 (3.94%) Apache Cassandra
9 10 (3.58%) Relational Database
10 7 (2.51%) Amazon Redshift
10 7 (2.51%) Hadoop
11 6 (2.15%) Amazon Athena
11 6 (2.15%) MongoDB
11 6 (2.15%) Oracle Database
12 5 (1.79%) Apache Hive
12 5 (1.79%) Apache Iceberg
13 4 (1.43%) InterSystems Cache
13 4 (1.43%) MySQL
13 4 (1.43%) RDBMS
Development Applications
1 13 (4.66%) JUnit
2 10 (3.58%) Git
3 9 (3.23%) Vite
4 6 (2.15%) Oracle Forms
5 5 (1.79%) Cypress.io
6 4 (1.43%) Jenkins
6 4 (1.43%) Maven
7 3 (1.08%) JIRA
7 3 (1.08%) Mockito
7 3 (1.08%) webpack
8 2 (0.72%) Gradle
8 2 (0.72%) Selenium
8 2 (0.72%) Spinnaker
9 1 (0.36%) Cucumber
General
1 213 (76.34%) Finance
2 186 (66.67%) Inclusion and Diversity
3 183 (65.59%) Law
4 126 (45.16%) Banking
5 54 (19.35%) Marketing
6 51 (18.28%) Analytical Skills
7 26 (9.32%) Social Skills
8 23 (8.24%) Front Office
9 21 (7.53%) Investment Banking
10 19 (6.81%) Publishing
11 17 (6.09%) Health Technology
11 17 (6.09%) Tech for Good
12 16 (5.73%) Legal
13 4 (1.43%) Influencing Skills
13 4 (1.43%) Private Banking
14 3 (1.08%) Back Office
15 2 (0.72%) Agriculture
15 2 (0.72%) Billing
15 2 (0.72%) Organisational Skills
16 1 (0.36%) Documentation Skills
Job Titles
1 181 (64.87%) Software Engineer
2 108 (38.71%) Lead
3 81 (29.03%) Lead Software Engineer
4 65 (23.30%) Java Engineer
5 63 (22.58%) Java Software Engineer
6 54 (19.35%) Senior
7 46 (16.49%) Python Engineer
7 46 (16.49%) Python Software Engineer
8 38 (13.62%) Developer
9 32 (11.47%) Senior Software Engineer
10 24 (8.60%) Full-Stack Engineer
10 24 (8.60%) Full-Stack Software Engineer
11 23 (8.24%) Senior Developer
11 23 (8.24%) Software Developer
12 22 (7.89%) Analyst
13 19 (6.81%) Lead Java Engineer
14 17 (6.09%) Data Engineer
15 14 (5.02%) Senior Software Developer
16 13 (4.66%) Developer/Software Engineer
17 12 (4.30%) Java Developer
Libraries, Frameworks & Software Standards
1 72 (25.81%) React
2 61 (21.86%) Spring
3 56 (20.07%) Kafka
4 37 (13.26%) RESTful
5 32 (11.47%) Spring Boot
6 23 (8.24%) Swagger
7 20 (7.17%) AngularJS
8 16 (5.73%) REST
9 15 (5.38%) PySpark
10 12 (4.30%) CSS
10 12 (4.30%) Node.js
11 10 (3.58%) Web Services
12 9 (3.23%) FIX Protocol
12 9 (3.23%) Jest
13 8 (2.87%) OpenAPI
14 7 (2.51%) HTML
15 6 (2.15%) .NET
15 6 (2.15%) Express.js
15 6 (2.15%) Pandas
16 4 (1.43%) D3.js
Miscellaneous
1 76 (27.24%) Cloud Native
2 61 (21.86%) Algorithms
3 28 (10.04%) Product Ownership
4 20 (7.17%) Distributed Systems
5 19 (6.81%) Derivative
5 19 (6.81%) Public Cloud
6 11 (3.94%) Mobile App
7 10 (3.58%) Client/Server
8 9 (3.23%) Equities
9 8 (2.87%) Reference Data
10 6 (2.15%) Fixed Income
10 6 (2.15%) Foreign Exchange (FX)
10 6 (2.15%) Management Information System
11 5 (1.79%) Data Structures
12 4 (1.43%) Equity Derivative
12 4 (1.43%) Mainframe
13 3 (1.08%) Enterprise Software
13 3 (1.08%) iSeries
13 3 (1.08%) Market Risk
14 2 (0.72%) Private Cloud
Operating Systems
1 13 (4.66%) Linux
2 12 (4.30%) Unix
3 7 (2.51%) zOS
4 3 (1.08%) Windows
5 2 (0.72%) Red Hat Enterprise Linux
5 2 (0.72%) Solaris
6 1 (0.36%) Apple iOS
Processes & Methodologies
1 263 (94.27%) Agile
2 196 (70.25%) Software Engineering
3 173 (62.01%) CI/CD
4 169 (60.57%) SDLC
5 128 (45.88%) Community of Practice
6 109 (39.07%) Machine Learning
7 107 (38.35%) Artificial Intelligence
8 86 (30.82%) Continuous Delivery
9 80 (28.67%) Visualisation
10 62 (22.22%) DevOps
11 61 (21.86%) Continuous Improvement
12 55 (19.71%) Roadmaps
13 51 (18.28%) Problem-Solving
14 47 (16.85%) Data Engineering
15 46 (16.49%) Architectural Design
15 46 (16.49%) Information Architecture
15 46 (16.49%) Stakeholder Management
16 44 (15.77%) Decision-Making
17 42 (15.05%) Risk Management
18 36 (12.90%) Continuous Integration
Programming Languages
1 122 (43.73%) Java
2 113 (40.50%) Python
3 78 (27.96%) SQL
4 53 (19.00%) TypeScript
5 24 (8.60%) JavaScript
6 20 (7.17%) Go
7 14 (5.02%) C++
8 13 (4.66%) C#
9 9 (3.23%) PL/SQL
10 7 (2.51%) C
10 7 (2.51%) Kotlin
11 6 (2.15%) Scala
12 4 (1.43%) Lua
13 2 (0.72%) Rust
13 2 (0.72%) Shell Script
13 2 (0.72%) T-SQL
14 1 (0.36%) Objective-C
14 1 (0.36%) PROC SQL
14 1 (0.36%) Smalltalk
14 1 (0.36%) Swift
Qualifications
1 13 (4.66%) AWS Certification
2 11 (3.94%) Degree
3 8 (2.87%) SC Cleared
3 8 (2.87%) Security Cleared
4 6 (2.15%) Computer Science Degree
5 5 (1.79%) Master's Degree
6 3 (1.08%) Azure Certification
6 3 (1.08%) PhD
7 2 (0.72%) AWS Certified Developer
7 2 (0.72%) AWS Certified Solutions Architect
7 2 (0.72%) CCNA
7 2 (0.72%) Cisco Certification
7 2 (0.72%) ITIL Foundation Certificate
Quality Assurance & Compliance
1 20 (7.17%) QA
2 19 (6.81%) Sarbanes-Oxley
3 16 (5.73%) Data Quality
4 2 (0.72%) Accessibility
4 2 (0.72%) ISO/IEC 27001
4 2 (0.72%) NIST
4 2 (0.72%) PCI DSS
5 1 (0.36%) SLA
System Software
1 22 (7.89%) Docker
2 3 (1.08%) HDFS
3 2 (0.72%) RACF
4 1 (0.36%) Apache Flume
4 1 (0.36%) VMware NSX
Systems Management
1 63 (22.58%) Kubernetes
2 34 (12.19%) Terraform
3 13 (4.66%) Grafana
4 4 (1.43%) Mesos
4 4 (1.43%) Prometheus
5 3 (1.08%) Ansible
6 2 (0.72%) Argo
6 2 (0.72%) ITRS Geneos
6 2 (0.72%) Netcool
6 2 (0.72%) Netcool/OMNIbus
6 2 (0.72%) Tivoli
7 1 (0.36%) Kibana
7 1 (0.36%) logstash
7 1 (0.36%) Oozie
Vendors
1 36 (12.90%) Oracle
2 18 (6.45%) ServiceNow
3 13 (4.66%) Databricks
3 13 (4.66%) Splunk
4 11 (3.94%) Dynatrace
5 9 (3.23%) Microsoft
6 8 (2.87%) Google
6 8 (2.87%) Informatica
7 4 (1.43%) Cisco
7 4 (1.43%) MKS
7 4 (1.43%) MuleSoft
8 3 (1.08%) F5
8 3 (1.08%) Fortinet
8 3 (1.08%) IBM
9 2 (0.72%) Cloudera
9 2 (0.72%) LogicMonitor
9 2 (0.72%) Murex
9 2 (0.72%) Red Hat
9 2 (0.72%) SolarWinds
9 2 (0.72%) Vertica