Code Quality Jobs

Code Quality (Software Quality)
UK

The table below provides summary statistics for permanent job vacancies requiring Code Quality skills. It includes a benchmarking guide to the annual salaries offered in vacancies that cited Code Quality over the 6 months leading up to 4 July 2025, comparing them to the same period in the previous two years.

6 months to
4 Jul 2025
Same period 2024 Same period 2023
Rank 273 291 336
Rank change year-on-year +18 +45 -129
Permanent jobs citing Code Quality 662 1,019 879
As % of all permanent jobs advertised in the UK 1.12% 0.95% 0.99%
As % of the Processes & Methodologies category 1.23% 1.15% 1.04%
Number of salaries quoted 504 678 421
10th Percentile £44,125 £36,250 £41,250
25th Percentile £57,500 £47,500 £50,000
Median annual salary (50th Percentile) £66,215 £60,000 £67,500
Median % change year-on-year +10.36% -11.11% -
75th Percentile £80,188 £81,250 £86,250
90th Percentile £100,000 £90,000 £102,500
UK excluding London median annual salary £66,200 £57,500 £55,000
% change year-on-year +15.13% +4.55% -8.33%

All Process and Methodology Skills
UK

Code Quality falls under the Processes and Methodologies category. For comparison with the information above, the following table provides summary statistics for all permanent job vacancies requiring process or methodology skills.

Permanent vacancies with a requirement for process or methodology skills 53,805 88,576 84,734
As % of all permanent jobs advertised in the UK 90.87% 82.43% 95.31%
Number of salaries quoted 27,901 60,925 53,023
10th Percentile £27,500 £29,750 £33,750
25th Percentile £38,424 £40,000 £45,000
Median annual salary (50th Percentile) £55,000 £55,000 £60,331
Median % change year-on-year - -8.84% +0.55%
75th Percentile £75,000 £72,500 £80,000
90th Percentile £96,250 £92,500 £100,000
UK excluding London median annual salary £50,000 £50,000 £55,000
% change year-on-year - -9.09% +4.76%

Code Quality
Job Vacancy Trend

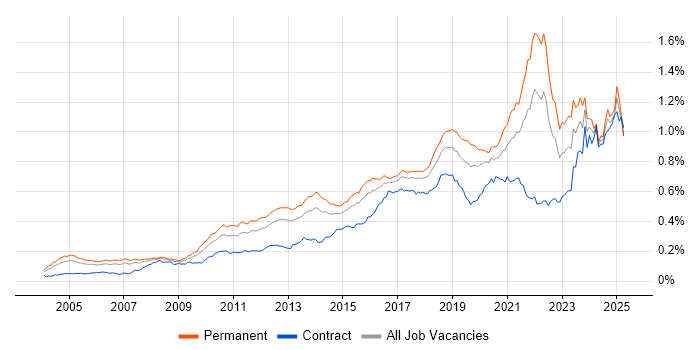
Job postings citing Code Quality as a proportion of all IT jobs advertised.

Job vacancy trend for Code Quality in the UK

Code Quality
Salary Trend

3-month moving average salary quoted in jobs citing Code Quality.

Salary trend for Code Quality in the UK

Code Quality
Salary Histogram

Salary distribution for jobs citing Code Quality over the 6 months to 4 July 2025.

Salary histogram for Code Quality in the UK

Code Quality
Top 17 Job Locations

The table below looks at the demand and provides a guide to the median salaries quoted in IT jobs citing Code Quality within the UK over the 6 months to 4 July 2025. The 'Rank Change' column provides an indication of the change in demand within each location based on the same 6 month period last year.

Location Rank Change
on Same Period
Last Year
Matching
Permanent
IT Job Ads
Median Salary
Past 6 Months
Median Salary
% Change
on Same Period
Last Year
Live
Jobs
England +15 598 £66,233 +10.39% 2,185
UK excluding London -8 422 £66,200 +15.13% 1,231
Work from Home +28 327 £66,225 +5.96% 1,095
London +119 209 £75,000 - 1,112
East of England +81 116 £66,225 +26.14% 145
North of England -42 110 £65,000 +18.18% 310
South East +15 99 £62,500 - 307
North West -58 90 £65,000 +30.00% 195
Midlands -24 32 £57,500 +4.22% 161
South West +21 28 £62,500 +8.70% 132
West Midlands +22 25 £60,000 +20.00% 93
Scotland +62 22 £78,750 +50.00% 113
Yorkshire +29 18 £70,000 +16.67% 95
Wales +24 11 £60,000 -4.00% 38
East Midlands -30 7 £38,750 -43.64% 67
Northern Ireland +40 6 £55,000 +22.22% 34
North East +39 2 £53,125 -3.71% 20

Code Quality
Co-occurring Skills and Capabilities by Category

The follow tables expand on the table above by listing co-occurrences grouped by category. The same employment type, locality and period is covered with up to 20 co-occurrences shown in each of the following categories:

Application Platforms
1 25 (3.78%) Confluence
2 13 (1.96%) nginx
3 12 (1.81%) CMS
4 11 (1.66%) SharePoint
4 11 (1.66%) Tomcat
5 8 (1.21%) Headless CMS
6 7 (1.06%) Apache Airflow
7 5 (0.76%) Apache
7 5 (0.76%) Liferay
8 3 (0.45%) Mule
8 3 (0.45%) OpenEdge
8 3 (0.45%) Oracle Coherence
8 3 (0.45%) Oracle SOA Suite
9 2 (0.30%) Strapi
9 2 (0.30%) WordPress
10 1 (0.15%) CICS
10 1 (0.15%) Drupal
10 1 (0.15%) Oracle Workflow
10 1 (0.15%) WebLogic
Applications
1 105 (15.86%) Chatbot
2 9 (1.36%) Trello
3 5 (0.76%) Microsoft Office
4 1 (0.15%) Adobe Creative Suite
4 1 (0.15%) MS Visio
Business Applications
1 7 (1.06%) Dynamics CRM
2 4 (0.60%) Salesforce CRM
3 1 (0.15%) Elite 3E
3 1 (0.15%) Endur
3 1 (0.15%) Magento
3 1 (0.15%) Oracle BPM
3 1 (0.15%) Payment Gateway
3 1 (0.15%) SAP EWM
Cloud Services
1 193 (29.15%) Azure
2 153 (23.11%) AWS
3 64 (9.67%) GCP
4 62 (9.37%) Azure DevOps
5 45 (6.80%) Serverless
6 39 (5.89%) Azure Cosmos DB
7 38 (5.74%) Azure Service Bus
8 37 (5.59%) SaaS
9 33 (4.98%) GitHub
10 28 (4.23%) SonarCloud
11 22 (3.32%) Amazon SQS
12 18 (2.72%) AWS Lambda
13 13 (1.96%) Amazon S3
14 12 (1.81%) Azure Logic Apps
14 12 (1.81%) Power Platform
15 10 (1.51%) Azure App Service
15 10 (1.51%) Azure Functions
15 10 (1.51%) PaaS
16 9 (1.36%) Figma
16 9 (1.36%) GitHub Actions
Communications & Networking
1 5 (0.76%) HTTP
2 4 (0.60%) LoRaWAN
3 2 (0.30%) Bluetooth
3 2 (0.30%) Broadband
3 2 (0.30%) Ethernet
3 2 (0.30%) Internet
3 2 (0.30%) Modbus
3 2 (0.30%) MQTT
4 1 (0.15%) DNS
4 1 (0.15%) WPA
Database & Business Intelligence
1 55 (8.31%) PostgreSQL
2 54 (8.16%) MongoDB
3 51 (7.70%) NoSQL
4 38 (5.74%) Elasticsearch
4 38 (5.74%) MySQL
5 32 (4.83%) SQL Server
6 18 (2.72%) Amazon RDS
7 14 (2.11%) Redis
8 13 (1.96%) Amazon Aurora
8 13 (1.96%) Relational Database
9 12 (1.81%) Big Data
9 12 (1.81%) DB2
10 10 (1.51%) DynamoDB
11 4 (0.60%) GIS
11 4 (0.60%) Oracle Database
12 3 (0.45%) Azure SQL Database
12 3 (0.45%) BigQuery
12 3 (0.45%) Data Lake
12 3 (0.45%) Power BI
13 2 (0.30%) Cloud Spanner
Development Applications
1 150 (22.66%) Git
2 65 (9.82%) JIRA
3 35 (5.29%) Jenkins
3 35 (5.29%) Selenium
4 33 (4.98%) Visual Studio
5 29 (4.38%) Octopus Deploy
5 29 (4.38%) Team Foundation Server
6 28 (4.23%) MSBuild
7 24 (3.63%) Postman
8 23 (3.47%) Cypress.io
8 23 (3.47%) JUnit
9 22 (3.32%) SonarQube
10 20 (3.02%) GitLab
11 18 (2.72%) Cucumber
11 18 (2.72%) Vite
12 14 (2.11%) Bitbucket
12 14 (2.11%) JMeter
12 14 (2.11%) Maven
12 14 (2.11%) webpack
13 11 (1.66%) Mockito
General
1 216 (32.63%) Social Skills
2 159 (24.02%) Finance
3 60 (9.06%) Banking
4 59 (8.91%) Inclusion and Diversity
5 52 (7.85%) Analytical Skills
6 47 (7.10%) Law
7 34 (5.14%) Marketing
8 32 (4.83%) Retail
9 31 (4.68%) Public Sector
10 17 (2.57%) Games
11 15 (2.27%) Manufacturing
12 10 (1.51%) Financial Institution
12 10 (1.51%) iGaming
13 8 (1.21%) Documentation Skills
14 7 (1.06%) Billing
14 7 (1.06%) Front Office
14 7 (1.06%) Health Technology
15 6 (0.91%) Organisational Skills
16 5 (0.76%) Electronics
16 5 (0.76%) Investment Banking
Job Titles
1 246 (37.16%) Developer
2 162 (24.47%) Senior
3 142 (21.45%) Software Engineer
4 101 (15.26%) Trainer
5 94 (14.20%) Lead
6 63 (9.52%) Senior Developer
7 43 (6.50%) Full-Stack Engineer
8 41 (6.19%) Architect
9 38 (5.74%) Java Engineer
10 34 (5.14%) Front-End Developer (Client-Side Developer)
11 33 (4.98%) Test Engineer
12 30 (4.53%) Full-Stack Developer
12 30 (4.53%) Technical Architect
13 29 (4.38%) Senior Test Engineer
14 28 (4.23%) Senior Software Engineer
14 28 (4.23%) Software Test Engineer
15 27 (4.08%) Lead Developer
15 27 (4.08%) Senior Software Test Engineer
16 26 (3.93%) Java Software Engineer
16 26 (3.93%) Senior Full-Stack Engineer
Libraries, Frameworks & Software Standards
1 219 (33.08%) HTML
2 136 (20.54%) React
3 120 (18.13%) CSS
4 112 (16.92%) .NET
5 86 (12.99%) REST
6 83 (12.54%) RESTful
7 70 (10.57%) Spring
8 59 (8.91%) AngularJS
9 56 (8.46%) Kafka
10 55 (8.31%) Node.js
11 53 (8.01%) Spring Boot
12 52 (7.85%) JSON
13 47 (7.10%) Bootstrap
14 46 (6.95%) gRPC
15 39 (5.89%) ASP.NET
15 39 (5.89%) Vue
16 37 (5.59%) XML
17 35 (5.29%) HTML5
18 32 (4.83%) Next.js
19 26 (3.93%) .NET Framework
Miscellaneous
1 33 (4.98%) Cloud Native
2 30 (4.53%) Algorithms
3 26 (3.93%) Data Structures
4 23 (3.47%) Mobile App
5 21 (3.17%) Distributed Systems
5 21 (3.17%) Public Cloud
6 18 (2.72%) Self-Motivation
7 16 (2.42%) Onboarding
7 16 (2.42%) Product Ownership
8 13 (1.96%) e-Learning
9 12 (1.81%) Reference Data
9 12 (1.81%) Replication
10 11 (1.66%) Hybrid Cloud
10 11 (1.66%) Legacy Systems
10 11 (1.66%) Management Information System
11 9 (1.36%) Mobile Games
12 8 (1.21%) Enterprise Software
12 8 (1.21%) Life Science
13 7 (1.06%) Team-Oriented Environment
13 7 (1.06%) Virtual Team
Operating Systems
1 37 (5.59%) Linux
2 23 (3.47%) Apple iOS
3 21 (3.17%) Android
3 21 (3.17%) Windows
4 4 (0.60%) Unix
5 2 (0.30%) Embedded Linux
5 2 (0.30%) VMS
6 1 (0.15%) zOS
Processes & Methodologies
1 302 (45.62%) Agile
2 218 (32.93%) Software Engineering
3 211 (31.87%) Problem-Solving
4 183 (27.64%) Artificial Intelligence
5 178 (26.89%) Test Automation
6 177 (26.74%) CI/CD
7 170 (25.68%) DevOps
8 167 (25.23%) Microservices
9 123 (18.58%) Mentoring
10 108 (16.31%) Full-Stack Development
11 105 (15.86%) Conversational UI
12 97 (14.65%) User Experience
13 84 (12.69%) TDD
14 80 (12.08%) Computer Science
15 78 (11.78%) Continuous Improvement
16 72 (10.88%) Software Testing
17 68 (10.27%) Design Patterns
18 66 (9.97%) Front End Development
19 65 (9.82%) Unit Testing
20 64 (9.67%) SDLC
Programming Languages
1 294 (44.41%) JavaScript
2 247 (37.31%) SQL
3 230 (34.74%) C#
4 185 (27.95%) Python
5 145 (21.90%) Java
6 113 (17.07%) C++
7 105 (15.86%) TypeScript
8 27 (4.08%) PHP
9 14 (2.11%) Bicep
10 9 (1.36%) Go
10 9 (1.36%) Kotlin
11 8 (1.21%) C
12 7 (1.06%) Shell Script
13 6 (0.91%) Bash
13 6 (0.91%) Groovy
13 6 (0.91%) PowerShell
14 5 (0.76%) Swift
15 4 (0.60%) Apex Code
15 4 (0.60%) Objective-C
15 4 (0.60%) Scala
Qualifications
1 200 (30.21%) Degree
2 44 (6.65%) Computer Science Degree
3 32 (4.83%) Security Cleared
4 29 (4.38%) BPSS Clearance
5 25 (3.78%) SC Cleared
6 17 (2.57%) ISTQB
7 9 (1.36%) DBS Check
8 5 (0.76%) ISEB
8 5 (0.76%) Master's Degree
9 4 (0.60%) DV Cleared
10 3 (0.45%) ISTQB Foundation Certification
10 3 (0.45%) Numerate Degree
11 2 (0.30%) Azure Certification
12 1 (0.15%) CISSP
12 1 (0.15%) MCSD
12 1 (0.15%) Microsoft Certification
12 1 (0.15%) PhD
Quality Assurance & Compliance
1 64 (9.67%) QA
2 30 (4.53%) GDPR
3 27 (4.08%) ISO/IEC 12207
4 19 (2.87%) Software Quality Assurance
5 18 (2.72%) Accessibility
6 5 (0.76%) WCAG
7 4 (0.60%) ISO 9001
8 2 (0.30%) AQAP
8 2 (0.30%) Data Quality
8 2 (0.30%) JTAG
9 1 (0.15%) California Consumer Privacy Act
9 1 (0.15%) GRC
9 1 (0.15%) HL7
9 1 (0.15%) ISO 13485
9 1 (0.15%) PMO
9 1 (0.15%) SNOMED CT
System Software
1 126 (19.03%) Docker
2 7 (1.06%) Active Directory
3 3 (0.45%) Firmware
4 2 (0.30%) Embedded Firmware
4 2 (0.30%) vCloud
4 2 (0.30%) Virtual Machines
Systems Management
1 97 (14.65%) Kubernetes
2 42 (6.34%) Terraform
3 12 (1.81%) Ansible
4 10 (1.51%) Packer
5 9 (1.36%) Kustomize
6 4 (0.60%) Grafana
6 4 (0.60%) HAProxy
7 3 (0.45%) Prometheus
8 2 (0.30%) Docker Swarm
8 2 (0.30%) Rundeck
9 1 (0.15%) HP Quality Center
9 1 (0.15%) RSA Archer
Vendors
1 105 (15.86%) PayPal
2 39 (5.89%) Microsoft
3 22 (3.32%) Google
4 19 (2.87%) Red Hat
5 15 (2.27%) IBM
5 15 (2.27%) Oracle
6 11 (1.66%) Salesforce
7 8 (1.21%) Guidewire
8 7 (1.06%) ServiceNow
9 5 (0.76%) Databricks
10 4 (0.60%) Bloomberg
11 3 (0.45%) CA Agile Central
11 3 (0.45%) Dynatrace
11 3 (0.45%) Progress
11 3 (0.45%) SAP
11 3 (0.45%) Solace
11 3 (0.45%) Splunk
11 3 (0.45%) Twitter
12 2 (0.30%) Salesforce Marketing Cloud
12 2 (0.30%) SnapLogic