Middleware
UK

The following table provides summary statistics for permanent job vacancies with a requirement for Middleware skills. Included is a benchmarking guide to the salaries offered in vacancies that have cited Middleware over the 6 months to 29 November 2023 with a comparison to the same period in the previous 2 years.

6 months to
29 Nov 2023
Same period 2022 Same period 2021
Rank 300 357 356
Rank change year-on-year +57 -1 +21
Permanent jobs citing Middleware 549 1,242 1,302
As % of all permanent jobs advertised in the UK 1.01% 0.99% 1.01%
As % of the Libraries, Frameworks & Software Standards category 3.84% 3.04% 2.59%
Number of salaries quoted 291 562 639
10th Percentile £47,788 £42,525 £36,750
25th Percentile £56,219 £48,750 £45,375
Median annual salary (50th Percentile) £68,000 £65,000 £65,000
Median % change year-on-year +4.62% - -
75th Percentile £82,500 £85,000 £82,500
90th Percentile £95,000 £122,500 £91,250
UK excluding London median annual salary £65,000 £58,000 £48,000
% change year-on-year +12.07% +20.83% -8.57%

All Software Libraries and Frameworks
UK

Middleware is in the Software Libraries and Frameworks category. The following table is for comparison with the above and provides summary statistics for all permanent job vacancies with a requirement for technical specification, industry standards, software libraries and framework skills.

Permanent vacancies with a requirement for technical specification, industry standards, software libraries and framework skills 14,303 40,800 50,175
As % of all permanent jobs advertised in the UK 26.43% 32.42% 38.88%
Number of salaries quoted 11,215 24,814 31,989
10th Percentile £41,250 £40,000 £36,250
25th Percentile £51,250 £49,995 £45,000
Median annual salary (50th Percentile) £67,250 £65,000 £60,000
Median % change year-on-year +3.46% +8.33% +4.35%
75th Percentile £85,000 £85,000 £80,000
90th Percentile £106,250 £104,991 £96,250
UK excluding London median annual salary £57,500 £57,500 £52,500
% change year-on-year - +9.52% +5.00%

Middleware
Job Vacancy Trend

Job postings citing Middleware as a proportion of all IT jobs advertised.
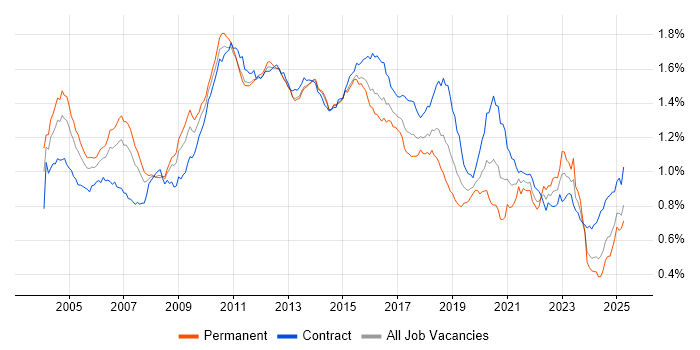
Job vacancy trend for Middleware in the UK

Middleware
Salary Trend

3-month moving average salary quoted in jobs citing Middleware.

Salary trend for Middleware in the UK

Middleware
Salary Histogram

Salary distribution for jobs citing Middleware over the 6 months to 29 November 2023.

Salary histogram for Middleware in the UK

Middleware
Top 17 Job Locations

The table below looks at the demand and provides a guide to the median salaries quoted in IT jobs citing Middleware within the UK over the 6 months to 29 November 2023. The 'Rank Change' column provides an indication of the change in demand within each location based on the same 6 month period last year.

Location Rank Change
on Same Period
Last Year
Matching
Permanent
IT Job Ads
Median Salary
Past 6 Months
Median Salary
% Change
on Same Period
Last Year
Live
Jobs
England +41 479 £67,500 +3.85% 131
UK excluding London +6 326 £65,000 +12.07% 67
London +94 184 £80,000 +3.23% 75
Work from Home +11 160 £67,750 +12.92% 88
North of England +102 103 £65,033 +4.89% 22
South East +37 59 £55,000 +4.76% 17
Yorkshire +70 47 £65,033 +0.05% 8
South West -23 47 £59,763 +25.82% 12
North West +100 46 £65,500 +39.92% 9
Midlands +81 44 £62,750 +19.52% 8
Scotland +33 39 £69,447 +15.75% 1
West Midlands +90 30 £65,000 +8.33% 7
East of England +55 21 £65,000 -13.33% 5
East Midlands +30 14 £49,990 +5.24% 1
Wales +5 11 £65,500 +53.02% 2
North East +42 9 - - 5
Northern Ireland +32 2 - -

Middleware
Co-occurring Skills and Capabilities by Category

The follow tables expand on the table above by listing co-occurrences grouped by category. The same employment type, locality and period is covered with up to 20 co-occurrences shown in each of the following categories:

Application Platforms
1 28 (5.10%) Confluence
2 26 (4.74%) SharePoint
3 10 (1.82%) Apache
4 8 (1.46%) nginx
4 8 (1.46%) Tomcat
4 8 (1.46%) WebLogic
5 6 (1.09%) JBoss
6 5 (0.91%) Apache Spark
7 4 (0.73%) IIS
7 4 (0.73%) Oracle SOA Suite
7 4 (0.73%) WebSphere
8 3 (0.55%) BizTalk Server
9 1 (0.18%) Anypoint
9 1 (0.18%) Apache Airflow
9 1 (0.18%) CMS
9 1 (0.18%) MQSeries
9 1 (0.18%) Mule
9 1 (0.18%) Oracle 9iAS
9 1 (0.18%) Oracle Application Server
9 1 (0.18%) Oracle Service Bus
Applications
1 4 (0.73%) Chatbot
1 4 (0.73%) Microsoft Office
1 4 (0.73%) MS Visio
2 3 (0.55%) Microsoft Excel
2 3 (0.55%) Microsoft PowerPoint
3 1 (0.18%) Microsoft Project
Business Applications
1 9 (1.64%) Shopify
2 5 (0.91%) NetSuite
3 4 (0.73%) SAP Oil and Gas
4 3 (0.55%) Dynamics NAV
4 3 (0.55%) Oracle Receivables
4 3 (0.55%) SAP S/4HANA
5 2 (0.36%) Elite 3E
5 2 (0.36%) Workday HCM
6 1 (0.18%) Dynamics AX
6 1 (0.18%) Dynamics CRM
6 1 (0.18%) Oracle 11i
6 1 (0.18%) Oracle Applications
6 1 (0.18%) Oracle EBS
6 1 (0.18%) Oracle EBS R12
6 1 (0.18%) Oracle FAH
6 1 (0.18%) Oracle General Ledger
6 1 (0.18%) Remedy ITSM
6 1 (0.18%) Sage X3
6 1 (0.18%) SAP SD
6 1 (0.18%) Siebel CRM
Cloud Services
1 91 (16.58%) Azure
2 60 (10.93%) AWS
3 59 (10.75%) SaaS
4 57 (10.38%) PaaS
5 51 (9.29%) IaaS
6 38 (6.92%) Serverless
7 33 (6.01%) Power Platform
8 25 (4.55%) AWS Lambda
9 22 (4.01%) BlazeMeter
10 18 (3.28%) Amazon S3
10 18 (3.28%) PowerApps
11 16 (2.91%) GCP
12 15 (2.73%) Azure DevOps
12 15 (2.73%) GitHub
13 14 (2.55%) AWS CloudFormation
13 14 (2.55%) OpenShift
13 14 (2.55%) Power Automate
14 13 (2.37%) Microsoft 365
15 12 (2.19%) AWS CodeCommit
15 12 (2.19%) Dynamics 365
Communications & Networking
1 18 (3.28%) Network Security
2 17 (3.10%) Firewall
3 14 (2.55%) SSL
4 12 (2.19%) AMQP
5 7 (1.28%) DNS
5 7 (1.28%) VPN
6 6 (1.09%) DHCP
7 4 (0.73%) Intrusion Detection
8 3 (0.55%) DMZ
8 3 (0.55%) Internet
8 3 (0.55%) LAN
8 3 (0.55%) WAN
8 3 (0.55%) Wi-Fi
9 2 (0.36%) FTP
9 2 (0.36%) Reverse Proxy
9 2 (0.36%) SAN
9 2 (0.36%) TCP/IP
9 2 (0.36%) VoIP
10 1 (0.18%) SSH
10 1 (0.18%) VLAN
Database & Business Intelligence
1 63 (11.48%) SQL Server
2 30 (5.46%) Oracle Database
3 26 (4.74%) Oracle Database 10g
4 22 (4.01%) Data Warehouse
4 22 (4.01%) Oracle Database 11g
4 22 (4.01%) Power BI
5 18 (3.28%) DynamoDB
5 18 (3.28%) SQL Server Integration Services
6 16 (2.91%) MongoDB
6 16 (2.91%) SQL Server Reporting Services
7 15 (2.73%) NoSQL
8 12 (2.19%) PostgreSQL
9 9 (1.64%) Data Lake
10 8 (1.46%) Relational Database
11 7 (1.28%) Amazon Aurora
11 7 (1.28%) Amazon RDS
12 5 (0.91%) Azure SQL Data Warehouse
12 5 (0.91%) Big Data
12 5 (0.91%) Power Query
12 5 (0.91%) Redis
Development Applications
1 43 (7.83%) JIRA
2 40 (7.29%) Cucumber
2 40 (7.29%) Git
3 29 (5.28%) Maven
4 27 (4.92%) JUnit
4 27 (4.92%) Postman
4 27 (4.92%) SoapUI
5 23 (4.19%) Jenkins
5 23 (4.19%) REST Assured
6 22 (4.01%) eggPlant
6 22 (4.01%) JMeter
6 22 (4.01%) The Grinder
7 20 (3.64%) LoadRunner
8 16 (2.91%) Bitbucket
9 12 (2.19%) ClearCase
9 12 (2.19%) GitLab
9 12 (2.19%) Mockito
10 11 (2.00%) Atlassian Bamboo
11 9 (1.64%) Team Foundation Server
12 6 (1.09%) Visual Studio
General
1 147 (26.78%) Finance
2 117 (21.31%) Social Skills
3 68 (12.39%) Banking
4 43 (7.83%) Analytical Skills
5 28 (5.10%) Back Office
6 21 (3.83%) Front Office
7 19 (3.46%) Inclusion and Diversity
8 13 (2.37%) Retail
9 12 (2.19%) Law
10 8 (1.46%) Influencing Skills
10 8 (1.46%) Presentation Skills
11 7 (1.28%) Advertising
11 7 (1.28%) Marketing
12 5 (0.91%) Automotive
12 5 (0.91%) Legal
12 5 (0.91%) Private Banking
12 5 (0.91%) Publishing
13 4 (0.73%) French Language
13 4 (0.73%) Investment Banking
13 4 (0.73%) Manufacturing
Job Titles
1 230 (41.89%) Architect
2 187 (34.06%) Solutions Architect
3 67 (12.20%) Developer
4 55 (10.02%) Analyst
5 40 (7.29%) Lead
6 34 (6.19%) Senior
7 24 (4.37%) Enterprise Architect
8 23 (4.19%) Administrator
8 23 (4.19%) Java Developer
9 19 (3.46%) Consultant
10 17 (3.10%) Business Analyst
10 17 (3.10%) Infrastructure Engineer
11 15 (2.73%) Test Analyst
12 14 (2.55%) Automation Test Analyst
13 13 (2.37%) Technical Consultant
14 12 (2.19%) DBA
14 12 (2.19%) Enterprise Infrastructure Architect
14 12 (2.19%) Infrastructure Architect
14 12 (2.19%) Integration Analyst
15 11 (2.00%) Integration Developer
Libraries, Frameworks & Software Standards
1 36 (6.56%) REST
2 34 (6.19%) .NET
3 32 (5.83%) Kafka
3 32 (5.83%) XML
4 29 (5.28%) Web Services
5 28 (5.10%) JSON
6 25 (4.55%) LDAP
7 24 (4.37%) Spring
7 24 (4.37%) Swagger
8 22 (4.01%) Gherkin
9 17 (3.10%) Flask
10 16 (2.91%) SOAP
11 15 (2.73%) RabbitMQ
12 12 (2.19%) OpenAPI
12 12 (2.19%) WireMock
13 10 (1.82%) RESTful
14 9 (1.64%) React Native
15 8 (1.46%) AWS CDK
15 8 (1.46%) AWS SAM
15 8 (1.46%) Redux
Miscellaneous
1 26 (4.74%) Management Information System
2 25 (4.55%) Enterprise Software
3 21 (3.83%) Product Ownership
4 17 (3.10%) Public Cloud
5 16 (2.91%) Reference Data
6 15 (2.73%) Cloud Native
7 14 (2.55%) Greenfield Project
7 14 (2.55%) Mainframe
8 12 (2.19%) Equities
8 12 (2.19%) Fixed Income
8 12 (2.19%) Operational Technology
8 12 (2.19%) Robotics
9 10 (1.82%) Derivative
9 10 (1.82%) Distributed Systems
10 9 (1.64%) Mobile App
11 7 (1.28%) Algorithms
11 7 (1.28%) Cyber Threat
11 7 (1.28%) Data Centre
11 7 (1.28%) Market Risk
11 7 (1.28%) Virtual Team
Operating Systems
1 56 (10.20%) Linux
2 54 (9.84%) Windows
3 23 (4.19%) Unix
4 12 (2.19%) Windows Server
5 10 (1.82%) Android
5 10 (1.82%) zOS
6 8 (1.46%) Apple iOS
7 4 (0.73%) CentOS
7 4 (0.73%) Mac OS
7 4 (0.73%) Ubuntu
7 4 (0.73%) Windows 10
7 4 (0.73%) Windows Server 2019
8 2 (0.36%) Red Hat Enterprise Linux
9 1 (0.18%) AIX
Processes & Methodologies
1 304 (55.37%) Agile
2 199 (36.25%) Software Engineering
3 180 (32.79%) Enterprise Architecture
4 172 (31.33%) TOGAF
5 159 (28.96%) Critical Thinking
6 96 (17.49%) DevOps
7 70 (12.75%) Microservices
8 59 (10.75%) Problem-Solving
9 56 (10.20%) Project Delivery
10 48 (8.74%) CI/CD
11 47 (8.56%) Analytics
12 46 (8.38%) SDLC
13 45 (8.20%) Scrum
13 45 (8.20%) Test Automation
14 40 (7.29%) Artificial Intelligence
14 40 (7.29%) Business Intelligence
15 37 (6.74%) Waterfall
16 34 (6.19%) Roadmaps
17 33 (6.01%) Containerisation
17 33 (6.01%) Test Scripting
Programming Languages
1 99 (18.03%) SQL
2 84 (15.30%) Python
3 75 (13.66%) Java
4 47 (8.56%) C#
5 40 (7.29%) JavaScript
6 28 (5.10%) TypeScript
7 24 (4.37%) C
8 21 (3.83%) Bash
9 16 (2.91%) Perl
10 15 (2.73%) PowerShell
11 13 (2.37%) C++
12 12 (2.19%) Groovy
12 12 (2.19%) Tcl
13 10 (1.82%) Go
14 8 (1.46%) T-SQL
14 8 (1.46%) VBScript
15 7 (1.28%) Shell Script
16 6 (1.09%) VB
17 5 (0.91%) PHP
17 5 (0.91%) PL/SQL
Qualifications
1 43 (7.83%) Degree
2 16 (2.91%) Computer Science Degree
3 9 (1.64%) Azure Certification
4 8 (1.46%) Master's Degree
5 7 (1.28%) Security Cleared
6 5 (0.91%) SC Cleared
7 4 (0.73%) ISTQB
7 4 (0.73%) TOGAF Certification
8 3 (0.55%) MCP
8 3 (0.55%) MCSA
8 3 (0.55%) Microsoft Certification
8 3 (0.55%) PMI Certification
8 3 (0.55%) PMP
9 2 (0.36%) MCSE
10 1 (0.18%) CCNA
10 1 (0.18%) Cisco Certification
10 1 (0.18%) HND
10 1 (0.18%) RHCE
Quality Assurance & Compliance
1 15 (2.73%) Data Quality
2 12 (2.19%) ISO/IEC 27001
2 12 (2.19%) NIST
3 8 (1.46%) PMO
4 7 (1.28%) QA
5 6 (1.09%) COBIT
5 6 (1.09%) PCI DSS
6 4 (0.73%) Actionable Recommendations
7 2 (0.36%) SLA
8 1 (0.18%) Accessibility
8 1 (0.18%) COREP
8 1 (0.18%) IFRS
8 1 (0.18%) IFRS 17
8 1 (0.18%) IFRS 9
System Software
1 14 (2.55%) VMware Infrastructure
2 12 (2.19%) Active Directory
2 12 (2.19%) Apache ZooKeeper
2 12 (2.19%) Docker
3 11 (2.00%) Virtual Machines
4 4 (0.73%) Virtual Desktop
5 1 (0.18%) Ceph
5 1 (0.18%) Firmware
5 1 (0.18%) Gluster
5 1 (0.18%) Virtual Servers
5 1 (0.18%) XenDesktop
Systems Management
1 25 (4.55%) Terraform
2 20 (3.64%) HP Quality Center
2 20 (3.64%) Kubernetes
3 10 (1.82%) Ansible
3 10 (1.82%) Grafana
4 6 (1.09%) Demisto
5 4 (0.73%) Cobbler
5 4 (0.73%) Microsoft Intune
5 4 (0.73%) SysTrack
5 4 (0.73%) ZABBIX
6 3 (0.55%) Oracle RMAN
6 3 (0.55%) Prometheus
6 3 (0.55%) Single Sign-On
7 2 (0.36%) Active Directory Federation Services
7 2 (0.36%) Nagios
8 1 (0.18%) Control-M
8 1 (0.18%) Kibana
8 1 (0.18%) Progress Chef
8 1 (0.18%) Puppet
Vendors
1 75 (13.66%) Microsoft
2 58 (10.56%) Oracle
3 24 (4.37%) IBM
4 22 (4.01%) HP
4 22 (4.01%) SAP
5 21 (3.83%) Salesforce
6 18 (3.28%) MuleSoft
7 15 (2.73%) VMware
8 13 (2.37%) ServiceNow
8 13 (2.37%) Splunk
8 13 (2.37%) TOWER Software
9 12 (2.19%) MKS
10 11 (2.00%) Atlassian
11 8 (1.46%) Google
12 7 (1.28%) Red Hat
12 7 (1.28%) webMethods
13 6 (1.09%) Varonis
14 5 (0.91%) Apple
14 5 (0.91%) Xero
15 4 (0.73%) Software AG