Financial Institution
UK

The table below looks at the prevalence of the term Financial Institution in permanent job vacancies. Included is a benchmarking guide to the salaries offered in vacancies that have cited Financial Institution over the 6 months to 7 December 2023 with a comparison to the same period over the previous 2 years.

6 months to
7 Dec 2023
Same period 2022 Same period 2021
Rank 363 366 496
Rank change year-on-year +3 +130 0
Permanent jobs citing Financial Institution 428 1,116 771
As % of all permanent jobs advertised in the UK 0.81% 0.91% 0.60%
As % of the General category 1.23% 1.32% 1.00%
Number of salaries quoted 320 763 507
10th Percentile £49,750 £47,500 £40,300
25th Percentile £61,250 £56,500 £51,250
Median annual salary (50th Percentile) £77,500 £75,000 £65,000
Median % change year-on-year +3.33% +15.38% -1.52%
75th Percentile £115,000 £97,290 £86,250
90th Percentile £122,500 £117,500 £107,000
UK excluding London median annual salary £62,250 £65,000 £57,000
% change year-on-year -4.23% +14.04% +16.33%

All General Skills
UK

Financial Institution is in the General Skills category. The following table is for comparison with the above and provides summary statistics for all permanent job vacancies with a requirement for common skills.

Permanent vacancies with a requirement for common skills 34,825 84,481 76,781
As % of all permanent jobs advertised in the UK 65.73% 68.77% 59.91%
Number of salaries quoted 24,374 48,187 48,005
10th Percentile £30,500 £32,500 £31,500
25th Percentile £42,500 £45,000 £42,250
Median annual salary (50th Percentile) £60,000 £60,000 £57,500
Median % change year-on-year - +4.35% +4.55%
75th Percentile £80,000 £82,500 £78,750
90th Percentile £100,000 £100,000 £97,500
UK excluding London median annual salary £50,000 £52,500 £49,250
% change year-on-year -4.76% +6.60% +3.68%

Financial Institution
Job Vacancy Trend

Job postings citing Financial Institution as a proportion of all IT jobs advertised.
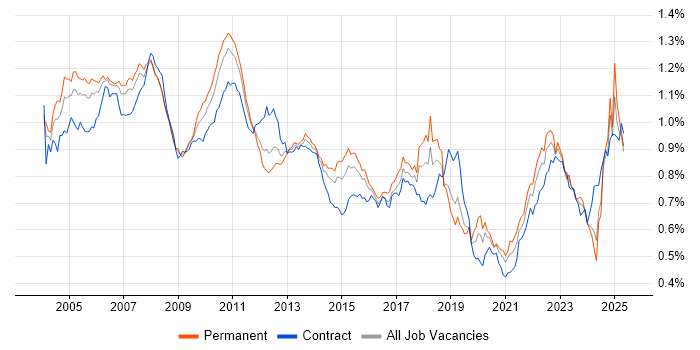
Job vacancy trend for Financial Institution in the UK

Financial Institution
Salary Trend

3-month moving average salary quoted in jobs citing Financial Institution.

Salary trend for Financial Institution in the UK

Financial Institution
Salary Histogram

Salary distribution for jobs citing Financial Institution over the 6 months to 7 December 2023.

Salary histogram for Financial Institution in the UK

Financial Institution
Top 17 Job Locations

The table below looks at the demand and provides a guide to the median salaries quoted in IT jobs citing Financial Institution within the UK over the 6 months to 7 December 2023. The 'Rank Change' column provides an indication of the change in demand within each location based on the same 6 month period last year.

Location Rank Change
on Same Period
Last Year
Matching
Permanent
IT Job Ads
Median Salary
Past 6 Months
Median Salary
% Change
on Same Period
Last Year
Live
Jobs
England -1 377 £80,000 +6.67% 285
London +23 292 £90,000 +5.88% 229
Work from Home +15 176 £80,000 +6.67% 240
UK excluding London +48 121 £62,250 -4.23% 69
South East +67 49 £65,000 -18.75% 33
Scotland +29 29 £73,750 +27.57% 6
Midlands +96 14 £56,750 -5.42% 2
North of England +63 13 £60,000 -7.69% 13
West Midlands +122 8 £60,750 +21.50% 2
Yorkshire +73 8 £60,000 +3.62% 6
East Midlands +23 6 £51,250 -25.45%
South West +53 5 £52,000 -13.33% 8
East of England +125 4 £110,000 +83.33% 1
North West +81 4 £62,500 -3.85% 5
Northern Ireland +38 4 £60,000 - 3
Wales +12 3 £35,000 -56.05% 4
North East +31 1 £42,500 -39.29% 2

Financial Institution
Co-occurring Skills and Capabilities by Category

The follow tables expand on the table above by listing co-occurrences grouped by category. The same employment type, locality and period is covered with up to 20 co-occurrences shown in each of the following categories:

Application Platforms
1 9 (2.10%) Apache Spark
1 9 (2.10%) SAS
2 7 (1.64%) SharePoint
3 5 (1.17%) IIS
3 5 (1.17%) nginx
4 4 (0.93%) Confluence
5 2 (0.47%) MS Exchange
6 1 (0.23%) Apache
6 1 (0.23%) Apache Airflow
6 1 (0.23%) MQSeries
6 1 (0.23%) Oracle SOA Suite
Applications
1 11 (2.57%) Microsoft Office
2 10 (2.34%) Microsoft Excel
3 8 (1.87%) Spreadsheet
4 5 (1.17%) Microsoft PowerPoint
5 4 (0.93%) MS Visio
6 3 (0.70%) Microsoft Project
7 2 (0.47%) Sketch
Business Applications
1 5 (1.17%) Adaptiv
2 4 (0.93%) Front Arena
3 2 (0.47%) Dynamics CRM
3 2 (0.47%) Misys Equation
3 2 (0.47%) Sparx Enterprise Architect
4 1 (0.23%) Distributed Ledger
Cloud Services
1 99 (23.13%) Azure
2 95 (22.20%) AWS
3 35 (8.18%) GCP
4 33 (7.71%) Microsoft 365
5 25 (5.84%) SaaS
6 24 (5.61%) IaaS
7 16 (3.74%) PaaS
8 15 (3.50%) GitHub
9 14 (3.27%) Datadog
10 13 (3.04%) Azure DevOps
11 12 (2.80%) Power Platform
12 11 (2.57%) Serverless
13 10 (2.34%) Cloud Computing
14 8 (1.87%) Azure Logic Apps
14 8 (1.87%) Entra ID
15 7 (1.64%) Azure API Management
15 7 (1.64%) Azure ExpressRoute
16 5 (1.17%) Azure Data Factory
16 5 (1.17%) GitHub Actions
17 4 (0.93%) BlazeMeter
Communications & Networking
1 25 (5.84%) Firewall
2 23 (5.37%) Internet
3 20 (4.67%) DHCP
3 20 (4.67%) DNS
4 16 (3.74%) VPN
5 12 (2.80%) H.323
5 12 (2.80%) Unified Communications
5 12 (2.80%) VoIP
5 12 (2.80%) WebEx
6 9 (2.10%) SAN
7 8 (1.87%) VLAN
7 8 (1.87%) Wi-Fi
8 6 (1.40%) Network Security
8 6 (1.40%) Wireless
9 5 (1.17%) OpenVPN
10 4 (0.93%) DSL
10 4 (0.93%) Software-Defined Networking
11 3 (0.70%) Intrusion Detection
11 3 (0.70%) SSL
11 3 (0.70%) WAN
Database & Business Intelligence
1 28 (6.54%) SQL Server
2 20 (4.67%) Data Warehouse
3 13 (3.04%) MongoDB
4 11 (2.57%) Big Data
4 11 (2.57%) Relational Database
5 10 (2.34%) Elasticsearch
5 10 (2.34%) NoSQL
5 10 (2.34%) Power BI
6 9 (2.10%) Data Lake
7 7 (1.64%) Tableau
8 6 (1.40%) SQL Server Integration Services
9 5 (1.17%) DB2
9 5 (1.17%) MySQL
10 4 (0.93%) Metadata
10 4 (0.93%) SQL Server Analysis Services
11 2 (0.47%) Azure SQL Database
11 2 (0.47%) BigQuery
11 2 (0.47%) Bigtable
11 2 (0.47%) Oracle Reports
12 1 (0.23%) Data Mining
Development Applications
1 30 (7.01%) Jenkins
2 21 (4.91%) Maven
3 14 (3.27%) Git
4 9 (2.10%) HP UFT
4 9 (2.10%) JIRA
5 8 (1.87%) GitLab
6 7 (1.64%) Cypress.io
7 6 (1.40%) Atlassian Bamboo
7 6 (1.40%) Bitbucket
7 6 (1.40%) Selenium
7 6 (1.40%) WebDriver
8 5 (1.17%) Gradle
8 5 (1.17%) JUnit
9 4 (0.93%) Subversion
10 3 (0.70%) Cucumber
11 2 (0.47%) Sonatype Nexus
12 1 (0.23%) ESLint
12 1 (0.23%) Karma Test Runner
12 1 (0.23%) Moq
12 1 (0.23%) Storybook
General
1 428 (100.00%) Finance
2 113 (26.40%) Social Skills
3 82 (19.16%) Banking
4 80 (18.69%) Law
5 65 (15.19%) Analytical Skills
6 48 (11.21%) Inclusion and Diversity
7 40 (9.35%) Legal
8 33 (7.71%) Investment Banking
9 30 (7.01%) Marketing
10 23 (5.37%) Front Office
11 16 (3.74%) Aviation
12 14 (3.27%) Organisational Skills
13 13 (3.04%) Telecoms
14 12 (2.80%) Back Office
15 11 (2.57%) Private Banking
16 7 (1.64%) Retail
17 6 (1.40%) Agriculture
17 6 (1.40%) Presentation Skills
18 4 (0.93%) Influencing Skills
19 2 (0.47%) Manufacturing
Job Titles
1 70 (16.36%) Senior
2 65 (15.19%) Developer
3 58 (13.55%) Lead
4 51 (11.92%) Software Engineer
5 44 (10.28%) Analyst
6 33 (7.71%) Senior Developer
7 32 (7.48%) Java Developer
8 21 (4.91%) Architect
9 20 (4.67%) Commodities Java Developer
9 20 (4.67%) Java Pricing Developer
9 20 (4.67%) Pricing Developer
9 20 (4.67%) Senior Java Developer
9 20 (4.67%) Team Leader
10 17 (3.97%) DevOps Engineer
10 17 (3.97%) Support Engineer
11 16 (3.74%) Applications Support
11 16 (3.74%) Data Analyst
12 14 (3.27%) Engineering Manager
13 13 (3.04%) AWS Engineer
13 13 (3.04%) Project Manager
Libraries, Frameworks & Software Standards
1 26 (6.07%) REST
2 23 (5.37%) Kafka
3 22 (5.14%) Spring
4 20 (4.67%) J2SE
4 20 (4.67%) Spring Boot
4 20 (4.67%) Web Services
5 19 (4.44%) AngularJS
6 16 (3.74%) .NET
6 16 (3.74%) HTML
7 15 (3.50%) React
8 13 (3.04%) Node.js
9 12 (2.80%) JPA
10 11 (2.57%) FIX Protocol
10 11 (2.57%) XML
11 10 (2.34%) RESTful
12 9 (2.10%) Hibernate
13 8 (1.87%) CSS
13 8 (1.87%) JSON
14 7 (1.64%) Apache Camel
15 6 (1.40%) Apache Thrift
Miscellaneous
1 55 (12.85%) Management Information System
2 36 (8.41%) Foreign Exchange (FX)
3 29 (6.78%) Hedge funds
4 27 (6.31%) Derivative
4 27 (6.31%) Equities
5 26 (6.07%) Cloud Native
6 23 (5.37%) Distributed Applications
7 18 (4.21%) Onboarding
8 17 (3.97%) Algorithms
9 16 (3.74%) Public Cloud
10 13 (3.04%) Video Conferencing
10 13 (3.04%) Virtual Team
11 12 (2.80%) Product Ownership
12 10 (2.34%) Distributed Systems
13 9 (2.10%) iSeries
13 9 (2.10%) Reference Data
14 8 (1.87%) Credit Risk
15 7 (1.64%) Fixed Income
15 7 (1.64%) Market Risk
16 6 (1.40%) Data Centre
Operating Systems
1 51 (11.92%) Linux
2 46 (10.75%) Windows
3 21 (4.91%) Unix
4 14 (3.27%) Windows 10
5 13 (3.04%) Windows Server
6 9 (2.10%) Windows Server 2016
7 6 (1.40%) Windows 7
8 5 (1.17%) CentOS
8 5 (1.17%) Ubuntu
9 4 (0.93%) Mac OS
10 3 (0.70%) Windows Server 2008
10 3 (0.70%) Windows Server 2012
11 2 (0.47%) Solaris
11 2 (0.47%) VMS
12 1 (0.23%) Android
Processes & Methodologies
1 101 (23.60%) Agile
2 86 (20.09%) Problem-Solving
3 78 (18.22%) Software Engineering
4 69 (16.12%) DevOps
5 68 (15.89%) SDLC
6 63 (14.72%) CI/CD
7 58 (13.55%) Asset Management
7 58 (13.55%) Microservices
8 56 (13.08%) Computer Science
9 43 (10.05%) Fintech
10 41 (9.58%) Analytics
10 41 (9.58%) Low Latency
11 40 (9.35%) Mentoring
12 37 (8.64%) Requirements Gathering
13 34 (7.94%) Artificial Intelligence
14 33 (7.71%) Mathematics
15 32 (7.48%) Machine Learning
16 31 (7.24%) ETL
17 29 (6.78%) Market Making
18 28 (6.54%) IT Strategy
Programming Languages
1 116 (27.10%) SQL
2 96 (22.43%) Java
3 76 (17.76%) Python
4 36 (8.41%) JavaScript
5 30 (7.01%) PowerShell
6 19 (4.44%) C#
7 17 (3.97%) C++
8 16 (3.74%) Bash
9 14 (3.27%) Go
9 14 (3.27%) TypeScript
10 8 (1.87%) Scala
11 6 (1.40%) Ruby
12 5 (1.17%) Shell Script
12 5 (1.17%) T-SQL
13 4 (0.93%) Data Analysis Expressions
13 4 (0.93%) PL/SQL
13 4 (0.93%) VBA
14 2 (0.47%) MATLAB
15 1 (0.23%) C
15 1 (0.23%) VB
Qualifications
1 61 (14.25%) Degree
2 37 (8.64%) Computer Science Degree
3 11 (2.57%) Azure Certification
4 8 (1.87%) AWS Certification
4 8 (1.87%) Cisco Certification
5 6 (1.40%) CISM
5 6 (1.40%) CISSP
6 5 (1.17%) Master's Degree
7 4 (0.93%) PMI Certification
7 4 (0.93%) PRINCE2 Certification
8 3 (0.70%) (ISC)2 CCSP
8 3 (0.70%) APMG
8 3 (0.70%) AWS Certified Solutions Architect
8 3 (0.70%) CCSP
9 2 (0.47%) CCIE
9 2 (0.47%) CCIE Routing and Switching
9 2 (0.47%) CCNA
9 2 (0.47%) CCNP
9 2 (0.47%) CFA
10 1 (0.23%) ISTQB
Quality Assurance & Compliance
1 17 (3.97%) Data Quality
1 17 (3.97%) SLA
2 11 (2.57%) Accessibility
3 3 (0.70%) MiFID
3 3 (0.70%) PMO
4 2 (0.47%) ISO/IEC 27001
4 2 (0.47%) NIST
4 2 (0.47%) QA
5 1 (0.23%) Actionable Recommendations
5 1 (0.23%) COBIT
5 1 (0.23%) EMIR
5 1 (0.23%) GDPR
5 1 (0.23%) PCI DSS
System Software
1 35 (8.18%) Active Directory
2 22 (5.14%) Docker
3 10 (2.34%) Virtual Machines
4 7 (1.64%) Slurm Workload Manager
5 2 (0.47%) ACF2
5 2 (0.47%) IAG
5 2 (0.47%) RACF
6 1 (0.23%) BitLocker
6 1 (0.23%) VMware ESXi
6 1 (0.23%) VMware Infrastructure
Systems Management
1 42 (9.81%) Kubernetes
2 30 (7.01%) SCCM
3 22 (5.14%) Terraform
4 15 (3.50%) Ansible
5 13 (3.04%) Cisco CUCM
5 13 (3.04%) Grafana
6 12 (2.80%) Cisco Prime
6 12 (2.80%) Cisco UCCX
7 9 (2.10%) Prometheus
8 6 (1.40%) Control-M
8 6 (1.40%) Puppet
9 5 (1.17%) Oracle Enterprise Manager
9 5 (1.17%) SafeCom
10 3 (0.70%) Kibana
10 3 (0.70%) Progress Chef
11 2 (0.47%) BMC PATROL
11 2 (0.47%) EMC NetWorker
11 2 (0.47%) NetBackup
11 2 (0.47%) Podman
12 1 (0.23%) Microsoft Intune
Vendors
1 70 (16.36%) Microsoft
2 25 (5.84%) Oracle
3 17 (3.97%) Cisco
4 16 (3.74%) VMware
5 15 (3.50%) Splunk
6 13 (3.04%) Salesforce
7 12 (2.80%) Dynatrace
8 10 (2.34%) ServiceNow
9 8 (1.87%) AppDynamics
10 7 (1.64%) Databricks
10 7 (1.64%) Google
11 6 (1.40%) Alteryx
11 6 (1.40%) Informatica
11 6 (1.40%) Sybase
12 5 (1.17%) Confluent
12 5 (1.17%) HubSpot
12 5 (1.17%) SolarWinds
12 5 (1.17%) Veritas
13 4 (0.93%) F5
13 4 (0.93%) HP