Public Sector
UK

The table below looks at the prevalence of the term Public Sector in permanent job vacancies. Included is a benchmarking guide to the salaries offered in vacancies that have cited Public Sector over the 6 months to 2 December 2023 with a comparison to the same period over the previous 2 years.

6 months to
2 Dec 2023
Same period 2022 Same period 2021
Rank 71 99 121
Rank change year-on-year +28 +22 -12
Permanent jobs citing Public Sector 2,182 4,251 3,908
As % of all permanent jobs advertised in the UK 4.09% 3.39% 3.02%
As % of the General category 6.22% 4.94% 5.04%
Number of salaries quoted 1,605 2,831 2,625
10th Percentile £29,500 £32,000 £32,750
25th Percentile £40,000 £42,500 £41,250
Median annual salary (50th Percentile) £55,000 £57,384 £55,000
Median % change year-on-year -4.15% +4.33% +8.91%
75th Percentile £71,250 £75,090 £73,750
90th Percentile £87,500 £91,250 £88,750
UK excluding London median annual salary £50,000 £50,000 £47,500
% change year-on-year - +5.26% -5.00%

All General Skills
UK

Public Sector is in the General Skills category. The following table is for comparison with the above and provides summary statistics for all permanent job vacancies with a requirement for common skills.

Permanent vacancies with a requirement for common skills 35,097 86,059 77,509
As % of all permanent jobs advertised in the UK 65.77% 68.66% 59.93%
Number of salaries quoted 24,595 48,938 48,014
10th Percentile £30,625 £32,500 £31,500
25th Percentile £42,500 £45,000 £42,250
Median annual salary (50th Percentile) £60,000 £60,000 £57,500
Median % change year-on-year - +4.35% +4.55%
75th Percentile £80,000 £82,500 £78,750
90th Percentile £100,000 £100,000 £97,500
UK excluding London median annual salary £50,000 £52,500 £49,500
% change year-on-year -4.76% +6.06% +4.21%

Public Sector
Job Vacancy Trend

Job postings citing Public Sector as a proportion of all IT jobs advertised.
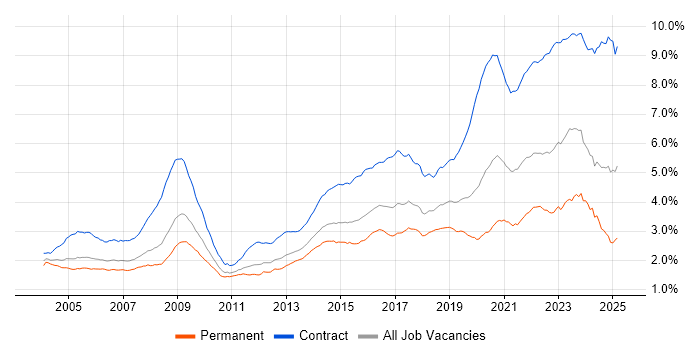
Job vacancy trend for Public Sector in the UK

Public Sector
Salary Trend

3-month moving average salary quoted in jobs citing Public Sector.

Salary trend for Public Sector in the UK

Public Sector
Salary Histogram

Salary distribution for jobs citing Public Sector over the 6 months to 2 December 2023.

Salary histogram for Public Sector in the UK

Public Sector
Top 17 Job Locations

The table below looks at the demand and provides a guide to the median salaries quoted in IT jobs citing Public Sector within the UK over the 6 months to 2 December 2023. The 'Rank Change' column provides an indication of the change in demand within each location based on the same 6 month period last year.

Location Rank Change
on Same Period
Last Year
Matching
Permanent
IT Job Ads
Median Salary
Past 6 Months
Median Salary
% Change
on Same Period
Last Year
Live
Jobs
England +28 1,778 £55,000 -1.79% 1,328
UK excluding London +32 1,333 £50,000 - 888
Work from Home +4 999 £57,000 -0.87% 639
London +41 575 £65,000 -3.70% 540
North of England +26 400 £49,557 +6.57% 247
South West +9 251 £50,000 +11.11% 136
South East +37 232 £49,720 -13.53% 217
Midlands -8 183 £54,000 -1.82% 124
North West +24 178 £49,500 +6.10% 129
Yorkshire +26 176 £47,750 +6.11% 84
West Midlands -7 128 £54,075 -1.68% 101
Scotland +21 121 £48,814 +2.33% 86
East of England +128 67 £42,500 -22.73% 61
Northern Ireland +71 55 £37,250 -42.69% 10
East Midlands +5 54 £52,500 -4.55% 23
North East +21 48 £54,500 -12.80% 34
Wales +7 42 £53,750 +23.12% 29

Public Sector
Co-occurring Skills and Capabilities by Category

The follow tables expand on the table above by listing co-occurrences grouped by category. The same employment type, locality and period is covered with up to 20 co-occurrences shown in each of the following categories:

Application Platforms
1 97 (4.45%) Red Hat Fuse
2 95 (4.35%) JBoss
3 52 (2.38%) SharePoint
4 36 (1.65%) Confluence
5 22 (1.01%) MS Exchange
6 19 (0.87%) IIS
7 14 (0.64%) CMS
7 14 (0.64%) OpenStack
8 12 (0.55%) Anypoint
9 9 (0.41%) WebSphere
10 8 (0.37%) Apache
10 8 (0.37%) Skype for Business
10 8 (0.37%) Umbraco
11 5 (0.23%) ArcGIS
11 5 (0.23%) SAS
12 4 (0.18%) Drupal
13 3 (0.14%) WordPress
14 2 (0.092%) Cloud Foundry
14 2 (0.092%) NServiceBus
14 2 (0.092%) Sitecore CMS
Applications
1 101 (4.63%) Microsoft Excel
2 90 (4.12%) Microsoft Office
3 75 (3.44%) Spreadsheet
4 57 (2.61%) Microsoft PowerPoint
5 51 (2.34%) Microsoft Project
6 24 (1.10%) MS Visio
7 10 (0.46%) AutoCAD
8 9 (0.41%) SOLIDWORKS
9 7 (0.32%) PTC Creo
9 7 (0.32%) Simulink
9 7 (0.32%) Trello
10 4 (0.18%) OrCAD
11 2 (0.092%) ArcView
11 2 (0.092%) Blender
11 2 (0.092%) TargetLink
12 1 (0.046%) Adobe XD
12 1 (0.046%) Photoshop
12 1 (0.046%) PrintSoft PReS
12 1 (0.046%) Sketch
12 1 (0.046%) SPSS
Business Applications
1 28 (1.28%) Dynamics CRM
2 24 (1.10%) SAP ERP
3 12 (0.55%) SAP S/4HANA
4 7 (0.32%) Oracle EBS
5 6 (0.27%) Exstream
5 6 (0.27%) iTrent
6 5 (0.23%) SAP MM
6 5 (0.23%) Unit4 Business World
7 4 (0.18%) SAP Payroll
8 3 (0.14%) Primavera
8 3 (0.14%) SAP Business One
8 3 (0.14%) SAP IS-U
8 3 (0.14%) SAP PSCD
9 2 (0.092%) Cerner Millennium
9 2 (0.092%) Northgate Housing
9 2 (0.092%) Oracle ERP
9 2 (0.092%) Remedy ITSM
9 2 (0.092%) SAP BRIM
9 2 (0.092%) SAP GRC
9 2 (0.092%) SAP Hybris
Cloud Services
1 394 (18.06%) Azure
2 304 (13.93%) AWS
3 166 (7.61%) Microsoft 365
4 110 (5.04%) Power Platform
5 88 (4.03%) Azure DevOps
6 87 (3.99%) GCP
7 66 (3.02%) SaaS
8 53 (2.43%) GitHub
8 53 (2.43%) Serverless
9 45 (2.06%) Entra ID
10 34 (1.56%) PowerApps
11 32 (1.47%) PaaS
12 29 (1.33%) Cloud Computing
12 29 (1.33%) IaaS
13 28 (1.28%) Amazon EKS
13 28 (1.28%) Dynamics 365
14 27 (1.24%) AWS Lambda
15 25 (1.15%) GitHub Actions
16 24 (1.10%) Amazon S3
17 20 (0.92%) Power Automate
Communications & Networking
1 176 (8.07%) Firewall
2 62 (2.84%) WAN
3 56 (2.57%) VPN
4 54 (2.47%) Wireless
5 50 (2.29%) LAN
6 34 (1.56%) Wi-Fi
7 32 (1.47%) DNS
7 32 (1.47%) SD-WAN
8 31 (1.42%) OSPF
9 30 (1.37%) Network Security
10 26 (1.19%) Cisco ASA
11 25 (1.15%) BGP
12 24 (1.10%) SAN
13 21 (0.96%) DHCP
13 21 (0.96%) TCP/IP
14 17 (0.78%) Intrusion Detection
15 16 (0.73%) EIGRP
15 16 (0.73%) HTTP
15 16 (0.73%) Internet
15 16 (0.73%) VLAN
Database & Business Intelligence
1 88 (4.03%) SQL Server
2 68 (3.12%) Power BI
3 56 (2.57%) Relational Database
4 46 (2.11%) MySQL
5 40 (1.83%) Data Warehouse
6 39 (1.79%) PostgreSQL
7 38 (1.74%) NoSQL
8 35 (1.60%) Oracle Database
9 33 (1.51%) Oracle Reports
10 31 (1.42%) Data Lake
11 29 (1.33%) SQL Server Integration Services
12 25 (1.15%) Big Data
13 24 (1.10%) JasperReports
13 24 (1.10%) MongoDB
14 23 (1.05%) Metadata
15 18 (0.82%) GIS
16 14 (0.64%) SQL Server Reporting Services
16 14 (0.64%) Tableau
17 13 (0.60%) Geospatial Data
17 13 (0.60%) Metadata Repository
Development Applications
1 115 (5.27%) Jenkins
2 97 (4.45%) Git
3 90 (4.12%) IntelliJ
4 81 (3.71%) JIRA
5 56 (2.57%) Selenium
6 38 (1.74%) Maven
7 27 (1.24%) GitLab
8 25 (1.15%) Oracle APEX
9 24 (1.10%) JUnit
10 21 (0.96%) Visual Studio
11 20 (0.92%) Cucumber
12 15 (0.69%) Oracle Forms
13 13 (0.60%) SonarQube
14 11 (0.50%) git-flow
15 10 (0.46%) Chocolatey
16 9 (0.41%) TeamCity
17 8 (0.37%) Artifactory
17 8 (0.37%) Bitbucket
18 7 (0.32%) SQL Server Management Studio (SSMS)
18 7 (0.32%) WebDriver
General
1 595 (27.27%) Social Skills
2 522 (23.92%) Finance
3 242 (11.09%) Marketing
4 227 (10.40%) Manufacturing
5 213 (9.76%) Telecoms
6 197 (9.03%) Inclusion and Diversity
7 186 (8.52%) Electronics
8 165 (7.56%) Analytical Skills
9 107 (4.90%) Retail
10 100 (4.58%) Organisational Skills
11 97 (4.45%) Presentation Skills
12 83 (3.80%) Local Government
13 53 (2.43%) Legal
14 52 (2.38%) Automotive
15 42 (1.92%) Aerospace
16 36 (1.65%) Law
17 34 (1.56%) Aviation
17 34 (1.56%) Influencing Skills
18 25 (1.15%) Banking
19 23 (1.05%) Police
Job Titles
1 395 (18.10%) Senior
2 225 (10.31%) Developer
3 181 (8.30%) Consultant
4 167 (7.65%) Analyst
5 161 (7.38%) Architect
6 159 (7.29%) Project Manager
7 130 (5.96%) Lead
8 126 (5.77%) Software Engineer
9 95 (4.35%) Senior Developer
10 88 (4.03%) Senior Software Engineer
11 75 (3.44%) Business Analyst
12 72 (3.30%) Java Engineer
13 68 (3.12%) DevOps Engineer
13 68 (3.12%) Solutions Architect
14 67 (3.07%) Java Software Engineer
14 67 (3.07%) Senior Manager
15 66 (3.02%) Senior Java Engineer
16 64 (2.93%) Senior Java Software Engineer
17 60 (2.75%) Java Developer
18 55 (2.52%) IT Manager
Libraries, Frameworks & Software Standards
1 161 (7.38%) REST
2 159 (7.29%) Spring
3 158 (7.24%) XML
4 141 (6.46%) Web Services
5 138 (6.32%) JSON
6 125 (5.73%) .NET
7 124 (5.68%) SOAP
8 122 (5.59%) AngularJS
9 105 (4.81%) Hibernate
10 100 (4.58%) RESTful
11 93 (4.26%) JPA
12 87 (3.99%) XSD
13 78 (3.57%) Java EE
14 61 (2.80%) HTML
15 52 (2.38%) CSS
15 52 (2.38%) Velocity
16 43 (1.97%) Node.js
17 40 (1.83%) Elastic Stack
18 37 (1.70%) Spring Boot
19 29 (1.33%) React
Miscellaneous
1 116 (5.32%) Management Information System
2 98 (4.49%) Onboarding
3 73 (3.35%) Product Ownership
4 69 (3.16%) Self-Motivation
5 66 (3.02%) NHS
6 51 (2.34%) Cyberattack
7 49 (2.25%) Data Centre
8 47 (2.15%) Driving Licence
8 47 (2.15%) Low-Code
9 45 (2.06%) PKI
10 41 (1.88%) Distributed Systems
11 28 (1.28%) Public Cloud
12 25 (1.15%) Enterprise Software
13 21 (0.96%) Social Media
14 19 (0.87%) Embedded Systems
15 15 (0.69%) Data Structures
16 14 (0.64%) Algorithms
17 13 (0.60%) FPGA
17 13 (0.60%) Legacy Systems
17 13 (0.60%) Operational Technology
Operating Systems
1 207 (9.49%) Windows
2 113 (5.18%) Linux
3 86 (3.94%) Windows Server
4 26 (1.19%) Windows Server 2012
5 23 (1.05%) Windows 10
5 23 (1.05%) Windows Server 2019
6 19 (0.87%) Windows Server 2016
7 16 (0.73%) Android
8 15 (0.69%) Unix
9 11 (0.50%) Apple iOS
10 7 (0.32%) Red Hat Enterprise Linux
11 6 (0.27%) VMS
12 4 (0.18%) Mac OS
12 4 (0.18%) Ubuntu
13 2 (0.092%) Solaris
13 2 (0.092%) Windows 7
14 1 (0.046%) Debian
14 1 (0.046%) Windows Server 2003
14 1 (0.046%) Windows Vista
14 1 (0.046%) Windows XP
Processes & Methodologies
1 678 (31.07%) Agile
2 396 (18.15%) Problem-Solving
3 305 (13.98%) Project Delivery
4 292 (13.38%) Project Management
5 287 (13.15%) Stakeholder Management
6 270 (12.37%) Business Intelligence
7 256 (11.73%) Mentoring
8 240 (11.00%) Programme Management
9 239 (10.95%) Software Engineering
10 216 (9.90%) DevOps
11 199 (9.12%) Actionable Insight
12 198 (9.07%) Cybersecurity
13 189 (8.66%) Digital Marketing
14 178 (8.16%) ITIL
15 170 (7.79%) Collaborative Working
16 164 (7.52%) Scrum
17 156 (7.15%) PRINCE2
18 147 (6.74%) CI/CD
19 143 (6.55%) Service Delivery
20 132 (6.05%) Analytics
Programming Languages
1 290 (13.29%) Java
2 218 (9.99%) SQL
3 197 (9.03%) Python
4 130 (5.96%) JavaScript
5 116 (5.32%) C#
6 85 (3.90%) PowerShell
7 59 (2.70%) Bash
8 48 (2.20%) Ruby
9 47 (2.15%) C
10 46 (2.11%) C++
11 32 (1.47%) TypeScript
12 31 (1.42%) Go
13 26 (1.19%) VB.NET
14 24 (1.10%) Perl
15 22 (1.01%) MATLAB
15 22 (1.01%) PL/SQL
16 21 (0.96%) PHP
17 16 (0.73%) Shell Script
18 14 (0.64%) R
19 10 (0.46%) Embedded C
Qualifications
1 735 (33.68%) Security Cleared
2 502 (23.01%) SC Cleared
3 379 (17.37%) Degree
4 145 (6.65%) BPSS Clearance
5 78 (3.57%) DBS Check
6 75 (3.44%) DV Cleared
7 72 (3.30%) Master's Degree
8 71 (3.25%) Microsoft Certification
9 68 (3.12%) Computer Science Degree
10 66 (3.02%) CISSP
11 58 (2.66%) Cisco Certification
12 46 (2.11%) Azure Certification
13 41 (1.88%) CCNA
14 38 (1.74%) CCNP
15 37 (1.70%) PMI Certification
16 34 (1.56%) AWS Certification
17 32 (1.47%) PMP
18 29 (1.33%) CISM
19 25 (1.15%) CESG Certified Professional
19 25 (1.15%) MCSE
Quality Assurance & Compliance
1 107 (4.90%) ISO/IEC 27001
2 90 (4.12%) GDPR
3 86 (3.94%) QA
4 59 (2.70%) Cyber Essentials
5 57 (2.61%) PMO
6 55 (2.52%) SLA
7 45 (2.06%) Data Quality
8 39 (1.79%) NIST
9 37 (1.70%) HMG Security Policy Framework
10 35 (1.60%) NCSC
11 33 (1.51%) Accessibility
12 28 (1.28%) ISO 9001
13 21 (0.96%) GRC
14 17 (0.78%) Cyber Essentials PLUS
14 17 (0.78%) ISO/IEC 17025
15 15 (0.69%) COBIT
15 15 (0.69%) NIST 800
16 12 (0.55%) ISO/IEC 20000
17 11 (0.50%) PCI DSS
18 6 (0.27%) ISO 26262
System Software
1 142 (6.51%) Active Directory
2 91 (4.17%) Docker
3 35 (1.60%) Hyper-V
3 35 (1.60%) VMware Infrastructure
4 25 (1.15%) Firmware
5 16 (0.73%) vSphere
6 15 (0.69%) VMware NSX
7 10 (0.46%) Embedded Firmware
8 9 (0.41%) VMware ESXi
9 8 (0.37%) Virtual Machines
10 4 (0.18%) Oracle RAC
10 4 (0.18%) Virtual Desktop
10 4 (0.18%) Virtual Servers
11 3 (0.14%) KVM
12 2 (0.092%) Microsoft Virtual Server
12 2 (0.092%) Postfix
13 1 (0.046%) Microsoft App-V
13 1 (0.046%) NFS
Systems Management
1 115 (5.27%) Terraform
2 91 (4.17%) Ansible
3 89 (4.08%) Kubernetes
4 26 (1.19%) SCCM
5 25 (1.15%) Microsoft Intune
6 22 (1.01%) Puppet
7 18 (0.82%) Progress Chef
8 17 (0.78%) EnCase
9 16 (0.73%) FortiGate
10 13 (0.60%) Active Directory Federation Services
11 11 (0.50%) Prometheus
12 10 (0.46%) Packer
13 9 (0.41%) Grafana
14 8 (0.37%) SCOM
15 5 (0.23%) AirWatch
15 5 (0.23%) Cisco CUCM
15 5 (0.23%) Nessus
16 3 (0.14%) Functional Safety
16 3 (0.14%) vCenter Server
17 2 (0.092%) Single Sign-On
Vendors
1 395 (18.10%) Microsoft
2 259 (11.87%) SAP
3 132 (6.05%) Oracle
4 98 (4.49%) Cisco
5 78 (3.57%) VMware
6 62 (2.84%) ServiceNow
7 59 (2.70%) Google
8 58 (2.66%) Salesforce
9 30 (1.37%) CheckPoint
10 28 (1.28%) Aruba
11 23 (1.05%) CA
11 23 (1.05%) Meraki
12 21 (0.96%) MuleSoft
13 17 (0.78%) IBM
14 16 (0.73%) Databricks
15 14 (0.64%) Juniper
15 14 (0.64%) Red Hat
15 14 (0.64%) Splunk
15 14 (0.64%) Veeam
15 14 (0.64%) WSO2