Acceptance Criteria
UK

The following table provides summary statistics for permanent job vacancies with a requirement for Acceptance Criteria skills. Included is a benchmarking guide to the salaries offered in vacancies that have cited Acceptance Criteria over the 6 months to 28 November 2023 with a comparison to the same period in the previous 2 years.

6 months to
28 Nov 2023
Same period 2022 Same period 2021
Rank 401 273 332
Rank change year-on-year -128 +59 +87
Permanent jobs citing Acceptance Criteria 369 1,688 1,397
As % of all permanent jobs advertised in the UK 0.68% 1.35% 1.09%
As % of the Processes & Methodologies category 0.72% 1.41% 1.14%
Number of salaries quoted 312 960 892
10th Percentile £36,250 £39,333 £36,750
25th Percentile £42,500 £46,250 £42,500
Median annual salary (50th Percentile) £57,500 £57,500 £55,000
Median % change year-on-year - +4.55% -4.35%
75th Percentile £75,000 £73,750 £68,340
90th Percentile £89,875 £85,000 £78,750
UK excluding London median annual salary £50,000 £50,000 £47,500
% change year-on-year - +5.26% -5.00%

All Process and Methodology Skills
UK

Acceptance Criteria is in the Processes and Methodologies category. The following table is for comparison with the above and provides summary statistics for all permanent job vacancies with a requirement for process or methodology skills.

Permanent vacancies with a requirement for process or methodology skills 51,121 120,104 122,523
As % of all permanent jobs advertised in the UK 94.09% 95.72% 95.43%
Number of salaries quoted 36,956 73,203 81,032
10th Percentile £32,500 £34,313 £32,500
25th Percentile £43,750 £45,000 £42,500
Median annual salary (50th Percentile) £60,000 £60,000 £59,000
Median % change year-on-year - +1.69% +7.27%
75th Percentile £80,000 £81,250 £77,500
90th Percentile £98,750 £100,000 £95,000
UK excluding London median annual salary £52,500 £53,000 £50,000
% change year-on-year -0.94% +6.00% +4.17%

Acceptance Criteria
Job Vacancy Trend

Job postings citing Acceptance Criteria as a proportion of all IT jobs advertised.
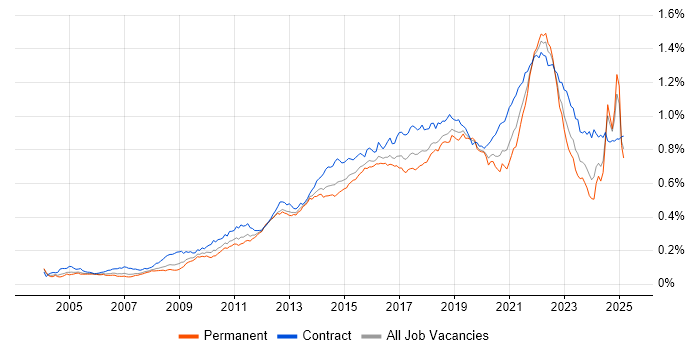
Job vacancy trend for Acceptance Criteria in the UK

Acceptance Criteria
Salary Trend

3-month moving average salary quoted in jobs citing Acceptance Criteria.

Salary trend for Acceptance Criteria in the UK

Acceptance Criteria
Salary Histogram

Salary distribution for jobs citing Acceptance Criteria over the 6 months to 28 November 2023.

Salary histogram for Acceptance Criteria in the UK

Acceptance Criteria
Top 16 Job Locations

The table below looks at the demand and provides a guide to the median salaries quoted in IT jobs citing Acceptance Criteria within the UK over the 6 months to 28 November 2023. The 'Rank Change' column provides an indication of the change in demand within each location based on the same 6 month period last year.

Location Rank Change
on Same Period
Last Year
Matching
Permanent
IT Job Ads
Median Salary
Past 6 Months
Median Salary
% Change
on Same Period
Last Year
Live
Jobs
England -110 312 £57,500 - 172
UK excluding London -108 174 £50,000 - 113
London -24 170 £72,000 +2.86% 65
Work from Home -139 133 £57,500 +4.55% 82
North of England -7 55 £54,000 +8.00% 31
North West +47 37 £55,000 +10.00% 15
South West +27 29 £52,500 +25.13% 21
South East -22 28 £45,000 -21.74% 37
Wales +15 24 £45,000 -10.00% 2
Midlands +16 20 £54,310 +8.62% 10
Yorkshire +16 18 £53,000 +0.95% 14
West Midlands +19 17 £57,500 +17.95% 8
East of England +111 10 £45,000 -30.77% 5
Scotland +5 9 £55,000 +17.53% 7
East Midlands +25 3 £43,000 -14.00% 2
Northern Ireland +17 2 £50,000 +9.89% 1

Acceptance Criteria
Co-occurring Skills and Capabilities by Category

The follow tables expand on the table above by listing co-occurrences grouped by category. The same employment type, locality and period is covered with up to 20 co-occurrences shown in each of the following categories:

Application Platforms
1 31 (8.40%) Confluence
2 13 (3.52%) CMS
3 5 (1.36%) IIS
3 5 (1.36%) SharePoint
4 3 (0.81%) Drupal
5 2 (0.54%) IBM HTTP Server
5 2 (0.54%) Umbraco
5 2 (0.54%) WebSphere
6 1 (0.27%) Apache Airflow
6 1 (0.27%) EPiServer
Applications
1 17 (4.61%) Microsoft Excel
2 12 (3.25%) Microsoft PowerPoint
3 4 (1.08%) MS Visio
4 3 (0.81%) Trello
5 2 (0.54%) Microsoft Office
6 1 (0.27%) Siemens NX
Business Applications
1 11 (2.98%) Visualfiles
2 10 (2.71%) Endur
3 5 (1.36%) Dynamics CRM
4 3 (0.81%) Teamcenter
5 2 (0.54%) Magento
5 2 (0.54%) OpenLink RightAngle
5 2 (0.54%) Oracle Cash Management
6 1 (0.27%) Aladdin
6 1 (0.27%) Shopify
6 1 (0.27%) Sparx Enterprise Architect
6 1 (0.27%) thinkFolio
Cloud Services
1 83 (22.49%) Azure
2 46 (12.47%) Azure DevOps
3 21 (5.69%) GitHub
4 20 (5.42%) AWS
5 16 (4.34%) Power Platform
6 14 (3.79%) SaaS
7 9 (2.44%) dbt
8 8 (2.17%) Microsoft 365
9 7 (1.90%) Amazon CloudWatch
9 7 (1.90%) Azure AKS
9 7 (1.90%) Azure Cosmos DB
9 7 (1.90%) Azure Monitor
9 7 (1.90%) Datadog
9 7 (1.90%) Serverless
10 6 (1.63%) Cloud Computing
11 5 (1.36%) Dynamics 365
11 5 (1.36%) WhatsApp
12 4 (1.08%) Google Analytics
12 4 (1.08%) Miro
13 2 (0.54%) GCP
Communications & Networking
1 5 (1.36%) Structured Cabling
2 3 (0.81%) HTTP
3 2 (0.54%) AMQP
4 1 (0.27%) 3G
4 1 (0.27%) DSL
4 1 (0.27%) Intranet
Database & Business Intelligence
1 24 (6.50%) SQL Server
2 11 (2.98%) Relational Database
3 9 (2.44%) Power BI
4 7 (1.90%) Amazon Redshift
4 7 (1.90%) DynamoDB
5 5 (1.36%) Data Lake
5 5 (1.36%) Tableau
6 4 (1.08%) Big Data
7 3 (0.81%) Data Warehouse
7 3 (0.81%) Oracle Database
7 3 (0.81%) SQL Server Integration Services
7 3 (0.81%) SQL Server Reporting Services
8 2 (0.54%) BigQuery
8 2 (0.54%) MySQL
8 2 (0.54%) NoSQL
8 2 (0.54%) PostgreSQL
8 2 (0.54%) SAP HANA
8 2 (0.54%) Snowflake Schema
8 2 (0.54%) SQLite
8 2 (0.54%) Star Schema
Development Applications
1 57 (15.45%) JIRA
2 30 (8.13%) Git
3 17 (4.61%) Selenium
3 17 (4.61%) Team Foundation Server
4 15 (4.07%) Visual Studio Team System
5 12 (3.25%) Cucumber
6 11 (2.98%) GitLab
7 9 (2.44%) Jenkins
8 8 (2.17%) Artifactory
8 8 (2.17%) WebDriver
9 7 (1.90%) Sonatype Nexus
9 7 (1.90%) SpecFlow
10 6 (1.63%) Postman
10 6 (1.63%) Visual Studio
11 4 (1.08%) Cypress.io
11 4 (1.08%) NUnit
12 3 (0.81%) JIRA Agile
13 2 (0.54%) git-flow
13 2 (0.54%) IBM UrbanCode
13 2 (0.54%) Protractor
General
1 108 (29.27%) Social Skills
2 71 (19.24%) Finance
3 60 (16.26%) Analytical Skills
4 30 (8.13%) Retail
5 28 (7.59%) Legal
6 23 (6.23%) Public Sector
7 21 (5.69%) Inclusion and Diversity
8 20 (5.42%) Law
9 19 (5.15%) Marketing
10 18 (4.88%) Pharmaceutical
11 17 (4.61%) Digital Healthcare
12 16 (4.34%) Presentation Skills
13 7 (1.90%) Organisational Skills
14 6 (1.63%) Influencing Skills
14 6 (1.63%) Telecoms
15 5 (1.36%) Banking
15 5 (1.36%) Manufacturing
16 4 (1.08%) Back Office
16 4 (1.08%) Publishing
17 3 (0.81%) Front Office
Job Titles
1 114 (30.89%) Analyst
2 98 (26.56%) Business Analyst
3 81 (21.95%) Product Owner
4 62 (16.80%) Senior
5 55 (14.91%) Developer
6 24 (6.50%) Digital Product Owner
7 22 (5.96%) Product Manager
8 21 (5.69%) Lead
8 21 (5.69%) Transition Manager
9 20 (5.42%) Service Manager
9 20 (5.42%) Service Transition Manager
10 16 (4.34%) Senior Analyst
10 16 (4.34%) Software Analyst
11 15 (4.07%) Senior Business Analyst
11 15 (4.07%) Senior Developer
12 12 (3.25%) Junior
12 12 (3.25%) Project Analyst
12 12 (3.25%) Technical Analyst
13 11 (2.98%) Technical Business Analyst
13 11 (2.98%) Test Engineer
Libraries, Frameworks & Software Standards
1 44 (11.92%) .NET
2 23 (6.23%) AngularJS
3 22 (5.96%) .NET Framework
4 18 (4.88%) Vue
5 16 (4.34%) HTML
6 15 (4.07%) jQuery
7 14 (3.79%) Swagger
8 13 (3.52%) CSS
9 12 (3.25%) Gherkin
10 11 (2.98%) JSON
11 9 (2.44%) Blazor
12 8 (2.17%) Web Services
13 7 (1.90%) ASP.NET
13 7 (1.90%) REST
13 7 (1.90%) Velocity
13 7 (1.90%) YAML
14 6 (1.63%) RESTful
15 5 (1.36%) SOAP
16 4 (1.08%) Node.js
16 4 (1.08%) Spring
Miscellaneous
1 139 (37.67%) Product Ownership
2 20 (5.42%) Self-Motivation
3 16 (4.34%) Onboarding
4 11 (2.98%) Cloud Native
5 9 (2.44%) Virtual Team
6 8 (2.17%) Mobile App
7 7 (1.90%) Legacy Applications
8 6 (1.63%) Management Information System
9 5 (1.36%) Enterprise Software
9 5 (1.36%) Greenfield Project
10 3 (0.81%) CMDB
10 3 (0.81%) Reinsurance
10 3 (0.81%) Robotics
10 3 (0.81%) Wiki
11 2 (0.54%) Blog
11 2 (0.54%) Data Structures
11 2 (0.54%) Distributed Systems
11 2 (0.54%) Educational Technology
11 2 (0.54%) Hybrid Cloud
11 2 (0.54%) Team-Oriented Environment
Operating Systems
1 9 (2.44%) Windows
2 8 (2.17%) Linux
3 5 (1.36%) Windows 10
3 5 (1.36%) Windows Server
3 5 (1.36%) Windows Server 2012
3 5 (1.36%) Windows Server 2019
4 3 (0.81%) Android
5 2 (0.54%) Unix
6 1 (0.27%) Apple iOS
6 1 (0.27%) CentOS
6 1 (0.27%) Embedded Linux
6 1 (0.27%) Fedora
6 1 (0.27%) Red Hat Enterprise Linux
6 1 (0.27%) Ubuntu
6 1 (0.27%) VMS
Processes & Methodologies
1 245 (66.40%) Agile
2 222 (60.16%) User Stories
3 120 (32.52%) Scrum
4 107 (29.00%) Roadmaps
5 103 (27.91%) Product Backlog
6 83 (22.49%) Product Roadmap
7 75 (20.33%) DevOps
8 72 (19.51%) Backlog Prioritisation
9 70 (18.97%) Epics
10 69 (18.70%) Problem-Solving
11 57 (15.45%) Backlog Refinement
11 57 (15.45%) Product Vision
12 55 (14.91%) Test Automation
13 49 (13.28%) Backlog Management
13 49 (13.28%) Sprint Planning
14 47 (12.74%) Wireframes
15 46 (12.47%) ITIL
15 46 (12.47%) Project Management
15 46 (12.47%) Workshop Facilitation
16 44 (11.92%) User Acceptance Testing
Programming Languages
1 86 (23.31%) SQL
2 61 (16.53%) C#
3 49 (13.28%) JavaScript
4 39 (10.57%) Python
5 21 (5.69%) Java
6 16 (4.34%) Bicep
7 13 (3.52%) PowerShell
8 12 (3.25%) T-SQL
8 12 (3.25%) TypeScript
9 8 (2.17%) Bash
10 6 (1.63%) C
10 6 (1.63%) C++
11 2 (0.54%) ABAP
11 2 (0.54%) R
12 1 (0.27%) Go
12 1 (0.27%) PHP
12 1 (0.27%) Ruby
Qualifications
1 64 (17.34%) Degree
2 22 (5.96%) Computer Science Degree
3 20 (5.42%) Security Cleared
4 19 (5.15%) BPSS Clearance
5 15 (4.07%) DBS Check
6 11 (2.98%) ISTQB
7 10 (2.71%) Azure Certification
8 9 (2.44%) Master's Degree
8 9 (2.44%) Microsoft Certification
9 8 (2.17%) ISEB
10 7 (1.90%) AWS Certification
10 7 (1.90%) AWS Certified DevOps Engineer
10 7 (1.90%) AWS Certified SysOps Administrator
10 7 (1.90%) CSPO
10 7 (1.90%) ISTQB Foundation Certification
11 6 (1.63%) IIBA
12 5 (1.36%) SAFe Agilist
12 5 (1.36%) SC Cleared
13 4 (1.08%) ITIL Certification
14 3 (0.81%) PRINCE2 Certification
Quality Assurance & Compliance
1 57 (15.45%) QA
2 20 (5.42%) Accessibility
3 7 (1.90%) COBIT
3 7 (1.90%) ISO/IEC 20000
4 6 (1.63%) GDPR
5 5 (1.36%) Software Quality Assurance
6 3 (0.81%) Data Quality
6 3 (0.81%) WCAG
7 2 (0.54%) Cyber Essentials
7 2 (0.54%) Cyber Essentials PLUS
7 2 (0.54%) ISO/IEC 27001
7 2 (0.54%) PMO
7 2 (0.54%) SLA
System Software
1 18 (4.88%) Docker
2 6 (1.63%) Active Directory
3 5 (1.36%) vSphere
4 1 (0.27%) NFS
4 1 (0.27%) Samba
Systems Management
1 15 (4.07%) Kubernetes
2 10 (2.71%) Terraform
3 8 (2.17%) Ansible
3 8 (2.17%) Packer
4 7 (1.90%) Argo
5 5 (1.36%) Nessus
6 1 (0.27%) Consul
6 1 (0.27%) Grafana
6 1 (0.27%) HP ALM
6 1 (0.27%) Nagios
6 1 (0.27%) OpenNMS
6 1 (0.27%) Puppet
6 1 (0.27%) Single Sign-On
6 1 (0.27%) ZABBIX
Vendors
1 57 (15.45%) Microsoft
2 16 (4.34%) ServiceNow
3 11 (2.98%) Atlassian
4 10 (2.71%) Splunk
5 6 (1.63%) Google
6 5 (1.36%) arcserve
6 5 (1.36%) Sophos
6 5 (1.36%) UiPath
6 5 (1.36%) VMware
7 4 (1.08%) Siemens
8 3 (0.81%) Oracle
8 3 (0.81%) SAP
8 3 (0.81%) Xamarin
9 2 (0.54%) Alteryx
9 2 (0.54%) BT
9 2 (0.54%) Databricks
9 2 (0.54%) Dynatrace
9 2 (0.54%) OpenLink
9 2 (0.54%) Salesforce
9 2 (0.54%) Talend