Law
UK

The table below looks at the prevalence of the term Law in permanent job vacancies. Included is a benchmarking guide to the salaries offered in vacancies that cited Law over the 6 months leading up to 30 April 2025, comparing them to the same period in the previous two years.

6 months to
30 Apr 2025
Same period 2024 Same period 2023
Rank 50 35 105
Rank change year-on-year -15 +70 +50
Permanent jobs citing Law 2,568 5,759 3,336
As % of all permanent jobs advertised in the UK 4.92% 5.86% 3.21%
As % of the General category 7.30% 9.79% 4.68%
Number of salaries quoted 1,074 2,148 1,799
10th Percentile £29,750 £29,750 £31,250
25th Percentile £41,250 £36,250 £40,000
Median annual salary (50th Percentile) £55,000 £52,500 £52,500
Median % change year-on-year +4.76% - +5.00%
75th Percentile £73,750 £70,000 £70,000
90th Percentile £87,500 £85,000 £87,300
UK excluding London median annual salary £50,000 £47,500 £50,000
% change year-on-year +5.26% -5.00% +11.11%

All General Skills
UK

Law falls under the General Skills category. For comparison with the information above, the following table provides summary statistics for all permanent job vacancies requiring common skills.

Permanent vacancies with a requirement for common skills 35,192 58,854 71,332
As % of all permanent jobs advertised in the UK 67.47% 59.84% 68.59%
Number of salaries quoted 18,374 39,596 38,382
10th Percentile £27,750 £27,500 £32,500
25th Percentile £41,250 £36,250 £43,750
Median annual salary (50th Percentile) £56,000 £52,500 £60,000
Median % change year-on-year +6.67% -12.50% -
75th Percentile £76,250 £72,500 £82,500
90th Percentile £100,000 £92,500 £101,250
UK excluding London median annual salary £50,055 £47,500 £52,500
% change year-on-year +5.38% -9.52% +5.00%

Law
Job Vacancy Trend

Job postings citing Law as a proportion of all IT jobs advertised.
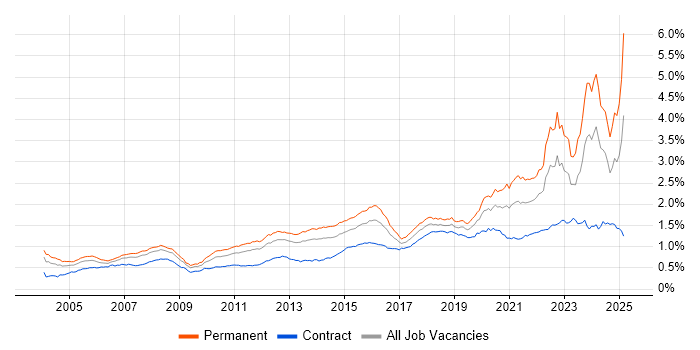
Job vacancy trend for Law in the UK

Law
Salary Trend

3-month moving average salary quoted in jobs citing Law.

Salary trend for Law in the UK

Law
Salary Histogram

Salary distribution for jobs citing Law over the 6 months to 30 April 2025.

Salary histogram for Law in the UK

Law
Top 18 Job Locations

The table below looks at the demand and provides a guide to the median salaries quoted in IT jobs citing Law within the UK over the 6 months to 30 April 2025. The 'Rank Change' column provides an indication of the change in demand within each location based on the same 6 month period last year.

Location Rank Change
on Same Period
Last Year
Matching
Permanent
IT Job Ads
Median Salary
Past 6 Months
Median Salary
% Change
on Same Period
Last Year
Live
Jobs
England +25 2,458 £55,000 +0.09% 1,910
UK excluding London -22 1,703 £50,000 +5.26% 807
Work from Home +57 838 £57,500 +4.55% 1,476
London +7 762 £65,000 - 1,213
South East +130 565 £56,250 +12.50% 226
Midlands +39 520 £45,000 +5.88% 117
North of England +4 470 £50,000 - 204
North West +3 318 £60,000 +26.32% 124
West Midlands +46 308 £45,000 -5.26% 74
East Midlands +41 212 £43,750 +9.38% 42
Yorkshire +4 123 £45,000 -18.18% 68
East of England +1 77 £55,000 +15.79% 64
Scotland -114 31 £62,500 +31.58% 65
North East +18 29 £45,000 -10.00% 14
South West -92 28 £57,500 +24.32% 80
Northern Ireland +21 8 £50,000 -12.70% 42
Channel Islands +2 3 £78,750 -7.35% 1
Isle of Man - 1 - -

Law
Co-occurring Skills and Capabilities by Category

The follow tables expand on the table above by listing co-occurrences grouped by category. The same employment type, locality and period is covered with up to 20 co-occurrences shown in each of the following categories:

Application Platforms
1 89 (3.47%) SharePoint
2 69 (2.69%) Microsoft Exchange
3 51 (1.99%) Confluence
4 27 (1.05%) Apache Spark
5 15 (0.58%) Apache
6 11 (0.43%) Apache Airflow
7 9 (0.35%) OpenEdge
8 7 (0.27%) IIS
9 6 (0.23%) CMS
10 3 (0.12%) GemFire
10 3 (0.12%) Skype for Business
10 3 (0.12%) SugarCRM
11 1 (0.039%) BizTalk Server
11 1 (0.039%) Oracle SOA Suite
11 1 (0.039%) WordPress
Applications
1 116 (4.52%) Microsoft Office
2 62 (2.41%) Microsoft Excel
3 46 (1.79%) Microsoft PowerPoint
4 36 (1.40%) Maya
5 21 (0.82%) MS Visio
6 16 (0.62%) Chatbot
7 12 (0.47%) Acrobat
8 6 (0.23%) Microsoft Project
9 5 (0.19%) Adobe XD
9 5 (0.19%) Sketch
9 5 (0.19%) Trello
10 4 (0.16%) InVision
11 1 (0.039%) Adobe Premiere
11 1 (0.039%) Camtasia
11 1 (0.039%) Photoshop
11 1 (0.039%) Spreadsheet
Business Applications
1 42 (1.64%) Dynamics CRM
2 24 (0.93%) Ripple
2 24 (0.93%) Ripple XRP
3 19 (0.74%) Elite 3E
3 19 (0.74%) SAP S/4HANA
4 18 (0.70%) SAP FI
5 16 (0.62%) OpenText VIM for SAP
5 16 (0.62%) Oracle ERP
6 15 (0.58%) Oracle Payables
6 15 (0.58%) Oracle Receivables
7 10 (0.39%) TrackWise
8 9 (0.35%) Oracle Financials
8 9 (0.35%) SAP IBP
9 7 (0.27%) Dynamics AX
10 5 (0.19%) Carpe Diem
10 5 (0.19%) Endur
10 5 (0.19%) Remedy ITSM
11 3 (0.12%) Oracle Applications
11 3 (0.12%) Relativity
11 3 (0.12%) SAP CX
Cloud Services
1 435 (16.94%) Azure
2 205 (7.98%) Microsoft 365
3 197 (7.67%) Power Platform
4 188 (7.32%) AWS
5 128 (4.98%) Dynamics 365
6 105 (4.09%) GCP
7 104 (4.05%) SaaS
8 61 (2.38%) Entra ID
9 53 (2.06%) Power Automate
10 48 (1.87%) PowerApps
11 41 (1.60%) Microsoft Copilot
12 38 (1.48%) Cloud Computing
13 34 (1.32%) PaaS
13 34 (1.32%) Serverless
14 33 (1.29%) Microsoft Purview
15 31 (1.21%) Snowflake
16 29 (1.13%) Azure Logic Apps
17 28 (1.09%) Azure Synapse Analytics
17 28 (1.09%) OneDrive
18 27 (1.05%) Azure DevOps
Communications & Networking
1 65 (2.53%) Firewall
2 47 (1.83%) DNS
3 31 (1.21%) DHCP
4 23 (0.90%) VPN
5 22 (0.86%) TCP/IP
6 20 (0.78%) Wireless
7 19 (0.74%) Cisco IOS
7 19 (0.74%) WebEx
8 15 (0.58%) Intranet
9 12 (0.47%) VLAN
9 12 (0.47%) Wi-Fi
10 11 (0.43%) WAN
11 10 (0.39%) LAN
11 10 (0.39%) Network Security
11 10 (0.39%) SAN
12 9 (0.35%) HTTP
12 9 (0.35%) SMTP
13 6 (0.23%) Internet
13 6 (0.23%) VoIP
14 4 (0.16%) DAB
Database & Business Intelligence
1 116 (4.52%) Power BI
2 98 (3.82%) Data Lake
3 84 (3.27%) Tableau
4 65 (2.53%) Data Warehouse
5 61 (2.38%) Big Data
5 61 (2.38%) SQL Server
6 51 (1.99%) Metadata
7 42 (1.64%) NoSQL
8 32 (1.25%) SQL Server Reporting Services
9 27 (1.05%) Data Mining
9 27 (1.05%) Hadoop
10 24 (0.93%) Amazon Aurora
10 24 (0.93%) DynamoDB
11 22 (0.86%) MongoDB
12 18 (0.70%) Azure SQL Database
13 16 (0.62%) Elasticsearch
13 16 (0.62%) PostgreSQL
13 16 (0.62%) SQL Server Integration Services
14 14 (0.55%) Relational Database
15 13 (0.51%) SAP BW
Development Applications
1 76 (2.96%) JIRA
2 32 (1.25%) Git
3 28 (1.09%) Jenkins
4 15 (0.58%) Visual Studio
5 13 (0.51%) Selenium
6 11 (0.43%) Bitbucket
7 10 (0.39%) webpack
8 8 (0.31%) GitLab
9 6 (0.23%) Cypress.io
9 6 (0.23%) TeamCity
10 5 (0.19%) Axure RP
10 5 (0.19%) Babel
10 5 (0.19%) NUnit
10 5 (0.19%) Vite
11 4 (0.16%) Appium
11 4 (0.16%) Storybook
11 4 (0.16%) WebDriver
12 3 (0.12%) MLflow
12 3 (0.12%) MSTest
12 3 (0.12%) SpecFlow
General
1 672 (26.17%) Legal
2 591 (23.01%) Social Skills
3 498 (19.39%) Finance
4 418 (16.28%) Inclusion and Diversity
5 405 (15.77%) Analytical Skills
6 167 (6.50%) Marketing
7 109 (4.24%) Manufacturing
8 96 (3.74%) Retail
9 84 (3.27%) Games
10 78 (3.04%) Telecoms
11 67 (2.61%) Banking
12 59 (2.30%) Pharmaceutical
13 54 (2.10%) Presentation Skills
13 54 (2.10%) Public Sector
14 53 (2.06%) Financial Institution
15 39 (1.52%) Influencing Skills
16 37 (1.44%) Organisational Skills
17 24 (0.93%) Digital Economy
17 24 (0.93%) Electronics
18 22 (0.86%) Billing
Job Titles
1 460 (17.91%) Lead
2 390 (15.19%) Senior
3 327 (12.73%) Analyst
4 219 (8.53%) Principal Engineer
5 190 (7.40%) Principal Systems Engineer
6 160 (6.23%) Developer
7 137 (5.33%) Support Analyst
8 134 (5.22%) IT Analyst
9 133 (5.18%) IT Support
10 131 (5.10%) Architect
11 107 (4.17%) Consultant
12 97 (3.78%) IT Support Analyst
13 81 (3.15%) Senior Manager
14 57 (2.22%) Senior Analyst
15 56 (2.18%) Software Engineer
16 54 (2.10%) IT Manager
17 52 (2.02%) Dynamics 365 Developer
17 52 (2.02%) Project Engineer
18 51 (1.99%) Cloud Engineer
18 51 (1.99%) Solutions Architect
Libraries, Frameworks & Software Standards
1 81 (3.15%) React
2 80 (3.12%) .NET
3 74 (2.88%) Node.js
4 48 (1.87%) REST
5 42 (1.64%) Middleware
6 40 (1.56%) Spring
7 39 (1.52%) RESTful
8 33 (1.29%) AngularJS
9 32 (1.25%) Spring Boot
10 31 (1.21%) HTML
11 30 (1.17%) CSS
12 29 (1.13%) Kafka
13 28 (1.09%) SOAP
14 25 (0.97%) Oracle Fusion
15 23 (0.90%) ASP.NET Web API
16 22 (0.86%) Lightning Web Components
17 19 (0.74%) Redux
18 17 (0.66%) JWT
18 17 (0.66%) OAuth
18 17 (0.66%) WPF
Miscellaneous
1 289 (11.25%) Cyberattack
2 117 (4.56%) Enterprise Software
3 108 (4.21%) Product Ownership
4 100 (3.89%) Algorithms
5 75 (2.92%) Management Information System
6 57 (2.22%) FMCG
7 52 (2.02%) Onboarding
8 45 (1.75%) Legacy Systems
9 39 (1.52%) Self-Motivation
10 36 (1.40%) Video Conferencing
11 34 (1.32%) Blockchain
11 34 (1.32%) Distributed Systems
11 34 (1.32%) Security Posture
12 32 (1.25%) Cloud Native
13 30 (1.17%) IoT
13 30 (1.17%) Virtual Team
14 26 (1.01%) Public Cloud
15 25 (0.97%) Analytical Mindset
16 24 (0.93%) Cloud Security Posture
16 24 (0.93%) Data Protection Act
Operating Systems
1 205 (7.98%) Windows
2 81 (3.15%) Windows 10
3 67 (2.61%) Linux
4 53 (2.06%) Windows Server
5 19 (0.74%) Mac OS X
6 14 (0.55%) Apple iOS
6 14 (0.55%) Unix
6 14 (0.55%) Windows Server 2019
7 13 (0.51%) Android
8 12 (0.47%) Windows Server 2016
9 10 (0.39%) Mac OS
10 9 (0.35%) Windows Server 2012
11 5 (0.19%) Rocky
12 2 (0.078%) Red Hat Enterprise Linux
12 2 (0.078%) Windows Server 2003
13 1 (0.039%) Windows 8
Processes & Methodologies
1 449 (17.48%) Analytics
2 438 (17.06%) Agile
3 435 (16.94%) Problem-Solving
4 405 (15.77%) Cybersecurity
5 352 (13.71%) Line Management
6 326 (12.69%) Project Management
7 317 (12.34%) Roadmaps
8 304 (11.84%) Artificial Intelligence
9 288 (11.21%) Creative Thinking
10 276 (10.75%) Computer Science
11 262 (10.20%) Mathematics
12 256 (9.97%) Continuous Improvement
13 251 (9.77%) Mentoring
14 246 (9.58%) Logistics
15 237 (9.23%) Stakeholder Management
16 229 (8.92%) Business Strategy
16 229 (8.92%) DevOps
17 228 (8.88%) Collaborative Working
18 216 (8.41%) Data Management
19 206 (8.02%) Physics
Programming Languages
1 260 (10.12%) SQL
2 225 (8.76%) Python
3 115 (4.48%) C#
4 106 (4.13%) Java
5 76 (2.96%) JavaScript
6 53 (2.06%) PowerShell
7 45 (1.75%) TypeScript
8 35 (1.36%) C++
9 25 (0.97%) Go
10 24 (0.93%) Apex Code
11 23 (0.90%) T-SQL
12 22 (0.86%) X++
13 20 (0.78%) Scala
14 13 (0.51%) PHP
15 12 (0.47%) C
16 8 (0.31%) Rust
17 7 (0.27%) MATLAB
17 7 (0.27%) PL/SQL
18 6 (0.23%) Clojure
18 6 (0.23%) Elixir
Qualifications
1 844 (32.87%) Degree
2 157 (6.11%) BPSS Clearance
3 153 (5.96%) Master's Degree
4 142 (5.53%) Security Cleared
5 122 (4.75%) Computer Science Degree
6 46 (1.79%) PMI Certification
7 45 (1.75%) Microsoft Certification
8 40 (1.56%) SC Cleared
9 31 (1.21%) Azure Certification
10 25 (0.97%) AWS Certification
11 24 (0.93%) Cisco Certification
12 23 (0.90%) PMP
13 19 (0.74%) PhD
14 18 (0.70%) AWS Certified Cloud Practitioner
15 17 (0.66%) CISSP
16 16 (0.62%) A+ Certification
17 13 (0.51%) DV Cleared
18 12 (0.47%) CCNP
19 10 (0.39%) MBA
19 10 (0.39%) MCSA
Quality Assurance & Compliance
1 286 (11.14%) NCSC
2 124 (4.83%) Accessibility
3 119 (4.63%) Data Quality
4 72 (2.80%) GDPR
5 71 (2.76%) QA
6 51 (1.99%) SLA
7 42 (1.64%) ISO/IEC 27001
8 40 (1.56%) Cyber Essentials
9 16 (0.62%) ISO 9001
10 15 (0.58%) GMP
11 14 (0.55%) NIST
12 13 (0.51%) California Consumer Privacy Act
13 11 (0.43%) GRC
14 10 (0.39%) PCI DSS
14 10 (0.39%) PERC
15 8 (0.31%) Good Clinical Practice
16 7 (0.27%) Cyber Essentials PLUS
17 6 (0.23%) PMO
17 6 (0.23%) SOC 2
17 6 (0.23%) WCAG
System Software
1 142 (5.53%) Active Directory
2 47 (1.83%) Docker
3 20 (0.78%) VMware Infrastructure
4 16 (0.62%) HDFS
5 13 (0.51%) Hyper-V
6 11 (0.43%) Virtual Machines
7 9 (0.35%) DFS Replication
7 9 (0.35%) Virtual Desktop
8 3 (0.12%) vSphere
9 1 (0.039%) BitLocker
9 1 (0.039%) Firmware
9 1 (0.039%) Microsoft App-V
Systems Management
1 118 (4.60%) Kubernetes
2 53 (2.06%) Microsoft Intune
3 46 (1.79%) Terraform
4 44 (1.71%) SCCM
5 28 (1.09%) Ansible
6 10 (0.39%) Prometheus
6 10 (0.39%) QRadar
7 8 (0.31%) Puppet
8 7 (0.27%) SCOM
8 7 (0.27%) Single Sign-On
9 6 (0.23%) CASB
10 5 (0.19%) Microsoft Clustering
10 5 (0.19%) Progress Chef
11 4 (0.16%) Grafana
12 3 (0.12%) EnCase
12 3 (0.12%) FTK
13 2 (0.078%) FortiGate
13 2 (0.078%) RSA Security Analytics
13 2 (0.078%) SCOrch
13 2 (0.078%) SCSM
Vendors
1 537 (20.91%) Microsoft
2 159 (6.19%) SAP
3 123 (4.79%) ServiceNow
4 103 (4.01%) Google
5 91 (3.54%) Salesforce
6 77 (3.00%) Oracle
7 62 (2.41%) iManage
8 57 (2.22%) Adobe
9 52 (2.02%) Cisco
10 47 (1.83%) Workday
11 43 (1.67%) VMware
12 36 (1.40%) OpenAI
13 34 (1.32%) Salesforce Marketing Cloud
14 33 (1.29%) Databricks
15 31 (1.21%) Aderant
16 30 (1.17%) IBM
17 29 (1.13%) Intapp
18 28 (1.09%) Informatica
19 26 (1.01%) Citrix
19 26 (1.01%) MuleSoft