React.js
UK

The table below provides summary statistics for permanent job vacancies requiring React skills. It includes a benchmarking guide to the annual salaries offered in vacancies that cited React over the 6 months leading up to 30 April 2025, comparing them to the same period in the previous two years.

6 months to
30 Apr 2025
Same period 2024 Same period 2023
Rank 72 41 41
Rank change year-on-year -31 0 -24
Permanent jobs citing React 1,874 5,043 6,854
As % of all permanent jobs advertised in the UK 3.59% 5.13% 6.59%
As % of the Libraries, Frameworks & Software Standards category 22.07% 23.96% 21.79%
Number of salaries quoted 1,565 3,447 4,383
10th Percentile £43,750 £40,000 £43,750
25th Percentile £53,750 £47,500 £53,750
Median annual salary (50th Percentile) £70,000 £65,000 £70,000
Median % change year-on-year +7.69% -7.14% +3.70%
75th Percentile £95,000 £85,000 £90,000
90th Percentile £111,250 £110,000 £111,000
UK excluding London median annual salary £60,000 £60,000 £61,500
% change year-on-year - -2.44% +11.82%

All Software Libraries and Frameworks
UK

React falls under the Software Libraries and Frameworks category. For comparison with the information above, the following table provides summary statistics for all permanent job vacancies requiring technical specification, industry standards, software libraries and framework skills.

Permanent vacancies with a requirement for technical specification, industry standards, software libraries and framework skills 8,493 21,046 31,450
As % of all permanent jobs advertised in the UK 16.28% 21.40% 30.24%
Number of salaries quoted 6,474 15,738 19,371
10th Percentile £38,750 £36,250 £41,117
25th Percentile £50,509 £45,000 £50,000
Median annual salary (50th Percentile) £65,000 £60,000 £67,500
Median % change year-on-year +8.33% -11.11% +8.00%
75th Percentile £87,500 £79,900 £87,500
90th Percentile £111,250 £100,000 £106,250
UK excluding London median annual salary £60,000 £55,000 £57,500
% change year-on-year +9.09% -4.35% +4.55%

React
Job Vacancy Trend

Job postings citing React as a proportion of all IT jobs advertised.
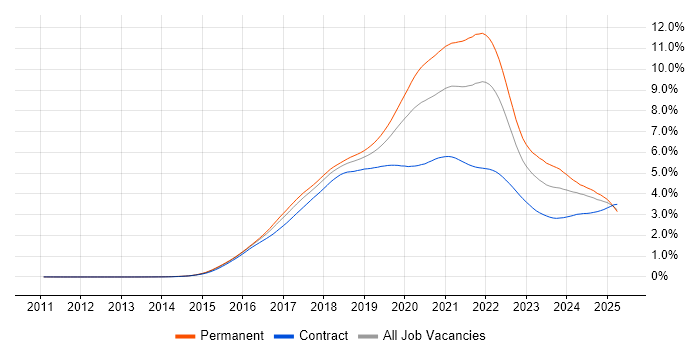
Job vacancy trend for React in the UK

React
Salary Trend

3-month moving average salary quoted in jobs citing React.

Salary trend for React in the UK

React
Salary Histogram

Salary distribution for jobs citing React over the 6 months to 30 April 2025.

Salary histogram for React in the UK

React
Top 17 Job Locations

The table below looks at the demand and provides a guide to the median salaries quoted in IT jobs citing React within the UK over the 6 months to 30 April 2025. The 'Rank Change' column provides an indication of the change in demand within each location based on the same 6 month period last year.

Location Rank Change
on Same Period
Last Year
Matching
Permanent
IT Job Ads
Median Salary
Past 6 Months
Median Salary
% Change
on Same Period
Last Year
Live
Jobs
England -20 1,701 £70,000 +7.69% 1,374
UK excluding London -62 980 £60,000 - 782
Work from Home -3 874 £67,500 +9.76% 986
London +7 825 £87,500 +2.94% 656
North of England -62 295 £65,000 +8.33% 288
South East -42 271 £60,000 -2.44% 152
North West -82 177 £65,000 +8.33% 209
South West -31 127 £62,500 +13.64% 96
Midlands -83 123 £60,000 +4.35% 116
Scotland -31 103 £65,000 +8.33% 44
Yorkshire -16 92 £67,500 +12.50% 59
West Midlands -57 73 £60,000 - 73
East Midlands -59 50 £60,000 +14.29% 43
East of England -42 46 £62,500 +4.17% 75
North East +51 26 £48,000 +1.05% 22
Wales -24 14 £70,000 +55.56% 15
Northern Ireland -11 2 £50,000 -9.09% 15

React
Co-occurring Skills and Capabilities by Category

The follow tables expand on the table above by listing co-occurrences grouped by category. The same employment type, locality and period is covered with up to 20 co-occurrences shown in each of the following categories:

Application Platforms
1 81 (4.32%) CMS
2 71 (3.79%) Apache Airflow
3 35 (1.87%) Apache
4 34 (1.81%) Confluence
5 27 (1.44%) SharePoint
6 25 (1.33%) Headless CMS
6 25 (1.33%) WordPress
7 22 (1.17%) nginx
8 19 (1.01%) Umbraco
9 17 (0.91%) Drupal
10 12 (0.64%) Apache Spark
11 9 (0.48%) Camunda
12 6 (0.32%) OpenStack
13 5 (0.27%) IIS
13 5 (0.27%) Liferay
13 5 (0.27%) Microsoft Exchange
13 5 (0.27%) Strapi
14 4 (0.21%) Cloud Foundry
14 4 (0.21%) Sitefinity
15 3 (0.16%) Oracle SOA Suite
Applications
1 10 (0.53%) Chatbot
1 10 (0.53%) Microsoft Office
2 9 (0.48%) Adobe XD
2 9 (0.48%) Sketch
3 6 (0.32%) Trello
4 3 (0.16%) Adobe Creative Suite
5 2 (0.11%) Microsoft Excel
5 2 (0.11%) Moqups
6 1 (0.053%) Adobe Illustrator
6 1 (0.053%) Photoshop
6 1 (0.053%) S-PLUS
6 1 (0.053%) Zeplin
Business Applications
1 12 (0.64%) Oracle EBS
2 9 (0.48%) Shopify
3 7 (0.37%) Dynamics CRM
4 2 (0.11%) NetSuite
5 1 (0.053%) JDE EnterpriseOne
Cloud Services
1 871 (46.48%) AWS
2 550 (29.35%) Azure
3 261 (13.93%) GCP
4 191 (10.19%) Serverless
5 171 (9.12%) SaaS
6 115 (6.14%) GitHub
7 109 (5.82%) Azure DevOps
8 103 (5.50%) AWS Lambda
9 65 (3.47%) dbt
10 64 (3.42%) Amazon S3
11 61 (3.26%) Amazon EC2
12 54 (2.88%) Cloud Computing
12 54 (2.88%) GitHub Actions
13 50 (2.67%) Power Platform
14 43 (2.29%) Figma
15 36 (1.92%) npm
16 29 (1.55%) Azure Service Bus
17 28 (1.49%) Amazon ECS
18 25 (1.33%) Microsoft 365
19 24 (1.28%) PowerApps
Communications & Networking
1 20 (1.07%) HTTP
2 7 (0.37%) SMS
3 6 (0.32%) Internet
3 6 (0.32%) MQTT
4 5 (0.27%) DNS
4 5 (0.27%) VPN
5 4 (0.21%) DAB
5 4 (0.21%) LoRaWAN
5 4 (0.21%) TCP/IP
6 3 (0.16%) Broadband
6 3 (0.16%) FTP
7 2 (0.11%) Kerberos
7 2 (0.11%) Value-Added Service
7 2 (0.11%) Wireless
8 1 (0.053%) Intranet
8 1 (0.053%) Intrusion Detection
8 1 (0.053%) Multicast
8 1 (0.053%) RTP
8 1 (0.053%) RTSP
8 1 (0.053%) WPA
Database & Business Intelligence
1 263 (14.03%) PostgreSQL
2 216 (11.53%) SQL Server
3 171 (9.12%) MongoDB
4 164 (8.75%) NoSQL
5 160 (8.54%) MySQL
6 100 (5.34%) DynamoDB
7 59 (3.15%) Relational Database
8 57 (3.04%) Amazon Athena
8 57 (3.04%) Apache Arrow
8 57 (3.04%) Apache Iceberg
8 57 (3.04%) Dremio
9 42 (2.24%) Elasticsearch
10 32 (1.71%) Amazon Aurora
11 29 (1.55%) SQL Server Reporting Services
12 27 (1.44%) Apache Ignite
13 26 (1.39%) Redis
14 25 (1.33%) BigQuery
15 22 (1.17%) Amazon RDS
16 21 (1.12%) Azure SQL Database
17 18 (0.96%) Power BI
Development Applications
1 327 (17.45%) Git
2 85 (4.54%) JIRA
3 69 (3.68%) Jenkins
4 65 (3.47%) webpack
5 52 (2.77%) GitLab
6 49 (2.61%) JUnit
7 44 (2.35%) Cypress.io
8 39 (2.08%) IntelliJ
8 39 (2.08%) Visual Studio
9 37 (1.97%) Jasmine
10 28 (1.49%) Mockito
11 27 (1.44%) Babel
11 27 (1.44%) TeamCity
12 25 (1.33%) Eclipse
12 25 (1.33%) Karma Test Runner
13 24 (1.28%) Selenium
14 23 (1.23%) Protractor
15 21 (1.12%) Mocha
16 17 (0.91%) Maven
17 14 (0.75%) Storybook
General
1 445 (23.75%) Finance
2 274 (14.62%) Social Skills
3 158 (8.43%) Banking
4 132 (7.04%) Front Office
5 128 (6.83%) Analytical Skills
6 106 (5.66%) Inclusion and Diversity
7 81 (4.32%) Law
8 50 (2.67%) Public Sector
9 46 (2.45%) Games
10 45 (2.40%) Marketing
11 43 (2.29%) Retail
12 41 (2.19%) Tech for Good
13 33 (1.76%) Advertising
13 33 (1.76%) Financial Institution
14 27 (1.44%) Investment Banking
15 24 (1.28%) Manufacturing
16 14 (0.75%) Health Technology
16 14 (0.75%) Publishing
16 14 (0.75%) Retail Banking
17 12 (0.64%) Legal
Job Titles
1 1,006 (53.68%) Developer
2 512 (27.32%) Senior
3 488 (26.04%) Software Engineer
4 275 (14.67%) Senior Developer
5 265 (14.14%) Lead
6 224 (11.95%) Full-Stack Developer
7 187 (9.98%) React Developer
8 179 (9.55%) Front-End Developer (Client-Side Developer)
9 163 (8.70%) Full-Stack Engineer
10 130 (6.94%) Senior Software Engineer
11 108 (5.76%) Developer/Software Engineer
12 99 (5.28%) Software Developer
13 91 (4.86%) Python Developer
14 88 (4.70%) .NET Developer
14 88 (4.70%) AWS Engineer
15 86 (4.59%) Java Developer
16 81 (4.32%) Front-End Engineer (Client-Side Engineer)
17 77 (4.11%) Lead Developer
18 66 (3.52%) AWS Developer
19 65 (3.47%) AWS Software Engineer
Libraries, Frameworks & Software Standards
1 583 (31.11%) Node.js
2 490 (26.15%) AngularJS
3 447 (23.85%) CSS
4 407 (21.72%) HTML
5 406 (21.66%) .NET
6 284 (15.15%) Vue
7 233 (12.43%) RESTful
8 213 (11.37%) GraphQL
9 196 (10.46%) Redux
10 190 (10.14%) .NET Core
11 184 (9.82%) REST
12 170 (9.07%) Next.js
13 124 (6.62%) HTML5
14 118 (6.30%) Jest
14 118 (6.30%) Spring
15 113 (6.03%) .NET Framework
16 112 (5.98%) React Native
17 110 (5.87%) Spring Boot
18 93 (4.96%) ASP.NET
19 88 (4.70%) Django
Miscellaneous
1 116 (6.19%) Mobile App
2 110 (5.87%) Fixed Income
3 108 (5.76%) Product Ownership
4 103 (5.50%) Cloud Native
5 63 (3.36%) Algorithms
6 55 (2.93%) Greenfield Project
7 53 (2.83%) Foreign Exchange (FX)
8 37 (1.97%) Equities
9 36 (1.92%) Distributed Systems
10 28 (1.49%) Hedge funds
10 28 (1.49%) NHS
11 26 (1.39%) Virtual Team
12 23 (1.23%) Data Structures
13 22 (1.17%) Public Cloud
14 19 (1.01%) IoT
15 17 (0.91%) Legacy Systems
15 17 (0.91%) Private Cloud
16 14 (0.75%) Distributed Architecture
16 14 (0.75%) Educational Technology
17 13 (0.69%) Renewable Energy
Operating Systems
1 76 (4.06%) Linux
2 38 (2.03%) Android
3 36 (1.92%) Apple iOS
4 18 (0.96%) Windows
5 11 (0.59%) Rocky
6 9 (0.48%) Windows Server
7 5 (0.27%) Unix
8 1 (0.053%) CentOS
8 1 (0.053%) Debian
8 1 (0.053%) Red Hat Enterprise Linux
8 1 (0.053%) Ubuntu
8 1 (0.053%) Windows 10
8 1 (0.053%) Windows Server 2012
Processes & Methodologies
1 848 (45.25%) Agile
2 800 (42.69%) Software Engineering
3 633 (33.78%) Full-Stack Development
4 427 (22.79%) CI/CD
5 369 (19.69%) Microservices
6 368 (19.64%) DevOps
7 330 (17.61%) Problem-Solving
8 319 (17.02%) Front End Development
9 288 (15.37%) Mentoring
10 275 (14.67%) User Experience
11 211 (11.26%) TDD
12 190 (10.14%) Fintech
13 188 (10.03%) Artificial Intelligence
14 182 (9.71%) Containerisation
15 177 (9.45%) Scrum
16 174 (9.28%) Roadmaps
17 159 (8.48%) Computer Science
17 159 (8.48%) Test Automation
18 156 (8.32%) Web Development
19 151 (8.06%) Unit Testing
Programming Languages
1 1,071 (57.15%) JavaScript
2 958 (51.12%) TypeScript
3 483 (25.77%) Python
4 404 (21.56%) Java
5 388 (20.70%) C#
6 367 (19.58%) SQL
7 132 (7.04%) PHP
8 53 (2.83%) Ruby
9 47 (2.51%) Rust
10 36 (1.92%) Go
11 32 (1.71%) PowerShell
12 23 (1.23%) C++
13 16 (0.85%) Kotlin
14 14 (0.75%) C
15 12 (0.64%) T-SQL
16 10 (0.53%) Bicep
16 10 (0.53%) PL/SQL
17 9 (0.48%) Scala
18 8 (0.43%) Bash
18 8 (0.43%) Lua
Qualifications
1 211 (11.26%) Degree
2 113 (6.03%) Security Cleared
3 86 (4.59%) Computer Science Degree
4 69 (3.68%) SC Cleared
5 37 (1.97%) Master's Degree
6 23 (1.23%) DV Cleared
7 21 (1.12%) PhD
8 8 (0.43%) AWS Certification
9 6 (0.32%) AWS Certified Solutions Architect
10 5 (0.27%) ISTQB
11 3 (0.16%) Numerate Degree
12 2 (0.11%) Azure Certification
13 1 (0.053%) BC Cleared
13 1 (0.053%) DBS Check
13 1 (0.053%) ISTQB Foundation Certification
Quality Assurance & Compliance
1 112 (5.98%) QA
2 81 (4.32%) Accessibility
3 9 (0.48%) WCAG
4 5 (0.27%) Software Quality Assurance
5 2 (0.11%) GDPR
5 2 (0.11%) ISO/IEC 27001
5 2 (0.11%) SLA
6 1 (0.053%) COBIT
6 1 (0.053%) ISO 9001
6 1 (0.053%) MiFID
6 1 (0.053%) SOC 2
System Software
1 411 (21.93%) Docker
2 9 (0.48%) Active Directory
3 1 (0.053%) Apache ZooKeeper
3 1 (0.053%) NDS
Systems Management
1 383 (20.44%) Kubernetes
2 67 (3.58%) Terraform
3 16 (0.85%) Prometheus
4 11 (0.59%) Single Sign-On
5 9 (0.48%) Grafana
6 8 (0.43%) Argo
6 8 (0.43%) Kibana
7 7 (0.37%) Ansible
8 6 (0.32%) Kustomize
9 3 (0.16%) Istio
9 3 (0.16%) Microsoft Intune
10 2 (0.11%) Control-M
11 1 (0.053%) CA Single Sign-On
11 1 (0.053%) cPanel
11 1 (0.053%) logstash
11 1 (0.053%) PingFederate
11 1 (0.053%) Progress Chef
11 1 (0.053%) Puppet
11 1 (0.053%) SCCM
Vendors
1 201 (10.73%) Microsoft
2 65 (3.47%) Google
3 59 (3.15%) Oracle
4 37 (1.97%) IBM
5 21 (1.12%) Red Hat
6 17 (0.91%) Adobe
7 14 (0.75%) Atlassian
8 10 (0.53%) Databricks
9 9 (0.48%) Apple
9 9 (0.48%) Okta
10 8 (0.43%) Cisco
10 8 (0.43%) Ping Identity
11 7 (0.37%) ANSYS
12 6 (0.32%) New Relic
12 6 (0.32%) Sawtooth Software
13 5 (0.27%) Dynatrace
14 4 (0.21%) Splunk
14 4 (0.21%) Tealium
15 3 (0.16%) Salesforce
15 3 (0.16%) Twitter