Process Improvement
UK

The following table provides summary statistics for permanent job vacancies with a requirement for Process Improvement skills. Included is a benchmarking guide to the salaries offered in vacancies that have cited Process Improvement over the 6 months to 28 November 2023 with a comparison to the same period in the previous 2 years.

6 months to
28 Nov 2023
Same period 2022 Same period 2021
Rank 183 143 231
Rank change year-on-year -40 +88 +47
Permanent jobs citing Process Improvement 1,047 3,191 2,078
As % of all permanent jobs advertised in the UK 1.93% 2.54% 1.62%
As % of the Processes & Methodologies category 2.05% 2.66% 1.70%
Number of salaries quoted 714 1,258 1,290
10th Percentile £36,250 £36,089 £32,500
25th Percentile £46,250 £43,500 £42,500
Median annual salary (50th Percentile) £62,500 £56,000 £55,000
Median % change year-on-year +11.61% +1.82% -
75th Percentile £77,500 £73,750 £70,000
90th Percentile £91,729 £92,500 £81,250
UK excluding London median annual salary £52,500 £50,950 £49,000
% change year-on-year +3.04% +3.98% +3.16%

All Process and Methodology Skills
UK

Process Improvement is in the Processes and Methodologies category. The following table is for comparison with the above and provides summary statistics for all permanent job vacancies with a requirement for process or methodology skills.

Permanent vacancies with a requirement for process or methodology skills 51,121 120,104 122,523
As % of all permanent jobs advertised in the UK 94.09% 95.72% 95.43%
Number of salaries quoted 36,956 73,203 81,032
10th Percentile £32,500 £34,313 £32,500
25th Percentile £43,750 £45,000 £42,500
Median annual salary (50th Percentile) £60,000 £60,000 £59,000
Median % change year-on-year - +1.69% +7.27%
75th Percentile £80,000 £81,250 £77,500
90th Percentile £98,750 £100,000 £95,000
UK excluding London median annual salary £52,500 £53,000 £50,000
% change year-on-year -0.94% +6.00% +4.17%

Process Improvement
Job Vacancy Trend

Job postings citing Process Improvement as a proportion of all IT jobs advertised.
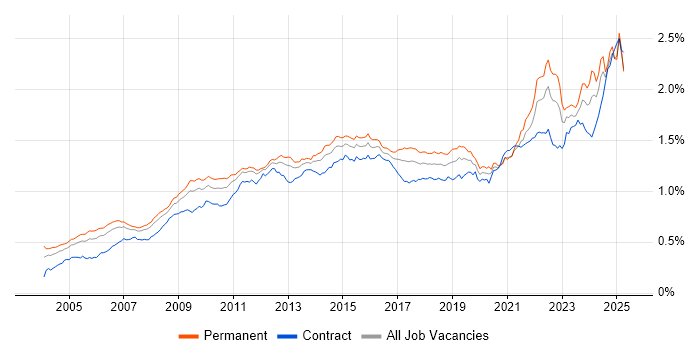
Job vacancy trend for Process Improvement in the UK

Process Improvement
Salary Trend

3-month moving average salary quoted in jobs citing Process Improvement.

Salary trend for Process Improvement in the UK

Process Improvement
Salary Histogram

Salary distribution for jobs citing Process Improvement over the 6 months to 28 November 2023.

Salary histogram for Process Improvement in the UK

Process Improvement
Top 17 Job Locations

The table below looks at the demand and provides a guide to the median salaries quoted in IT jobs citing Process Improvement within the UK over the 6 months to 28 November 2023. The 'Rank Change' column provides an indication of the change in demand within each location based on the same 6 month period last year.

Location Rank Change
on Same Period
Last Year
Matching
Permanent
IT Job Ads
Median Salary
Past 6 Months
Median Salary
% Change
on Same Period
Last Year
Live
Jobs
England -30 965 £62,694 +9.03% 760
UK excluding London -68 656 £52,500 +3.04% 516
Work from Home -82 363 £62,500 +8.70% 300
London +3 327 £75,000 +15.38% 308
Midlands -23 181 £52,500 +3.04% 105
South East -10 163 £53,900 -2.00% 123
North of England -50 157 £60,000 +26.32% 130
West Midlands -25 119 £50,000 -1.86% 67
North West -41 93 £65,000 +36.84% 74
East of England +21 71 £50,000 -9.09% 51
East Midlands +26 59 £57,500 +1.77% 38
Yorkshire -18 59 £47,500 +2.15% 36
South West +7 42 £50,000 -4.76% 49
Scotland -4 25 £60,000 +33.33% 51
Wales -17 16 £43,190 -1.28% 17
North East +29 6 £35,750 -11.73% 21
Isle of Man - 2 £60,000 -

Process Improvement
Co-occurring Skills and Capabilities by Category

The follow tables expand on the table above by listing co-occurrences grouped by category. The same employment type, locality and period is covered with up to 20 co-occurrences shown in each of the following categories:

Application Platforms
1 16 (1.53%) SharePoint
2 13 (1.24%) MS Exchange
3 10 (0.96%) IIS
4 9 (0.86%) Apache
4 9 (0.86%) Apache Spark
4 9 (0.86%) Confluence
5 2 (0.19%) Appian
6 1 (0.096%) Apache Airflow
6 1 (0.096%) BizTalk Server
6 1 (0.096%) CMS
6 1 (0.096%) Site Server
6 1 (0.096%) Tomcat
6 1 (0.096%) TPMS
Applications
1 111 (10.60%) Microsoft Excel
2 78 (7.45%) Microsoft Office
3 58 (5.54%) Microsoft PowerPoint
4 15 (1.43%) Microsoft Project
5 8 (0.76%) AutoCAD
5 8 (0.76%) MS Visio
6 5 (0.48%) Autodesk Inventor
6 5 (0.48%) SOLIDWORKS
7 2 (0.19%) Simulink
8 1 (0.096%) Revit
8 1 (0.096%) SketchUp
8 1 (0.096%) Spreadsheet
Business Applications
1 49 (4.68%) NetSuite
2 10 (0.96%) Oracle General Ledger
2 10 (0.96%) SAP S/4HANA
3 7 (0.67%) Oracle Payables
4 6 (0.57%) Oracle ERP
5 5 (0.48%) Dynamics CRM
5 5 (0.48%) Oracle Receivables
5 5 (0.48%) SAP MM
6 4 (0.38%) Oracle Cash Management
6 4 (0.38%) SAP ERP
6 4 (0.38%) SAP Payroll
7 3 (0.29%) Oracle EBS
7 3 (0.29%) SAP SD
8 2 (0.19%) Oracle 11i
8 2 (0.19%) Oracle ASCP
8 2 (0.19%) Oracle Financials
8 2 (0.19%) SAP HR
8 2 (0.19%) SAP LE
8 2 (0.19%) SAP MDM
8 2 (0.19%) SAP PP
Cloud Services
1 101 (9.65%) Azure
2 69 (6.59%) Power Platform
3 57 (5.44%) AWS
4 48 (4.58%) SaaS
5 46 (4.39%) GCP
6 37 (3.53%) Microsoft 365
7 21 (2.01%) Dynamics 365
7 21 (2.01%) PowerApps
8 19 (1.81%) Azure DevOps
9 18 (1.72%) Serverless
10 14 (1.34%) Entra ID
11 13 (1.24%) Azure Data Factory
12 10 (0.96%) Azure Monitor
12 10 (0.96%) PaaS
13 9 (0.86%) Amazon EMR
13 9 (0.86%) Amazon S3
13 9 (0.86%) Azure Cosmos DB
13 9 (0.86%) Azure Synapse Analytics
13 9 (0.86%) IaaS
13 9 (0.86%) WhatsApp
Communications & Networking
1 33 (3.15%) WAN
2 31 (2.96%) VPN
3 30 (2.87%) Wireless
4 27 (2.58%) Internet
5 26 (2.48%) LAN
6 20 (1.91%) Firewall
7 15 (1.43%) Network Security
8 11 (1.05%) DNS
9 10 (0.96%) TCP/IP
10 9 (0.86%) SD-WAN
11 5 (0.48%) DHCP
11 5 (0.48%) FTP
11 5 (0.48%) HTTP
11 5 (0.48%) SMTP
11 5 (0.48%) SSH
11 5 (0.48%) Wi-Fi
12 4 (0.38%) NAS
12 4 (0.38%) SAN
12 4 (0.38%) Software-Defined Radio
12 4 (0.38%) Unified Communications
Database & Business Intelligence
1 64 (6.11%) SQL Server
2 56 (5.35%) Power BI
3 31 (2.96%) Relational Database
4 24 (2.29%) Data Warehouse
5 17 (1.62%) Tableau
6 15 (1.43%) NoSQL
6 15 (1.43%) SQL Server Integration Services
7 13 (1.24%) SQL Server Reporting Services
8 11 (1.05%) Data Lake
9 9 (0.86%) Amazon Redshift
9 9 (0.86%) Big Data
9 9 (0.86%) MongoDB
9 9 (0.86%) Redis
10 8 (0.76%) Delta Lake
10 8 (0.76%) Hadoop
10 8 (0.76%) Oracle Reports
11 7 (0.67%) Apache Hive
11 7 (0.67%) Oracle Database
12 6 (0.57%) Azure SQL Database
12 6 (0.57%) BusinessObjects
Development Applications
1 25 (2.39%) JIRA
2 18 (1.72%) Git
3 15 (1.43%) Jenkins
4 12 (1.15%) webpack
5 10 (0.96%) Selenium
6 7 (0.67%) HP UFT
7 6 (0.57%) Atlassian Bamboo
7 6 (0.57%) Cypress.io
7 6 (0.57%) WebDriver
8 5 (0.48%) Visual Studio
9 4 (0.38%) Rational DOORS
10 3 (0.29%) GitLab
10 3 (0.29%) JMeter
10 3 (0.29%) JUnit
10 3 (0.29%) Oracle Forms
10 3 (0.29%) SoapUI
10 3 (0.29%) Visual Studio Team System
11 2 (0.19%) Subversion
11 2 (0.19%) Vagrant
12 1 (0.096%) Octopus Deploy
General
1 502 (47.95%) Social Skills
2 362 (34.57%) Finance
3 216 (20.63%) Analytical Skills
4 88 (8.40%) Inclusion and Diversity
5 67 (6.40%) Manufacturing
6 66 (6.30%) Legal
7 62 (5.92%) Retail
8 55 (5.25%) Law
9 47 (4.49%) Public Sector
10 41 (3.92%) Organisational Skills
11 36 (3.44%) Marketing
12 35 (3.34%) Electronics
13 34 (3.25%) Banking
14 33 (3.15%) Automotive
15 30 (2.87%) Presentation Skills
16 29 (2.77%) Telecoms
17 28 (2.67%) Influencing Skills
18 20 (1.91%) Advertising
19 19 (1.81%) Financial Institution
19 19 (1.81%) Pharmaceutical
Job Titles
1 257 (24.55%) Analyst
2 187 (17.86%) Senior
3 128 (12.23%) Lead
4 106 (10.12%) Business Analyst
5 96 (9.17%) Consultant
6 62 (5.92%) Functional Consultant
7 60 (5.73%) Project Manager
7 60 (5.73%) Software Engineer
8 55 (5.25%) Senior Consultant
9 50 (4.78%) Senior Functional Consultant
10 49 (4.68%) NetSuite Consultant
11 32 (3.06%) Architect
12 29 (2.77%) Engineering Manager
13 26 (2.48%) Business Manager
13 26 (2.48%) IT Manager
14 25 (2.39%) Senior Manager
14 25 (2.39%) Team Leader
15 24 (2.29%) Senior Analyst
15 24 (2.29%) Senior Software Engineer
16 22 (2.10%) Junior
Libraries, Frameworks & Software Standards
1 59 (5.64%) .NET
2 52 (4.97%) REST
3 37 (3.53%) React
4 30 (2.87%) Node.js
5 28 (2.67%) ASP.NET
6 21 (2.01%) HTML
6 21 (2.01%) Web Services
7 19 (1.81%) SOAP
8 18 (1.72%) .NET Framework
8 18 (1.72%) ASP.NET MVC
8 18 (1.72%) Direct3D
8 18 (1.72%) OpenGL
8 18 (1.72%) OpenGL ES
8 18 (1.72%) Vulkan
9 17 (1.62%) FastAPI
9 17 (1.62%) Flask
10 14 (1.34%) CSS
11 12 (1.15%) GraphQL
11 12 (1.15%) Spring
12 11 (1.05%) Next.js
Miscellaneous
1 101 (9.65%) Self-Motivation
2 78 (7.45%) Management Information System
3 68 (6.49%) Onboarding
4 55 (5.25%) Legacy Systems
5 34 (3.25%) Data Centre
6 28 (2.67%) Taxonomies
7 25 (2.39%) Product Ownership
8 22 (2.10%) Enterprise Software
9 21 (2.01%) CMDB
10 18 (1.72%) 3D Graphics
10 18 (1.72%) IoT
10 18 (1.72%) Mali
10 18 (1.72%) Smartphone
11 16 (1.53%) Reinsurance
12 15 (1.43%) Distributed Systems
13 12 (1.15%) Greenfield Project
14 10 (0.96%) Public Cloud
15 8 (0.76%) Data Protection Act
15 8 (0.76%) Robotics
16 7 (0.67%) Credit Risk
Operating Systems
1 56 (5.35%) Windows
2 29 (2.77%) Linux
3 23 (2.20%) Android
4 16 (1.53%) Windows Server
5 12 (1.15%) Windows 10
6 6 (0.57%) Unix
7 5 (0.48%) Windows 7
8 4 (0.38%) Apple iOS
8 4 (0.38%) VMS
9 1 (0.096%) Mac OS
9 1 (0.096%) Windows Server 2012
9 1 (0.096%) Windows Server 2016
9 1 (0.096%) Windows Server 2019
Processes & Methodologies
1 405 (38.68%) Problem-Solving
2 251 (23.97%) Agile
3 208 (19.87%) Project Management
4 162 (15.47%) Continuous Improvement
5 152 (14.52%) Stakeholder Management
6 127 (12.13%) Project Delivery
7 118 (11.27%) Software Engineering
8 112 (10.70%) Decision-Making
9 110 (10.51%) Migration
10 98 (9.36%) Mentoring
11 96 (9.17%) Business Analysis
12 93 (8.88%) Customer Service
13 87 (8.31%) User Acceptance Testing
14 86 (8.21%) Business Strategy
15 85 (8.12%) Coaching
16 82 (7.83%) Analytics
17 80 (7.64%) ITIL
17 80 (7.64%) Roadmaps
18 79 (7.55%) Change Management
19 78 (7.45%) Business Intelligence
Programming Languages
1 133 (12.70%) SQL
2 65 (6.21%) C#
3 58 (5.54%) Python
4 37 (3.53%) JavaScript
5 33 (3.15%) Java
6 30 (2.87%) TypeScript
7 26 (2.48%) PowerShell
8 25 (2.39%) C
8 25 (2.39%) C++
9 11 (1.05%) PL/SQL
10 10 (0.96%) T-SQL
11 8 (0.76%) Scala
11 8 (0.76%) VB.NET
12 7 (0.67%) Delphi
12 7 (0.67%) R
13 6 (0.57%) Go
13 6 (0.57%) VBA
14 4 (0.38%) Embedded C
14 4 (0.38%) Embedded C++
15 3 (0.29%) PHP
Qualifications
1 249 (23.78%) Degree
2 65 (6.21%) Security Cleared
3 46 (4.39%) Computer Science Degree
4 41 (3.92%) Master's Degree
5 34 (3.25%) SC Cleared
6 22 (2.10%) PMI Certification
7 18 (1.72%) CISSP
7 18 (1.72%) PhD
8 17 (1.62%) PMP
9 14 (1.34%) ITIL Certification
9 14 (1.34%) Six Sigma Black Belt
10 12 (1.15%) DV Cleared
11 11 (1.05%) BPSS Clearance
12 10 (0.96%) Cisco Certification
12 10 (0.96%) SANS
13 9 (0.86%) GIAC
14 7 (0.67%) Azure Certification
14 7 (0.67%) CCNP
15 6 (0.57%) ACCA
15 6 (0.57%) CIMA
Quality Assurance & Compliance
1 88 (8.40%) QA
2 30 (2.87%) PMO
3 26 (2.48%) SLA
4 20 (1.91%) ISO/IEC 27001
5 19 (1.81%) GDPR
6 17 (1.62%) Sarbanes-Oxley
7 16 (1.53%) Data Quality
8 14 (1.34%) Accessibility
8 14 (1.34%) NIST
9 12 (1.15%) WCAG
10 7 (0.67%) PCI DSS
11 5 (0.48%) Automotive SPICE
11 5 (0.48%) Cyber Essentials
11 5 (0.48%) ISO 26262
12 4 (0.38%) GRC
13 3 (0.29%) Actionable Recommendations
14 2 (0.19%) COBIT
14 2 (0.19%) COSHH
14 2 (0.19%) ISO 9001
14 2 (0.19%) Solvency II
System Software
1 44 (4.20%) Active Directory
2 31 (2.96%) Docker
3 18 (1.72%) VMware Infrastructure
4 5 (0.48%) Firmware
5 4 (0.38%) Hyper-V
5 4 (0.38%) VMware ESXi
6 3 (0.29%) IAG
6 3 (0.29%) Virtual Machines
6 3 (0.29%) Virtual Servers
7 2 (0.19%) Virtual Desktop
Systems Management
1 23 (2.20%) Kubernetes
2 16 (1.53%) Terraform
3 10 (0.96%) SCCM
4 7 (0.67%) Ansible
5 5 (0.48%) Microsoft Intune
6 4 (0.38%) vCenter Server
7 3 (0.29%) SCOM
8 2 (0.19%) Cisco CUCM
8 2 (0.19%) Failover Clustering
8 2 (0.19%) Nagios
8 2 (0.19%) Stealthwatch
9 1 (0.096%) ITRS Geneos
9 1 (0.096%) Progress Chef
Vendors
1 186 (17.77%) Microsoft
2 45 (4.30%) Oracle
3 43 (4.11%) SAP
4 42 (4.01%) Google
5 33 (3.15%) ServiceNow
6 24 (2.29%) Salesforce
7 23 (2.20%) VMware
8 22 (2.10%) Juniper
8 22 (2.10%) SolarWinds
9 14 (1.34%) Cisco
10 12 (1.15%) BMC
11 11 (1.05%) Informatica
12 9 (0.86%) Hyperion
13 8 (0.76%) Citrix
14 7 (0.67%) Databricks
14 7 (0.67%) HP
15 6 (0.57%) Palo Alto
15 6 (0.57%) Workday
16 5 (0.48%) Adobe
16 5 (0.48%) Atlassian