Influencing Skills Jobs

Influencing Skills
UK

The table below looks at the prevalence of the term Influencing Skills in permanent job vacancies. Included is a benchmarking guide to the salaries offered in vacancies that cited Influencing Skills over the 6 months leading up to 26 October 2024, comparing them to the same period in the previous two years.

6 months to
26 Oct 2024
Same period 2023 Same period 2022
Rank 138 216 221
Rank change year-on-year +78 +5 +27
Permanent jobs citing Influencing Skills 1,469 988 2,532
As % of all permanent jobs advertised in the UK 1.93% 1.68% 1.79%
As % of the General category 3.28% 2.54% 2.63%
Number of salaries quoted 206 486 1,279
10th Percentile £41,250 £39,294 £39,500
25th Percentile £51,250 £50,932 £45,250
Median annual salary (50th Percentile) £65,000 £68,884 £60,000
Median % change year-on-year -5.64% +14.81% -4.00%
75th Percentile £84,660 £87,500 £77,500
90th Percentile £110,000 £97,500 £96,250
UK excluding London median annual salary £60,000 £62,500 £52,500
% change year-on-year -4.00% +19.05% -

All General Skills
UK

Influencing Skills falls under the General Skills category. For comparison with the information above, the following table provides summary statistics for all permanent job vacancies requiring common skills.

Permanent vacancies with a requirement for common skills 44,834 38,845 96,332
As % of all permanent jobs advertised in the UK 58.98% 66.16% 68.28%
Number of salaries quoted 19,835 26,844 50,848
10th Percentile £32,000 £31,250 £32,500
25th Percentile £42,500 £42,500 £44,192
Median annual salary (50th Percentile) £58,500 £60,000 £60,000
Median % change year-on-year -2.50% - +4.35%
75th Percentile £78,750 £80,000 £81,250
90th Percentile £100,000 £100,000 £100,000
UK excluding London median annual salary £50,500 £50,000 £52,500
% change year-on-year +1.00% -4.76% +10.53%

Influencing Skills
Job Vacancy Trend

Job postings citing Influencing Skills as a proportion of all IT jobs advertised.
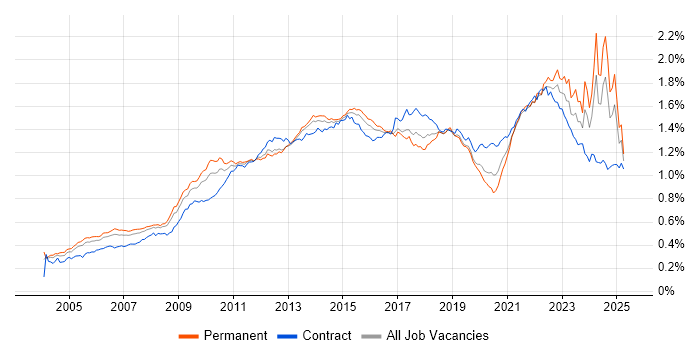
Job vacancy trend for Influencing Skills in the UK

Influencing Skills
Salary Trend

3-month moving average salary quoted in jobs citing Influencing Skills.

Salary trend for Influencing Skills in the UK

Influencing Skills
Salary Histogram

Salary distribution for jobs citing Influencing Skills over the 6 months to 26 October 2024.

Salary histogram for Influencing Skills in the UK

Influencing Skills
Top 17 Job Locations

The table below looks at the demand and provides a guide to the median salaries quoted in IT jobs citing Influencing Skills within the UK over the 6 months to 26 October 2024. The 'Rank Change' column provides an indication of the change in demand within each location based on the same 6 month period last year.

Location Rank Change
on Same Period
Last Year
Matching
Permanent
IT Job Ads
Median Salary
Past 6 Months
Median Salary
% Change
on Same Period
Last Year
Live
Jobs
England +74 1,255 £65,000 -7.14% 210
Work from Home +132 1,020 £70,000 +5.68% 131
UK excluding London +1 778 £60,000 -4.00% 138
London +155 625 £76,000 -5.00% 83
South East +20 189 £60,000 -10.27% 26
Scotland +47 175 £75,000 -1.49% 8
North of England -13 159 £55,000 -18.52% 34
South West +5 108 £90,000 +50.00% 22
Midlands -41 104 £55,000 -8.33% 33
North West -32 96 £50,000 -15.14% 25
West Midlands -52 68 £53,500 -10.83% 25
Yorkshire +15 49 £56,700 -24.40% 6
East Midlands -15 35 £56,700 +0.80% 8
East of England -60 24 £62,773 +11.60% 13
Wales +13 14 - - 4
North East -19 14 £51,924 -11.24% 3
Northern Ireland +13 5 - - 2

Influencing Skills
Co-occurring Skills and Capabilities by Category

The follow tables expand on the table above by listing co-occurrences grouped by category. The same employment type, locality and period is covered with up to 20 co-occurrences shown in each of the following categories:

Application Platforms
1 84 (5.72%) Oracle Application Server
2 7 (0.48%) Confluence
3 6 (0.41%) CMS
4 4 (0.27%) Apache
4 4 (0.27%) OpenStack
4 4 (0.27%) SAS
4 4 (0.27%) SharePoint
5 3 (0.20%) Adobe Experience Manager
6 2 (0.14%) Drupal
6 2 (0.14%) SharePoint Server
7 1 (0.068%) Jupyter
7 1 (0.068%) Liferay
7 1 (0.068%) Microsoft Exchange
Applications
1 31 (2.11%) Microsoft Excel
2 18 (1.23%) Microsoft Office
3 12 (0.82%) Microsoft PowerPoint
4 8 (0.54%) MS Visio
5 6 (0.41%) Microsoft Project
6 4 (0.27%) Oracle Smart View
7 2 (0.14%) SPSS
Business Applications
1 85 (5.79%) Oracle EBS
2 7 (0.48%) Oracle ERP
3 5 (0.34%) Dynamics CRM
4 3 (0.20%) Dynamics AX
4 3 (0.20%) NEC Housing
4 3 (0.20%) Oracle Manufacturing
5 2 (0.14%) SAP S/4HANA
5 2 (0.14%) Shopify
6 1 (0.068%) Endur
6 1 (0.068%) Exchequer
6 1 (0.068%) Remedy ITSM
6 1 (0.068%) SAP CCM
6 1 (0.068%) SAP ERP
6 1 (0.068%) SAP GRC
6 1 (0.068%) SAP PM
6 1 (0.068%) SAP PP
6 1 (0.068%) SAP SD
Cloud Services
1 497 (33.83%) GCP
2 57 (3.88%) AWS
3 45 (3.06%) Azure
4 28 (1.91%) Power Platform
5 18 (1.23%) Amazon S3
5 18 (1.23%) AWS Lambda
5 18 (1.23%) Serverless
6 14 (0.95%) Amazon SQS
6 14 (0.95%) IaaS
6 14 (0.95%) PaaS
6 14 (0.95%) SaaS
7 12 (0.82%) Snowflake
8 9 (0.61%) OCI
9 7 (0.48%) GitHub
10 6 (0.41%) Azure DevOps
10 6 (0.41%) Microsoft 365
11 5 (0.34%) Azure Data Factory
11 5 (0.34%) Dynamics 365
12 4 (0.27%) Figma
12 4 (0.27%) Route 53
Communications & Networking
1 719 (48.94%) Broadband
2 15 (1.02%) Firewall
3 12 (0.82%) Wi-Fi
4 10 (0.68%) DNS
5 6 (0.41%) TCP/IP
5 6 (0.41%) VLAN
5 6 (0.41%) VPN
6 5 (0.34%) WAN
7 4 (0.27%) IPv6
7 4 (0.27%) LAN
7 4 (0.27%) MPLS
8 3 (0.20%) Structured Cabling
9 2 (0.14%) HTTP
9 2 (0.14%) HTTPS
9 2 (0.14%) Internet
9 2 (0.14%) Intrusion Detection
9 2 (0.14%) Network Security
9 2 (0.14%) Wireless
10 1 (0.068%) Intranet
10 1 (0.068%) VoIP
Database & Business Intelligence
1 582 (39.62%) Data Hub
2 98 (6.67%) Data Warehouse
3 84 (5.72%) Enterprise Data Warehouse
3 84 (5.72%) RDBMS
3 84 (5.72%) Relational Database
4 25 (1.70%) Power BI
5 18 (1.23%) Tableau
6 15 (1.02%) SQL Server
7 10 (0.68%) PostgreSQL
8 7 (0.48%) MySQL
8 7 (0.48%) Oracle BI Publisher
8 7 (0.48%) SQL Server Integration Services
9 5 (0.34%) Data Mart
10 4 (0.27%) Oracle BI EE
10 4 (0.27%) Oracle ODI
10 4 (0.27%) SQL Server Reporting Services
11 3 (0.20%) MongoDB
11 3 (0.20%) NoSQL
11 3 (0.20%) Power Query
11 3 (0.20%) PowerPivot
Development Applications
1 17 (1.16%) JIRA
2 11 (0.75%) Git
3 9 (0.61%) Jenkins
4 5 (0.34%) Spinnaker
5 4 (0.27%) Maven
6 3 (0.20%) Gradle
6 3 (0.20%) Sonatype Nexus
7 2 (0.14%) GitLab
8 1 (0.068%) Cactus
8 1 (0.068%) Rational DOORS
General
1 1,010 (68.75%) Social Skills
2 362 (24.64%) Analytical Skills
3 306 (20.83%) Finance
4 139 (9.46%) Inclusion and Diversity
5 136 (9.26%) Games
6 116 (7.90%) Organisational Skills
7 91 (6.19%) Billing
8 86 (5.85%) Military
9 83 (5.65%) Legal
10 48 (3.27%) Retail
11 38 (2.59%) Marketing
12 37 (2.52%) Manufacturing
13 36 (2.45%) Presentation Skills
14 35 (2.38%) Banking
15 23 (1.57%) Public Sector
16 20 (1.36%) Telecoms
17 15 (1.02%) Local Government
18 14 (0.95%) Health Technology
18 14 (0.95%) Publishing
18 14 (0.95%) Tech for Good
Job Titles
1 867 (59.02%) Senior
2 728 (49.56%) Analyst
3 670 (45.61%) Senior Analyst
4 382 (26.00%) IT Analyst
5 381 (25.94%) Audit Analyst
6 122 (8.30%) Lead
7 116 (7.90%) Data Analyst
8 80 (5.45%) DevOps Engineer
9 66 (4.49%) Senior Manager
10 58 (3.95%) Project Manager
11 57 (3.88%) Senior DevOps
11 57 (3.88%) Senior DevOps Engineer
12 47 (3.20%) Product Manager
13 46 (3.13%) Service Delivery Executive
14 43 (2.93%) Principal Engineer
15 42 (2.86%) Principal Systems Engineer
15 42 (2.86%) Requirements Engineer
16 35 (2.38%) Infrastructure Manager
17 28 (1.91%) IT Manager
18 26 (1.77%) Risk Manager
Libraries, Frameworks & Software Standards
1 14 (0.95%) RESTful
2 8 (0.54%) Oracle Fusion
3 5 (0.34%) .NET
3 5 (0.34%) Middleware
4 4 (0.27%) LAPP Stack
5 3 (0.20%) .NET Framework
5 3 (0.20%) ASP.NET
5 3 (0.20%) ASP.NET MVC
5 3 (0.20%) Node.js
5 3 (0.20%) React
5 3 (0.20%) YAML
6 2 (0.14%) CSS
6 2 (0.14%) HTML
6 2 (0.14%) HTML5
6 2 (0.14%) jQuery
6 2 (0.14%) Loki
6 2 (0.14%) Vue
6 2 (0.14%) Web Services
7 1 (0.068%) GraphQL
7 1 (0.068%) scikit-learn
Miscellaneous
1 136 (9.26%) Social Media
2 106 (7.22%) Self-Motivation
3 38 (2.59%) Onboarding
4 26 (1.77%) Management Information System
4 26 (1.77%) Product Ownership
5 19 (1.29%) Virtual Team
6 16 (1.09%) FMCG
7 12 (0.82%) Analytical Mindset
8 11 (0.75%) Cyber Threat
9 10 (0.68%) Data Centre
10 9 (0.61%) e-Learning
11 7 (0.48%) Client/Server
11 7 (0.48%) Cloud Native
11 7 (0.48%) NHS
12 6 (0.41%) Enterprise Software
12 6 (0.41%) Reference Data
13 5 (0.34%) PMI
13 5 (0.34%) Private Cloud
14 4 (0.27%) Low-Code
14 4 (0.27%) Security Posture
Operating Systems
1 16 (1.09%) Windows
2 11 (0.75%) Linux
3 8 (0.54%) Windows Server
4 7 (0.48%) Android
4 7 (0.48%) Apple iOS
5 3 (0.20%) Unix
6 1 (0.068%) VMS
6 1 (0.068%) Windows 10
Processes & Methodologies
1 791 (53.85%) Analytics
2 790 (53.78%) Problem-Solving
3 691 (47.04%) Customer Experience
4 685 (46.63%) Continuous Improvement
5 601 (40.91%) Data Management
6 598 (40.71%) Data Governance
7 582 (39.62%) Data Transformation
8 433 (29.48%) Data Analysis
9 390 (26.55%) IT Audit
10 279 (18.99%) Risk Management
11 271 (18.45%) Agile
12 234 (15.93%) Project Management
13 215 (14.64%) Mentoring
14 197 (13.41%) Stakeholder Management
15 127 (8.65%) DevOps
16 118 (8.03%) ERP
17 112 (7.62%) ITIL
18 107 (7.28%) Service Management
19 105 (7.15%) Software Engineering
20 104 (7.08%) User Stories
Programming Languages
1 55 (3.74%) SQL
2 43 (2.93%) Python
3 12 (0.82%) Java
4 11 (0.75%) PowerShell
4 11 (0.75%) VBA
5 7 (0.48%) T-SQL
6 6 (0.41%) JavaScript
7 4 (0.27%) R
8 3 (0.20%) Shell Script
9 2 (0.14%) Bash
9 2 (0.14%) PHP
10 1 (0.068%) Bicep
10 1 (0.068%) C
10 1 (0.068%) C++
10 1 (0.068%) Clipper
10 1 (0.068%) Data Analysis Expressions
10 1 (0.068%) Perl
10 1 (0.068%) PL/SQL
Qualifications
1 604 (41.12%) CISA
2 195 (13.27%) Degree
3 110 (7.49%) DBS Check
4 88 (5.99%) CCA
5 49 (3.34%) Numerate Degree
6 29 (1.97%) Security Cleared
7 23 (1.57%) CISSP
8 19 (1.29%) SC Cleared
9 15 (1.02%) CISM
10 13 (0.88%) Computer Science Degree
11 12 (0.82%) PMI Certification
12 8 (0.54%) PMP
13 7 (0.48%) Master's Degree
14 6 (0.41%) (ISC)2 CCSP
14 6 (0.41%) Cisco Certification
14 6 (0.41%) CRISC
15 5 (0.34%) Azure Certification
15 5 (0.34%) BPSS Clearance
16 4 (0.27%) AWS Certification
16 4 (0.27%) ISO 27001 Lead Auditor
Quality Assurance & Compliance
1 592 (40.30%) Sarbanes-Oxley
2 32 (2.18%) Data Quality
3 25 (1.70%) ISO/IEC 27001
4 23 (1.57%) PMO
5 22 (1.50%) QA
6 17 (1.16%) Cyber Essentials
7 16 (1.09%) Accessibility
7 16 (1.09%) ITGC
7 16 (1.09%) NIST
8 10 (0.68%) GDPR
9 9 (0.61%) NCSC
9 9 (0.61%) SLA
10 5 (0.34%) Cyber Essentials PLUS
11 4 (0.27%) COBIT
11 4 (0.27%) HIPAA
11 4 (0.27%) ISO 9001
11 4 (0.27%) P3O
12 3 (0.20%) GRC
12 3 (0.20%) SOC 2
13 2 (0.14%) California Consumer Privacy Act
System Software
1 24 (1.63%) Virtual Machines
2 7 (0.48%) Docker
3 5 (0.34%) Active Directory
4 2 (0.14%) Microsoft Virtual Server
4 2 (0.14%) Virtual Servers
4 2 (0.14%) VMware Infrastructure
5 1 (0.068%) IAG
Systems Management
1 18 (1.23%) Kubernetes
2 16 (1.09%) Terraform
3 9 (0.61%) SCOM
4 7 (0.48%) Ansible
5 5 (0.34%) Prometheus
6 4 (0.27%) Puppet
7 2 (0.14%) Active Directory Federation Services
7 2 (0.14%) CASB
7 2 (0.14%) Grafana
7 2 (0.14%) Kibana
7 2 (0.14%) Nagios
7 2 (0.14%) Progress Chef
7 2 (0.14%) Single Sign-On
8 1 (0.068%) Kubeflow
8 1 (0.068%) Netcool
8 1 (0.068%) SCOrch
Vendors
1 492 (33.49%) Google
2 103 (7.01%) Oracle
3 52 (3.54%) Microsoft
4 12 (0.82%) Genesys
4 12 (0.82%) Verint
5 8 (0.54%) Salesforce
5 8 (0.54%) VMware
6 7 (0.48%) BT
6 7 (0.48%) SAP
7 6 (0.41%) Veeam
8 4 (0.27%) Databricks
8 4 (0.27%) NEC
8 4 (0.27%) Zerto
9 3 (0.20%) Adobe
9 3 (0.20%) IBM
9 3 (0.20%) IFS
9 3 (0.20%) MuleSoft
9 3 (0.20%) ScienceLogic
9 3 (0.20%) ServiceNow
9 3 (0.20%) Splunk