Senior Manager
UK

The median Senior Manager salary in the UK is £65,000 per year according to job vacancies posted during the 6 months to 5 December 2023.

The first table below provides salary benchmarking and summary statistics including a comparison to same period in the previous 2 years.

6 months to
5 Dec 2023
Same period 2022 Same period 2021
Rank 234 217 304
Rank change year-on-year -17 +87 +83
Permanent jobs requiring a Senior Manager 795 2,134 1,561
As % of all permanent jobs advertised in the UK 1.49% 1.72% 1.23%
As % of the Job Titles category 1.56% 1.80% 1.29%
Number of salaries quoted 535 1,023 1,007
10th Percentile £50,713 £51,476 £50,000
25th Percentile £60,000 £60,000 £56,250
Median annual salary (50th Percentile) £65,000 £75,000 £72,500
Median % change year-on-year -13.33% +3.45% +3.57%
75th Percentile £85,000 £91,250 £90,000
90th Percentile £107,500 £107,500 £108,200
UK excluding London median annual salary £60,000 £65,250 £62,000
% change year-on-year -8.05% +5.24% +3.33%

All Permanent IT Job Vacancies
UK

The following table is for comparison with the above and includes summary statistics for all permanent IT job vacancies. Most job vacancies include a discernible job title that can be normalized. As such, the figures in the second row provide an indication of the number of permanent jobs in our overall sample.

Permanent vacancies in the UK with a recognized job title 50,985 118,425 121,174
% of permanent jobs with a recognized job title 95.43% 95.37% 95.14%
Number of salaries quoted 37,346 74,222 83,417
10th Percentile £31,250 £32,750 £32,000
25th Percentile £42,500 £45,000 £42,500
Median annual salary (50th Percentile) £60,000 £60,000 £57,500
Median % change year-on-year - +4.35% +4.55%
75th Percentile £80,000 £81,250 £77,500
90th Percentile £97,500 £98,750 £95,000
UK excluding London median annual salary £52,500 £52,500 £50,000
% change year-on-year - +5.00% +5.26%

Senior Manager
Job Vacancy Trend

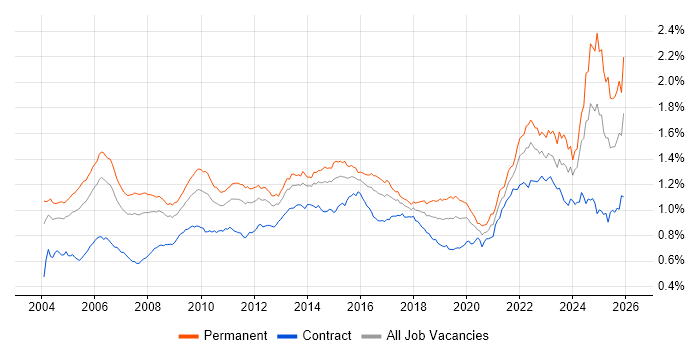
Job postings that featured Senior Manager in the job title as a proportion of all IT jobs advertised.

Job vacancy trend for Senior Manager in the UK

Senior Manager
Salary Trend

3-month moving average salary quoted in jobs citing Senior Manager.

Salary trend for Senior Manager in the UK

Senior Manager
Salary Histogram

Salary distribution for jobs citing Senior Manager over the 6 months to 5 December 2023.

Salary histogram for Senior Manager in the UK

Senior Manager
Top 18 Job Locations

The table below looks at the demand and provides a guide to the median salaries quoted in IT jobs citing Senior Manager within the UK over the 6 months to 5 December 2023. The 'Rank Change' column provides an indication of the change in demand within each location based on the same 6 month period last year.

Location Rank Change
on Same Period
Last Year
Matching
Permanent
IT Job Ads
Median Salary
Past 6 Months
Median Salary
% Change
on Same Period
Last Year
Live
Jobs
England -16 692 £65,000 -13.33% 746
UK excluding London +28 424 £60,000 -8.05% 320
London -35 315 £80,000 -3.03% 444
Work from Home -29 278 £70,000 -6.67% 305
North of England +83 143 £60,000 -10.56% 95
South East +40 102 £65,000 -7.14% 95
Yorkshire +114 89 £60,000 -20.00% 23
Midlands +49 53 £60,000 -4.00% 43
South West +25 49 £60,000 -4.57% 38
North West +38 41 £60,000 -7.69% 59
Scotland +34 35 £70,000 +1.45% 11
West Midlands +52 29 £61,250 +3.38% 36
East Midlands +31 24 £57,500 -11.54% 7
Wales +26 18 £55,000 +38.61% 10
East of England +73 17 £60,000 -20.00% 28
North East +44 9 £60,000 -14.29% 14
Northern Ireland +41 6 £60,000 +9.09% 13
Channel Islands - 1 £85,000 -

Senior Manager Skill Set
Top 30 Co-occurring Skills and Capabilities

For the 6 months to 5 December 2023, Senior Manager job roles required the following skills and capabilities in order of popularity. The figures indicate the absolute number co-occurrences and as a proportion of all permanent job ads featuring Senior Manager in the job title.

1 279 (35.09%) Project Management
2 271 (34.09%) Finance
3 268 (33.71%) Degree
4 250 (31.45%) Social Skills
5 217 (27.30%) Project Delivery
6 190 (23.90%) Agile
7 189 (23.77%) PRINCE2
8 163 (20.50%) ERP
9 154 (19.37%) SDLC
10 149 (18.74%) Scrum
11 134 (16.86%) Computer Science
12 132 (16.60%) Computer Science Degree
13 118 (14.84%) Salesforce
14 116 (14.59%) Virtual Team
15 115 (14.47%) Management Information System
16 113 (14.21%) Migration
17 108 (13.58%) NEC
18 102 (12.83%) GDPR
19 100 (12.58%) Stakeholder Management
20 99 (12.45%) Windows
21 98 (12.33%) Microsoft
22 96 (12.08%) Cybersecurity
23 91 (11.45%) Marketing
24 86 (10.82%) Roadmaps
25 80 (10.06%) CISSP
26 79 (9.94%) Problem-Solving
27 78 (9.81%) Decision-Making
28 76 (9.56%) LAN
29 74 (9.31%) Games
30 73 (9.18%) WAN

Senior Manager Skill Set
Co-occurring Skills and Capabilities by Category

The follow tables expand on the table above by listing co-occurrences grouped by category. The same employment type, locality and period is covered with up to 20 co-occurrences shown in each of the following categories:

Application Platforms
1 8 (1.01%) SharePoint
2 6 (0.75%) Confluence
3 3 (0.38%) Apache Spark
3 3 (0.38%) MS Exchange
4 2 (0.25%) CMS
4 2 (0.25%) Exchange Server 2010
5 1 (0.13%) Apache Airflow
5 1 (0.13%) Apache Pulsar
5 1 (0.13%) SAS
Applications
1 47 (5.91%) Microsoft Excel
2 42 (5.28%) Microsoft Project
3 39 (4.91%) Microsoft Office
4 19 (2.39%) Microsoft PowerPoint
5 7 (0.88%) MS Visio
6 4 (0.50%) AutoCAD
7 1 (0.13%) Spreadsheet
7 1 (0.13%) SPSS
Business Applications
1 40 (5.03%) Oracle ERP
2 19 (2.39%) Endur
3 6 (0.75%) SAP S/4HANA
4 4 (0.50%) SAP ERP
4 4 (0.50%) Unit4 Business World
5 3 (0.38%) Shopify
6 2 (0.25%) Maximo
6 2 (0.25%) Oracle EBS
7 1 (0.13%) Fidessa
7 1 (0.13%) Magento
7 1 (0.13%) Oracle EBS R12
7 1 (0.13%) Primavera
7 1 (0.13%) SAP CO
7 1 (0.13%) SAP FI
7 1 (0.13%) SAP FI/CO
7 1 (0.13%) SAP IBP
7 1 (0.13%) SAP Oil and Gas
7 1 (0.13%) SAP SD
Cloud Services
1 53 (6.67%) Azure
2 37 (4.65%) AWS
3 25 (3.14%) Power Platform
4 20 (2.52%) Microsoft 365
5 18 (2.26%) SaaS
6 17 (2.14%) GCP
7 11 (1.38%) Azure DevOps
8 9 (1.13%) Datadog
8 9 (1.13%) IaaS
9 8 (1.01%) Entra ID
10 7 (0.88%) PaaS
11 6 (0.75%) GitHub
12 5 (0.63%) Azure ExpressRoute
12 5 (0.63%) Azure Sentinel
13 4 (0.50%) dbt
13 4 (0.50%) Smartsheet
14 3 (0.38%) Azure AKS
14 3 (0.38%) Azure Key Vault
14 3 (0.38%) Azure Monitor
14 3 (0.38%) Azure Pipelines
Communications & Networking
1 76 (9.56%) LAN
2 73 (9.18%) WAN
3 60 (7.55%) Intrusion Detection
4 15 (1.89%) Firewall
5 9 (1.13%) Network Security
5 9 (1.13%) Wi-Fi
6 7 (0.88%) DNS
6 7 (0.88%) SD-WAN
6 7 (0.88%) WLAN
7 6 (0.75%) VPN
8 5 (0.63%) 5G
8 5 (0.63%) MPLS
9 4 (0.50%) Software-Defined Networking
9 4 (0.50%) Unified Communications
9 4 (0.50%) Wireless
10 3 (0.38%) DHCP
10 3 (0.38%) VLAN
11 2 (0.25%) Broadband
11 2 (0.25%) VoIP
11 2 (0.25%) WPA
Database & Business Intelligence
1 40 (5.03%) Oracle Reports
2 21 (2.64%) Power BI
3 20 (2.52%) SQL Server
4 14 (1.76%) RDBMS
4 14 (1.76%) Relational Database
5 10 (1.26%) Metadata
6 4 (0.50%) DB2
7 3 (0.38%) Hadoop
8 2 (0.25%) Apache Hive
8 2 (0.25%) Big Data
8 2 (0.25%) Data Hub
8 2 (0.25%) Data Warehouse
9 1 (0.13%) Amazon Athena
9 1 (0.13%) Bigtable
9 1 (0.13%) DynamoDB
9 1 (0.13%) Flink
9 1 (0.13%) Impala
9 1 (0.13%) Mixpanel
9 1 (0.13%) Presto
9 1 (0.13%) Sqoop
Development Applications
1 13 (1.64%) JIRA
2 5 (0.63%) Git
3 3 (0.38%) Gatling
3 3 (0.38%) JUnit
3 3 (0.38%) LoadRunner
3 3 (0.38%) SonarQube
3 3 (0.38%) Sonatype Nexus
4 2 (0.25%) Jenkins
5 1 (0.13%) Selenium
General
1 271 (34.09%) Finance
2 250 (31.45%) Social Skills
3 91 (11.45%) Marketing
4 74 (9.31%) Games
5 66 (8.30%) Public Sector
6 47 (5.91%) Analytical Skills
6 47 (5.91%) Inclusion and Diversity
7 44 (5.53%) Back Office
7 44 (5.53%) Telecoms
8 43 (5.41%) Retail
9 37 (4.65%) Legal
10 35 (4.40%) Influencing Skills
11 29 (3.65%) Manufacturing
12 26 (3.27%) Law
13 25 (3.14%) Banking
13 25 (3.14%) Electronics
14 22 (2.77%) Presentation Skills
15 17 (2.14%) Local Government
16 11 (1.38%) Organisational Skills
17 8 (1.01%) Pharmaceutical
Libraries, Frameworks & Software Standards
1 39 (4.91%) Oracle Fusion
2 5 (0.63%) .NET
3 4 (0.50%) EDI
3 4 (0.50%) React
4 3 (0.38%) ARM Templates
4 3 (0.38%) Azure Blueprints
5 2 (0.25%) AngularJS
5 2 (0.25%) Apache Beam
5 2 (0.25%) AWS CDK
5 2 (0.25%) HTML
5 2 (0.25%) Kafka
6 1 (0.13%) ATL
6 1 (0.13%) CSS
6 1 (0.13%) FIX Protocol
6 1 (0.13%) Middleware
6 1 (0.13%) OpenID
6 1 (0.13%) SailPoint
6 1 (0.13%) SAML
6 1 (0.13%) Spring
6 1 (0.13%) Web Services
Miscellaneous
1 116 (14.59%) Virtual Team
2 115 (14.47%) Management Information System
3 61 (7.67%) Security Operations Centre
4 27 (3.40%) Onboarding
5 16 (2.01%) NHS
6 14 (1.76%) Swaptions
7 13 (1.64%) Marketing Technology
8 12 (1.51%) PMI
8 12 (1.51%) Product Ownership
9 9 (1.13%) Data Structures
9 9 (1.13%) Mobile App
9 9 (1.13%) Self-Motivation
10 8 (1.01%) Greenfield Project
11 7 (0.88%) Data Centre
12 6 (0.75%) Operational Technology
13 5 (0.63%) Analytical Mindset
14 4 (0.50%) Security Posture
15 3 (0.38%) Acoustics
15 3 (0.38%) Public Cloud
15 3 (0.38%) Renewable Energy
Operating Systems
1 99 (12.45%) Windows
2 66 (8.30%) Unix
3 13 (1.64%) Linux
4 10 (1.26%) Windows Server
5 9 (1.13%) Ubuntu
6 7 (0.88%) Android
6 7 (0.88%) Apple iOS
7 3 (0.38%) Windows Server 2012
8 1 (0.13%) AIX
Processes & Methodologies
1 279 (35.09%) Project Management
2 217 (27.30%) Project Delivery
3 190 (23.90%) Agile
4 189 (23.77%) PRINCE2
5 163 (20.50%) ERP
6 154 (19.37%) SDLC
7 149 (18.74%) Scrum
8 134 (16.86%) Computer Science
9 113 (14.21%) Migration
10 100 (12.58%) Stakeholder Management
11 96 (12.08%) Cybersecurity
12 86 (10.82%) Roadmaps
13 79 (9.94%) Problem-Solving
14 78 (9.81%) Decision-Making
15 72 (9.06%) Continuous Improvement
15 72 (9.06%) ITIL
16 71 (8.93%) Service Management
17 66 (8.30%) Impact Assessments
18 65 (8.18%) Security Management
19 63 (7.92%) Business Continuity
Programming Languages
1 25 (3.14%) Python
2 24 (3.02%) Java
3 18 (2.26%) Bash
3 18 (2.26%) PowerShell
4 14 (1.76%) SQL
4 14 (1.76%) VB
5 11 (1.38%) JavaScript
6 9 (1.13%) Search Processing Language
7 6 (0.75%) Scala
8 3 (0.38%) Bicep
8 3 (0.38%) Go
8 3 (0.38%) Groovy
8 3 (0.38%) TypeScript
8 3 (0.38%) VBA
9 2 (0.25%) C#
10 1 (0.13%) PHP
10 1 (0.13%) R
Qualifications
1 268 (33.71%) Degree
2 132 (16.60%) Computer Science Degree
3 80 (10.06%) CISSP
4 66 (8.30%) CISM
5 60 (7.55%) SSCP
6 55 (6.92%) Security Cleared
7 33 (4.15%) PMI Certification
8 29 (3.65%) Master's Degree
9 28 (3.52%) PMP
10 23 (2.89%) SC Cleared
11 18 (2.26%) ACCA
12 17 (2.14%) Cisco Certification
13 16 (2.01%) MBA
14 14 (1.76%) PRINCE2 Practitioner
15 12 (1.51%) DV Cleared
15 12 (1.51%) PRINCE2 Certification
16 10 (1.26%) DBS Check
17 9 (1.13%) (ISC)2 CCSP
17 9 (1.13%) CCSP
18 8 (1.01%) CCNP
Quality Assurance & Compliance
1 102 (12.83%) GDPR
2 72 (9.06%) ISO/IEC 27001
3 41 (5.16%) Sarbanes-Oxley
4 33 (4.15%) QA
5 24 (3.02%) PMO
6 18 (2.26%) GRC
7 10 (1.26%) NIST
8 8 (1.01%) Data Quality
9 5 (0.63%) COBIT
9 5 (0.63%) NEBOSH
10 4 (0.50%) GAAP
10 4 (0.50%) IFRS
10 4 (0.50%) ITGC
11 3 (0.38%) Cyber Essentials
11 3 (0.38%) SLA
11 3 (0.38%) SOC 2
12 2 (0.25%) COSO
12 2 (0.25%) PCI DSS
13 1 (0.13%) HIPAA
13 1 (0.13%) Solvency II
System Software
1 17 (2.14%) Docker
2 10 (1.26%) Active Directory
3 3 (0.38%) Apache Flume
3 3 (0.38%) VMware Infrastructure
4 2 (0.25%) Embedded Firmware
4 2 (0.25%) Firmware
4 2 (0.25%) Hyper-V
4 2 (0.25%) VMware ESXi
5 1 (0.13%) vSphere
Systems Management
1 22 (2.77%) Kubernetes
2 17 (2.14%) Terraform
3 9 (1.13%) Ansible
4 7 (0.88%) Microsoft Intune
5 3 (0.38%) Istio
6 2 (0.25%) WSUS
7 1 (0.13%) HP Quality Center
7 1 (0.13%) Oozie
Vendors
1 118 (14.84%) Salesforce
2 108 (13.58%) NEC
3 98 (12.33%) Microsoft
4 71 (8.93%) Oracle
5 41 (5.16%) SAP
6 16 (2.01%) Sybase
7 14 (1.76%) OpenLink
7 14 (1.76%) TIBCO
8 13 (1.64%) CA
9 10 (1.26%) Cisco
9 10 (1.26%) Splunk
10 9 (1.13%) AppDynamics
10 9 (1.13%) New Relic
11 8 (1.01%) Meraki
11 8 (1.01%) ServiceNow
12 6 (0.75%) F5
12 6 (0.75%) Google
12 6 (0.75%) Palo Alto
13 4 (0.50%) Atlassian
13 4 (0.50%) Huawei