Line Management Jobs with Work from Home Options

Line Management
UK > Work from Home

The table below provides summary statistics for permanent remote or hybrid work requiring Line Management skills. It includes a benchmarking guide to the annual salaries offered in vacancies that cited Line Management over the 6 months leading up to 26 July 2024, comparing them to the same period in the previous two years.

6 months to
26 Jul 2024
Same period 2023 Same period 2022
Rank 86 134 145
Rank change year-on-year +48 +11 +39
Permanent jobs citing Line Management 883 826 2,206
As % of all permanent jobs with a WFH option 3.16% 2.52% 2.81%
As % of the Processes & Methodologies category 3.57% 2.62% 2.89%
Number of salaries quoted 734 584 1,083
10th Percentile £35,276 £42,874 £40,000
25th Percentile £42,500 £52,500 £50,000
Median annual salary (50th Percentile) £65,000 £67,500 £65,000
Median % change year-on-year -3.70% +3.85% +13.04%
75th Percentile £142,500 £80,000 £80,000
90th Percentile £165,000 £97,500 £93,750
UK median annual salary £56,282 £65,000 £60,000
% change year-on-year -13.41% +8.33% +4.35%

All Process and Methodology Skills
Work from Home

Line Management falls under the Processes and Methodologies category. For comparison with the information above, the following table provides summary statistics for all permanent job vacancies with remote or hybrid options requiring process or methodology skills.

Permanent vacancies with a requirement for process or methodology skills 24,720 31,469 76,283
As % of all permanent jobs with a WFH option 88.48% 95.89% 97.14%
Number of salaries quoted 17,624 23,346 43,834
10th Percentile £35,000 £37,500 £36,250
25th Percentile £42,500 £47,500 £46,250
Median annual salary (50th Percentile) £57,965 £62,500 £60,000
Median % change year-on-year -7.26% +4.17% +9.09%
75th Percentile £77,500 £81,250 £80,000
90th Percentile £96,250 £100,000 £95,000
UK median annual salary £55,000 £60,000 £60,000
% change year-on-year -8.33% - +9.09%

Line Management
Trend for Jobs with a WFH Option

Job vacancies with a work from home option citing Line Management as a proportion of all IT jobs advertised.
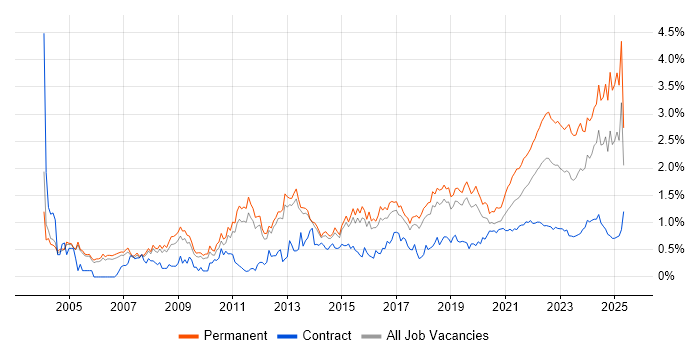
Line Management trend for jobs with a WFH option

Line Management
Salary Trend for Jobs with a WFH Option

3-month moving average salary quoted in job vacancies with a work from home option citing Line Management.

Line Management salary trend for jobs with a WFH option

Line Management
Salary Histogram for Jobs with a WFH Option

Salary distribution for jobs with a work from home option citing Line Management over the 6 months to 26 July 2024.

Line Management salary histogram for jobs with a WFH option

Line Management
Co-occurring Skills and Capabilities with WFH Options by Category

The follow tables expand on the table above by listing co-occurrences grouped by category. The same employment type, locality and period is covered with up to 20 co-occurrences shown in each of the following categories:

Application Platforms
1 205 (23.22%) Apache
2 204 (23.10%) Apache Airflow
3 17 (1.93%) Microsoft Exchange
4 14 (1.59%) SharePoint
5 8 (0.91%) IIS
6 5 (0.57%) Confluence
7 4 (0.45%) CMS
7 4 (0.45%) WordPress
8 2 (0.23%) Umbraco
9 1 (0.11%) OpenStack
9 1 (0.11%) Tomcat
Applications
1 56 (6.34%) Microsoft Excel
2 21 (2.38%) Microsoft PowerPoint
3 19 (2.15%) Microsoft Office
4 3 (0.34%) Microsoft Project
4 3 (0.34%) Simulink
5 2 (0.23%) Spreadsheet
5 2 (0.23%) SPSS
6 1 (0.11%) Adobe Creative Suite
6 1 (0.11%) MS Visio
Business Applications
1 3 (0.34%) Dynamics CRM
2 2 (0.23%) Aladdin
2 2 (0.23%) thinkFolio
3 1 (0.11%) Dynamics NAV
3 1 (0.11%) Elite 3E
3 1 (0.11%) Oracle EBS
3 1 (0.11%) Oracle ERP
3 1 (0.11%) Oracle Payroll
3 1 (0.11%) PeopleSoft HCM
Cloud Services
1 269 (30.46%) AWS
2 227 (25.71%) dbt
3 215 (24.35%) GCP
4 206 (23.33%) Snowflake
5 114 (12.91%) Azure
6 70 (7.93%) Amazon EC2
7 61 (6.91%) Amazon ECS
7 61 (6.91%) Amazon EKS
8 51 (5.78%) Microsoft 365
9 44 (4.98%) SaaS
10 40 (4.53%) Power Platform
11 17 (1.93%) Azure DevOps
11 17 (1.93%) PaaS
12 14 (1.59%) Cloud Computing
13 11 (1.25%) IaaS
13 11 (1.25%) PowerApps
14 10 (1.13%) Power Automate
15 9 (1.02%) Entra ID
16 8 (0.91%) Google Sheets
17 7 (0.79%) Slack
Communications & Networking
1 23 (2.60%) Broadband
2 19 (2.15%) WAN
3 17 (1.93%) Firewall
4 16 (1.81%) SAN
5 14 (1.59%) SD-WAN
6 13 (1.47%) LAN
7 12 (1.36%) DNS
8 11 (1.25%) DHCP
8 11 (1.25%) TCP/IP
9 10 (1.13%) HTTP
10 8 (0.91%) VPN
10 8 (0.91%) Wi-Fi
11 7 (0.79%) Internet
12 6 (0.68%) iSCSI
13 5 (0.57%) SSL
14 4 (0.45%) Peer-to-Peer Networking
14 4 (0.45%) VSAN
15 3 (0.34%) Wireless
16 2 (0.23%) Intranet
16 2 (0.23%) IPsec
Database & Business Intelligence
1 204 (23.10%) Amazon Athena
1 204 (23.10%) Apache Arrow
1 204 (23.10%) Apache Ignite
1 204 (23.10%) Data Lake
1 204 (23.10%) Dremio
2 36 (4.08%) Power BI
3 27 (3.06%) SQL Server
4 14 (1.59%) Relational Database
5 12 (1.36%) GIS
6 10 (1.13%) Azure SQL Database
6 10 (1.13%) Geospatial Data
7 9 (1.02%) Amazon RDS
7 9 (1.02%) MongoDB
7 9 (1.02%) MySQL
7 9 (1.02%) SQL Server Integration Services
8 7 (0.79%) Data Warehouse
8 7 (0.79%) PostgreSQL
9 6 (0.68%) MS Access
10 5 (0.57%) NoSQL
11 4 (0.45%) InfluxDB
Development Applications
1 15 (1.70%) Jenkins
1 15 (1.70%) Postman
2 12 (1.36%) Selenium
3 11 (1.25%) Cucumber
4 9 (1.02%) JIRA
5 7 (0.79%) Git
6 6 (0.68%) SoapUI
7 4 (0.45%) Axure RP
7 4 (0.45%) JMeter
8 3 (0.34%) GitLab
8 3 (0.34%) Visual Studio
9 2 (0.23%) Appium
9 2 (0.23%) Cypress.io
9 2 (0.23%) JUnit
9 2 (0.23%) Oracle Forms
9 2 (0.23%) Team Foundation Server
9 2 (0.23%) TestNG
9 2 (0.23%) TestRail
9 2 (0.23%) WebDriver
10 1 (0.11%) Clang
General
1 410 (46.43%) Finance
2 227 (25.71%) Social Skills
3 209 (23.67%) Front Office
4 207 (23.44%) Banking
5 204 (23.10%) Investment Banking
6 86 (9.74%) Analytical Skills
6 86 (9.74%) Inclusion and Diversity
7 74 (8.38%) Marketing
8 64 (7.25%) Law
9 55 (6.23%) Retail
10 39 (4.42%) Public Sector
11 26 (2.94%) Legal
12 22 (2.49%) Organisational Skills
13 17 (1.93%) Influencing Skills
14 14 (1.59%) Local Government
14 14 (1.59%) Welsh Language
15 13 (1.47%) Electronics
16 11 (1.25%) Back Office
16 11 (1.25%) General Ledger
16 11 (1.25%) Manufacturing
Job Titles
1 245 (27.75%) Lead
2 178 (20.16%) Developer
3 134 (15.18%) Lead Developer
4 124 (14.04%) Software Developer
5 121 (13.70%) Architect
6 115 (13.02%) Lead Software Developer
7 112 (12.68%) Team Leader
8 111 (12.57%) Senior
9 108 (12.23%) Solutions Architect
10 106 (12.00%) Software Engineer
11 105 (11.89%) Software Team Leader
12 103 (11.66%) Lead Software Engineer
13 102 (11.55%) Developer/Software Engineer
14 52 (5.89%) Java Developer
15 51 (5.78%) Java Architect
15 51 (5.78%) Java Software Developer
15 51 (5.78%) Java Software Engineer
15 51 (5.78%) Java Team Leader
15 51 (5.78%) Lead Java Developer
15 51 (5.78%) Python Developer
Libraries, Frameworks & Software Standards
1 204 (23.10%) gRPC
1 204 (23.10%) NumPy
1 204 (23.10%) Pandas
1 204 (23.10%) Protocol Buffers
1 204 (23.10%) SciPy
2 60 (6.80%) PySpark
3 42 (4.76%) .NET
4 23 (2.60%) Node.js
5 22 (2.49%) HTML
6 20 (2.27%) .NET Core
7 17 (1.93%) .NET Framework
7 17 (1.93%) Django
7 17 (1.93%) React
8 16 (1.81%) CSS
9 13 (1.47%) REST
10 7 (0.79%) AngularJS
10 7 (0.79%) Kafka
10 7 (0.79%) Vue
10 7 (0.79%) XML
11 6 (0.68%) ASP.NET
Miscellaneous
1 207 (23.44%) Foreign Exchange (FX)
1 207 (23.44%) Hedge funds
2 205 (23.22%) Derivative
3 204 (23.10%) Equities
3 204 (23.10%) Fixed Income
4 52 (5.89%) Housing Association
5 46 (5.21%) Management Information System
6 44 (4.98%) Social Media
7 34 (3.85%) Self-Motivation
8 30 (3.40%) PMI
9 24 (2.72%) Product Ownership
10 16 (1.81%) Blog
11 14 (1.59%) Public Cloud
12 13 (1.47%) Onboarding
12 13 (1.47%) Operational Technology
13 12 (1.36%) CMDB
13 12 (1.36%) Driving Licence
14 10 (1.13%) Data Centre
15 8 (0.91%) NHS
16 7 (0.79%) Life Science
Operating Systems
1 34 (3.85%) Linux
2 33 (3.74%) Windows
3 17 (1.93%) Windows Server
4 10 (1.13%) Unix
5 9 (1.02%) Red Hat Enterprise Linux
6 7 (0.79%) Apple iOS
7 6 (0.68%) Android
8 3 (0.34%) Windows 10
9 2 (0.23%) Windows Server 2016
10 1 (0.11%) Windows Server 2012
10 1 (0.11%) Windows Server 2019
Processes & Methodologies
1 458 (51.87%) Agile
2 261 (29.56%) Software Engineering
3 214 (24.24%) Asset Management
4 210 (23.78%) Mentoring
5 161 (18.23%) Coaching
6 104 (11.78%) Problem-Solving
7 100 (11.33%) Project Delivery
7 100 (11.33%) Project Management
8 99 (11.21%) Roadmaps
9 85 (9.63%) Migration
10 76 (8.61%) Stakeholder Management
11 74 (8.38%) Continuous Improvement
12 69 (7.81%) Investment Management
13 66 (7.47%) DevOps
14 64 (7.25%) ITIL
15 50 (5.66%) Service Management
16 49 (5.55%) Analytics
16 49 (5.55%) Change Management
16 49 (5.55%) CI/CD
17 47 (5.32%) Decision-Making
Programming Languages
1 243 (27.52%) Python
2 235 (26.61%) Java
2 235 (26.61%) JavaScript
3 210 (23.78%) TypeScript
4 150 (16.99%) SQL
5 40 (4.53%) C#
6 12 (1.36%) Bicep
7 11 (1.25%) T-SQL
8 10 (1.13%) PowerShell
9 7 (0.79%) Data Analysis Expressions
10 5 (0.57%) Go
10 5 (0.57%) PHP
10 5 (0.57%) R
11 3 (0.34%) MATLAB
11 3 (0.34%) Ruby
12 2 (0.23%) C
12 2 (0.23%) VBA
13 1 (0.11%) C++
13 1 (0.11%) Fortran
13 1 (0.11%) Shell Script
Qualifications
1 89 (10.08%) Degree
2 88 (9.97%) Security Cleared
3 77 (8.72%) SC Cleared
4 37 (4.19%) PMI Certification
5 30 (3.40%) PMP
6 27 (3.06%) DBS Check
7 23 (2.60%) APMP
7 23 (2.60%) CAPM
7 23 (2.60%) PgMP
8 18 (2.04%) BPSS Clearance
9 11 (1.25%) ACCA
9 11 (1.25%) CIMA
9 11 (1.25%) CISM
9 11 (1.25%) Microsoft Certification
10 10 (1.13%) CISSP
10 10 (1.13%) CRISC
11 9 (1.02%) CASP
11 9 (1.02%) CEH
12 8 (0.91%) Azure Certification
13 7 (0.79%) ITIL Certification
Quality Assurance & Compliance
1 42 (4.76%) QA
2 23 (2.60%) Accessibility
3 17 (1.93%) NCSC
4 16 (1.81%) SLA
5 11 (1.25%) GDPR
6 9 (1.02%) Data Quality
7 6 (0.68%) ISO/IEC 27001
8 5 (0.57%) Cyber Essentials
8 5 (0.57%) PMO
9 3 (0.34%) Cyber Essentials PLUS
9 3 (0.34%) SOC 1
10 2 (0.23%) Automotive SPICE
10 2 (0.23%) Def Stans
10 2 (0.23%) GAAP
10 2 (0.23%) GRC
10 2 (0.23%) IFRS
10 2 (0.23%) ISO 9001
10 2 (0.23%) NEBOSH
10 2 (0.23%) NIST
11 1 (0.11%) ISO 14001
System Software
1 28 (3.17%) Active Directory
2 19 (2.15%) VMware Infrastructure
3 13 (1.47%) Docker
4 11 (1.25%) IAG
5 5 (0.57%) Hyper-V
6 4 (0.45%) vSphere
7 3 (0.34%) Virtual Servers
8 2 (0.23%) Microsoft Virtual Server
8 2 (0.23%) Virtual Desktop
9 1 (0.11%) Lustre
9 1 (0.11%) Slurm Workload Manager
9 1 (0.11%) VMware ESXi
9 1 (0.11%) XenDesktop
Systems Management
1 20 (2.27%) Terraform
2 19 (2.15%) Kubernetes
3 12 (1.36%) Ansible
4 9 (1.02%) Puppet
4 9 (1.02%) SCCM
5 8 (0.91%) Active Directory Federation Services
6 6 (0.68%) Opsgenie
6 6 (0.68%) VxRail
6 6 (0.68%) ZABBIX
7 4 (0.45%) Grafana
7 4 (0.45%) Microsoft Intune
8 2 (0.23%) Cisco Prime
8 2 (0.23%) Norton AntiVirus
8 2 (0.23%) WhatsUp Gold
9 1 (0.11%) cPanel
9 1 (0.11%) Icinga
9 1 (0.11%) Progress Chef
9 1 (0.11%) Proxmox
9 1 (0.11%) vCenter Server
9 1 (0.11%) WSUS
Vendors
1 106 (12.00%) Microsoft
2 60 (6.80%) Bloomberg
2 60 (6.80%) Reuters
3 33 (3.74%) SAP
4 31 (3.51%) Google
5 25 (2.83%) BT
6 19 (2.15%) VMware
7 13 (1.47%) Cisco
7 13 (1.47%) Oracle
8 11 (1.25%) CA
8 11 (1.25%) Dell
8 11 (1.25%) Salesforce
8 11 (1.25%) ServiceNow
9 10 (1.13%) SolarWinds
10 9 (1.02%) Facebook
10 9 (1.02%) Fortinet
11 6 (0.68%) NetApp
12 5 (0.57%) HP
12 5 (0.57%) Xamarin
13 4 (0.45%) Palo Alto