Confluence Jobs with Hybrid/Remote/WFH Options

Confluence
UK > Work from Home

The table below provides summary statistics for permanent remote or hybrid work requiring Confluence skills. It includes a benchmarking guide to the annual salaries offered in vacancies that cited Confluence over the 6 months leading up to 2 May 2025, comparing them to the same period in the previous two years.

6 months to
2 May 2025
Same period 2024 Same period 2023
Rank 265 323 201
Rank change year-on-year +58 -122 +13
Permanent jobs citing Confluence 150 302 747
As % of all permanent jobs with a WFH option 1.00% 0.89% 1.75%
As % of the Application Platforms category 8.33% 7.59% 14.13%
Number of salaries quoted 112 251 505
10th Percentile £32,175 £39,250 £46,290
25th Percentile £47,231 £47,375 £53,970
Median annual salary (50th Percentile) £65,000 £62,500 £64,029
Median % change year-on-year +4.00% -2.39% +6.72%
75th Percentile £77,630 £75,772 £78,382
90th Percentile £93,778 £90,000 £92,500
UK median annual salary £57,500 £56,500 £65,000
% change year-on-year +1.77% -13.08% +4.00%

All Application Platform Skills
Work from Home

Confluence falls under the Application Platforms category. For comparison with the information above, the following table provides summary statistics for all permanent job vacancies with remote or hybrid options requiring application platform skills.

Permanent vacancies with a requirement for application platform skills 1,801 3,981 5,288
As % of all permanent jobs with a WFH option 12.03% 11.76% 12.39%
Number of salaries quoted 1,303 2,831 3,807
10th Percentile £31,250 £31,250 £32,500
25th Percentile £41,250 £40,000 £43,750
Median annual salary (50th Percentile) £60,000 £55,000 £60,000
Median % change year-on-year +9.09% -8.33% +9.09%
75th Percentile £90,000 £75,772 £78,750
90th Percentile £115,000 £110,000 £100,000
UK median annual salary £55,000 £50,000 £55,000
% change year-on-year +10.00% -9.09% +1.85%

Confluence
Trend for Jobs with a WFH Option

Job vacancies with remote working options citing Confluence as a proportion of all IT jobs advertised.
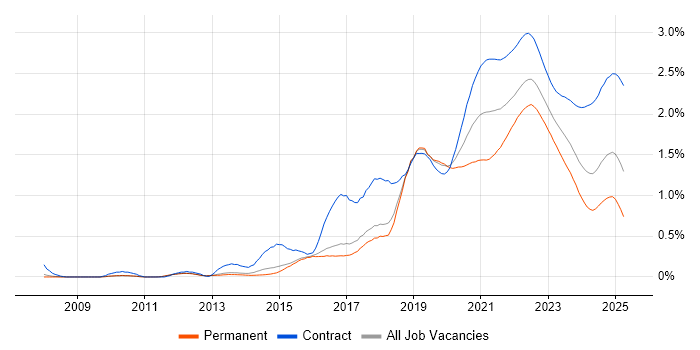
Confluence trend for jobs with Hybrid/Remote/WFH options

Confluence
Salary Trend for Jobs with a WFH Option

3-month moving average salary quoted in job vacancies with remote working options citing Confluence.

Confluence salary trend for jobs with a WFH option

Confluence
Salary Histogram for Jobs with a WFH Option

Salary distribution for jobs with remote working options citing Confluence over the 6 months to 2 May 2025.

Confluence salary histogram for jobs with a WFH option

Confluence
Co-occurring Skills and Capabilities with WFH Options by Category

The follow tables expand on the table above by listing co-occurrences grouped by category. The same employment type, locality and period is covered with up to 20 co-occurrences shown in each of the following categories:

Application Platforms
1 8 (5.33%) SharePoint
2 3 (2.00%) Adobe Experience Manager
3 2 (1.33%) Apache
3 2 (1.33%) Apache Airflow
3 2 (1.33%) Tomcat
3 2 (1.33%) WebSphere
3 2 (1.33%) WebSphere Application Server
4 1 (0.67%) ColdFusion
Applications
1 18 (12.00%) Microsoft Excel
2 9 (6.00%) Microsoft Office
3 5 (3.33%) Microsoft Project
3 5 (3.33%) Trello
4 4 (2.67%) MS Visio
5 3 (2.00%) Microsoft PowerPoint
6 1 (0.67%) FrameMaker
6 1 (0.67%) MadCap Flare
Business Applications
1 1 (0.67%) Payment Gateway
Cloud Services
1 44 (29.33%) Azure
2 37 (24.67%) AWS
3 28 (18.67%) GCP
3 28 (18.67%) GitHub
4 20 (13.33%) SaaS
5 9 (6.00%) Microsoft 365
6 8 (5.33%) Amazon EKS
6 8 (5.33%) Azure DevOps
7 7 (4.67%) Amazon ECR
7 7 (4.67%) Amazon S3
7 7 (4.67%) Power Platform
7 7 (4.67%) Slack
7 7 (4.67%) Virtual Private Cloud
8 6 (4.00%) Amazon EC2
8 6 (4.00%) GitHub Actions
9 5 (3.33%) PaaS
10 4 (2.67%) Google Analytics
10 4 (2.67%) Google Sheets
10 4 (2.67%) Google Tag Manager
10 4 (2.67%) Miro
Communications & Networking
1 15 (10.00%) Internet
2 10 (6.67%) Wi-Fi
3 6 (4.00%) HTTP
4 4 (2.67%) 5G
4 4 (2.67%) Broadband
5 3 (2.00%) Firewall
6 2 (1.33%) Cisco Nexus
6 2 (1.33%) FCoE
6 2 (1.33%) Fibre Channel
6 2 (1.33%) iSCSI
6 2 (1.33%) LAN
6 2 (1.33%) Multicast
6 2 (1.33%) NAS
6 2 (1.33%) SAN
6 2 (1.33%) VPN
6 2 (1.33%) WAN
7 1 (0.67%) Bluetooth
7 1 (0.67%) ZigBee
Database & Business Intelligence
1 17 (11.33%) Relational Database
2 14 (9.33%) MySQL
3 12 (8.00%) PostgreSQL
4 11 (7.33%) MongoDB
4 11 (7.33%) SQL Server
5 7 (4.67%) Power BI
5 7 (4.67%) Redis
6 5 (3.33%) Azure SQL Database
6 5 (3.33%) NoSQL
6 5 (3.33%) Oracle Reports
7 4 (2.67%) Power Query
8 2 (1.33%) Amazon Athena
8 2 (1.33%) Amazon RDS
8 2 (1.33%) Apache Iceberg
8 2 (1.33%) Cloud Spanner
8 2 (1.33%) Data Lake
8 2 (1.33%) Dremio
8 2 (1.33%) Tableau
9 1 (0.67%) Amazon Aurora
9 1 (0.67%) Amazon QuickSight
Development Applications
1 133 (88.67%) JIRA
2 43 (28.67%) Git
3 26 (17.33%) SonarQube
4 25 (16.67%) Jenkins
5 9 (6.00%) GitLab
6 8 (5.33%) Atlassian Bamboo
7 6 (4.00%) AppScan
7 6 (4.00%) Cucumber
7 6 (4.00%) Sonatype Nexus
8 5 (3.33%) Selenium
9 4 (2.67%) Visual Studio
10 3 (2.00%) Bitbucket
10 3 (2.00%) IBM UrbanCode
10 3 (2.00%) JUnit
10 3 (2.00%) Subversion
11 2 (1.33%) Gradle
11 2 (1.33%) Visual Studio Code
12 1 (0.67%) Artifactory
12 1 (0.67%) TestRail
12 1 (0.67%) Zephyr
General
1 68 (45.33%) Finance
2 60 (40.00%) Social Skills
3 42 (28.00%) Banking
4 15 (10.00%) Analytical Skills
5 13 (8.67%) Public Sector
6 7 (4.67%) Back Office
6 7 (4.67%) Manufacturing
6 7 (4.67%) Marketing
7 6 (4.00%) Electronics
7 6 (4.00%) Investment Banking
8 5 (3.33%) Advertising
8 5 (3.33%) Law
9 4 (2.67%) Organisational Skills
9 4 (2.67%) Retail
10 3 (2.00%) Retail Banking
11 2 (1.33%) Front Office
11 2 (1.33%) German Language
11 2 (1.33%) Italian Language
11 2 (1.33%) Legal
11 2 (1.33%) Publishing
Job Titles
1 29 (19.33%) Developer
2 27 (18.00%) Senior
2 27 (18.00%) Software Engineer
3 22 (14.67%) Analyst
4 14 (9.33%) DevOps Engineer
4 14 (9.33%) Senior Developer
5 13 (8.67%) Support Engineer
6 10 (6.67%) IT Engineer
6 10 (6.67%) IT Support
6 10 (6.67%) IT Support Engineer
7 8 (5.33%) Lead
7 8 (5.33%) Senior DevOps
7 8 (5.33%) Senior DevOps Engineer
8 6 (4.00%) Backend Developer
8 6 (4.00%) Business Analyst
8 6 (4.00%) Junior
8 6 (4.00%) Quality Engineer
8 6 (4.00%) Senior Backend Developer
8 6 (4.00%) Support Analyst
9 5 (3.33%) Senior Analyst
Libraries, Frameworks & Software Standards
1 19 (12.67%) Spring
2 17 (11.33%) Django
3 16 (10.67%) Node.js
4 15 (10.00%) Flask
4 15 (10.00%) React
5 10 (6.67%) 802.1X
5 10 (6.67%) RESTful
6 9 (6.00%) FastAPI
6 9 (6.00%) JSON
7 8 (5.33%) GraphQL
7 8 (5.33%) OAuth
8 7 (4.67%) Kafka
8 7 (4.67%) pytest
9 6 (4.00%) Keycloak
9 6 (4.00%) Lambda Expressions
9 6 (4.00%) REST
9 6 (4.00%) Spring Boot
9 6 (4.00%) SQLAlchemy
9 6 (4.00%) WebSockets
10 5 (3.33%) Playwright
Miscellaneous
1 23 (15.33%) Product Ownership
2 14 (9.33%) Management Information System
3 10 (6.67%) Onboarding
4 6 (4.00%) Molecular Biology
5 5 (3.33%) Analytical Mindset
5 5 (3.33%) IoT
6 4 (2.67%) Legacy Systems
6 4 (2.67%) Social Media
7 3 (2.00%) Algorithms
7 3 (2.00%) Enterprise Software
7 3 (2.00%) Foreign Exchange (FX)
7 3 (2.00%) Mainframe
7 3 (2.00%) Public Cloud
7 3 (2.00%) Virtual Team
8 2 (1.33%) Clustering
8 2 (1.33%) Data Centre
8 2 (1.33%) Greenfield Project
8 2 (1.33%) PDA
8 2 (1.33%) Replication
8 2 (1.33%) Wiki
Operating Systems
1 16 (10.67%) Linux
2 6 (4.00%) Unix
2 6 (4.00%) Windows
3 2 (1.33%) Debian
3 2 (1.33%) Solaris
3 2 (1.33%) Windows 10
4 1 (0.67%) CentOS
Processes & Methodologies
1 87 (58.00%) Agile
2 54 (36.00%) DevOps
3 35 (23.33%) Software Engineering
4 33 (22.00%) Mentoring
4 33 (22.00%) Scrum
5 30 (20.00%) Problem-Solving
6 24 (16.00%) SDLC
7 23 (15.33%) Microservices
8 20 (13.33%) CI/CD
9 19 (12.67%) Code Quality
10 18 (12.00%) Test Automation
11 17 (11.33%) TDD
12 14 (9.33%) Continuous Integration
13 13 (8.67%) Customer Service
14 12 (8.00%) Collaborative Working
14 12 (8.00%) Continuous Improvement
14 12 (8.00%) Cybersecurity
14 12 (8.00%) User Experience
15 11 (7.33%) Computer Science
15 11 (7.33%) Project Management
Programming Languages
1 38 (25.33%) Python
2 36 (24.00%) Java
3 31 (20.67%) SQL
4 12 (8.00%) JavaScript
4 12 (8.00%) TypeScript
5 7 (4.67%) Go
6 6 (4.00%) Bash
6 6 (4.00%) C#
7 5 (3.33%) Groovy
7 5 (3.33%) T-SQL
8 3 (2.00%) PowerShell
9 2 (1.33%) PHP
9 2 (1.33%) Ruby
10 1 (0.67%) Kotlin
10 1 (0.67%) Rust
Qualifications
1 12 (8.00%) BPSS Clearance
1 12 (8.00%) Degree
2 6 (4.00%) Security Cleared
3 3 (2.00%) OCP
3 3 (2.00%) Oracle Certification
3 3 (2.00%) PMI Certification
4 2 (1.33%) Computer Science Degree
4 2 (1.33%) PgMP
5 1 (0.67%) AWS Certified Cloud Practitioner
5 1 (0.67%) CBAP
5 1 (0.67%) Master's Degree
Quality Assurance & Compliance
1 6 (4.00%) Accessibility
1 6 (4.00%) QA
1 6 (4.00%) SLA
2 3 (2.00%) PMO
3 2 (1.33%) ISO/IEC 27001
4 1 (0.67%) Actionable Recommendations
4 1 (0.67%) Cyber Essentials
4 1 (0.67%) Data Quality
4 1 (0.67%) GDPR
4 1 (0.67%) HIPAA
4 1 (0.67%) NIST
4 1 (0.67%) PCI DSS
System Software
1 39 (26.00%) Docker
2 4 (2.67%) Active Directory
3 2 (1.33%) Hyper-V
3 2 (1.33%) KVM
3 2 (1.33%) NFS
3 2 (1.33%) SRDF
3 2 (1.33%) Veritas Cluster Server
3 2 (1.33%) VMware Infrastructure
3 2 (1.33%) Xen
Systems Management
1 39 (26.00%) Kubernetes
2 14 (9.33%) Terraform
3 11 (7.33%) Ansible
3 11 (7.33%) Prometheus
4 10 (6.67%) Grafana
5 9 (6.00%) Progress Chef
6 8 (5.33%) Puppet
7 7 (4.67%) Kustomize
8 4 (2.67%) Argo
9 3 (2.00%) Istio
10 2 (1.33%) Single Sign-On
11 1 (0.67%) Check_MK
11 1 (0.67%) FortiGate
11 1 (0.67%) Kibana
11 1 (0.67%) logstash
11 1 (0.67%) Opsgenie
11 1 (0.67%) ZABBIX
Vendors
1 21 (14.00%) Google
2 20 (13.33%) Microsoft
3 18 (12.00%) Atlassian
4 7 (4.67%) Oracle
5 6 (4.00%) Adobe
5 6 (4.00%) Salesforce
5 6 (4.00%) Sawtooth Software
6 5 (3.33%) Dynatrace
7 3 (2.00%) IBM
8 2 (1.33%) Cisco
8 2 (1.33%) Conga
8 2 (1.33%) Cribl.io
8 2 (1.33%) EMC
8 2 (1.33%) F5
8 2 (1.33%) Mercator
8 2 (1.33%) NetApp
8 2 (1.33%) Red Hat
8 2 (1.33%) VMware
9 1 (0.67%) OneLogin
9 1 (0.67%) Revolut