Microsoft Office Contracts with Hybrid/Remote/WFH Options

Microsoft Office
UK > Work from Home

The table below provides summary statistics for remote or hybrid contract work requiring Microsoft Office skills. It includes a benchmarking guide to the contractor rates offered in vacancies that cited Microsoft Office over the 6 months leading up to 9 May 2025, comparing them to the same period in the previous two years.

6 months to
9 May 2025
Same period 2024 Same period 2023
Rank 115 97 99
Rank change year-on-year -18 +2 +27
Contract jobs citing Microsoft Office 231 329 587
As % of all contract jobs with a WFH option 2.36% 2.18% 2.34%
As % of the Applications category 32.58% 28.76% 36.10%
Number of daily rates quoted 138 178 432
10th Percentile £204 £155 £181
25th Percentile £221 £201 £251
Median daily rate (50th Percentile) £400 £400 £428
Median % change year-on-year - -6.43% +14.69%
75th Percentile £538 £538 £591
90th Percentile £613 £650 £700
UK median daily rate £320 £263 £375
% change year-on-year +21.90% -30.00% +23.36%
Number of hourly rates quoted 29 83 37
10th Percentile £13.78 £13.04 £14.89
25th Percentile - £14.13 £21.25
Median hourly rate £14.20 £26.00 £50.00
Median % change year-on-year -45.38% -48.00% +132.56%
75th Percentile £21.00 £43.75 £67.50
90th Percentile £25.26 £51.25 £68.75
UK median hourly rate £16.83 £15.86 £22.63
% change year-on-year +6.17% -29.94% +33.67%

All Software Application Skills
Work from Home

Microsoft Office falls under the Software Applications category. For comparison with the information above, the following table provides summary statistics for all contract job vacancies with remote or hybrid options requiring software application skills.

Contract vacancies with a requirement for software application skills 709 1,144 1,626
As % of all contract jobs with a WFH option 7.26% 7.59% 6.48%
Number of daily rates quoted 441 499 1,117
10th Percentile £213 £183 £213
25th Percentile £281 £288 £349
Median daily rate (50th Percentile) £413 £425 £450
Median % change year-on-year -2.94% -5.56% -
75th Percentile £550 £550 £588
90th Percentile £650 £702 £700
UK median daily rate £413 £400 £425
% change year-on-year +3.13% -5.88% -1.16%
Number of hourly rates quoted 52 176 100
10th Percentile £14.00 £12.92 £16.00
25th Percentile £14.20 £15.48 £21.93
Median hourly rate £16.90 £35.52 £45.00
Median % change year-on-year -52.42% -21.06% +62.63%
75th Percentile £32.05 £57.50 £52.50
90th Percentile £63.06 £67.50 £68.75
UK median hourly rate £22.70 £17.50 £32.50
% change year-on-year +29.71% -46.15% +51.16%

Microsoft Office
Trend for Jobs with a WFH Option

Job vacancies with remote working options citing Microsoft Office as a proportion of all IT jobs advertised.
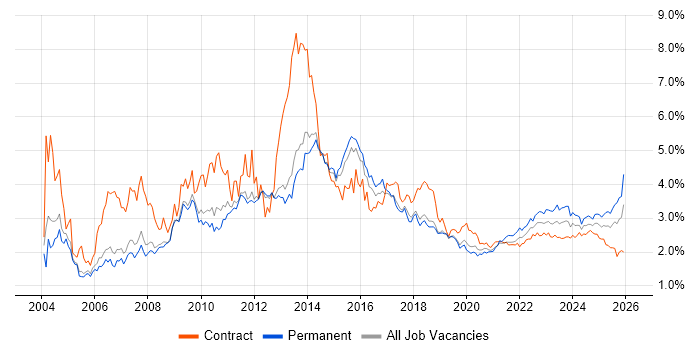
Microsoft Office trend for jobs with Hybrid/Remote/WFH options

Microsoft Office
Daily Rate Trend for Jobs with a WFH Option

3-month moving average daily rate quoted in job vacancies with remote working options citing Microsoft Office.

Microsoft Office daily rate for jobs with a WFH option

Microsoft Office
Daily Rate Histogram for Jobs with a WFH Option

Daily rate distribution for jobs with remote working options citing Microsoft Office over the 6 months to 9 May 2025.

Microsoft Office daily rate histogram for jobs with a WFH option

Microsoft Office
Hourly Rate Trend for Jobs with a WFH Option

3-month moving average hourly rate quoted in job vacancies with remote working options citing Microsoft Office.

Microsoft Office hourly rate for jobs with a WFH option

Microsoft Office
Hourly Rate Histogram for Jobs with a WFH Option

Hourly rate distribution for jobs with remote working options citing Microsoft Office over the 6 months to 9 May 2025.

Microsoft Office hourly rate histogram for jobs with a WFH option

Microsoft Office
Co-occurring Skills and Capabilities with WFH Options by Category

The follow tables expand on the table above by listing co-occurrences grouped by category. The same employment type, locality and period is covered with up to 20 co-occurrences shown in each of the following categories:

Application Platforms
1 32 (13.85%) Confluence
2 23 (9.96%) SharePoint
3 21 (9.09%) Microsoft Exchange
4 3 (1.30%) CMS
4 3 (1.30%) IBM Notes
5 2 (0.87%) Skype for Business
6 1 (0.43%) Apache Spark
6 1 (0.43%) MS Project Server
6 1 (0.43%) SAS
Applications
1 67 (29.00%) Microsoft Excel
2 38 (16.45%) Microsoft PowerPoint
3 13 (5.63%) MS Visio
4 10 (4.33%) Microsoft Project
5 4 (1.73%) Spreadsheet
6 1 (0.43%) Adobe Creative Suite
6 1 (0.43%) InfoPath
6 1 (0.43%) Revit
6 1 (0.43%) Trello
Business Applications
1 4 (1.73%) CA PPM
2 3 (1.30%) iTrent
2 3 (1.30%) SAP Retail
3 2 (0.87%) SAP CAR
3 2 (0.87%) SAP MDG
3 2 (0.87%) SAP MM
4 1 (0.43%) Actimize
4 1 (0.43%) Dynamics AX
4 1 (0.43%) Dynamics CRM
4 1 (0.43%) Remedy ITSM
4 1 (0.43%) SAP S/4HANA
Cloud Services
1 43 (18.61%) Microsoft 365
2 31 (13.42%) Azure
3 20 (8.66%) Power Platform
4 13 (5.63%) Entra ID
5 5 (2.16%) Azure DevOps
5 5 (2.16%) Yammer
6 4 (1.73%) Asana
6 4 (1.73%) IBM Blueworks
6 4 (1.73%) PowerApps
6 4 (1.73%) Slack
7 3 (1.30%) AWS
7 3 (1.30%) Google Docs
7 3 (1.30%) Google Sheets
7 3 (1.30%) Google Workspace
8 2 (0.87%) Dynamics 365
8 2 (0.87%) OneDrive
8 2 (0.87%) Power Automate
9 1 (0.43%) GCP
9 1 (0.43%) IaaS
9 1 (0.43%) SaaS
Communications & Networking
1 20 (8.66%) Firewall
2 14 (6.06%) VPN
3 13 (5.63%) Wireless
4 10 (4.33%) DNS
4 10 (4.33%) Internet
5 9 (3.90%) WAN
6 8 (3.46%) LAN
6 8 (3.46%) Remote Desktop
6 8 (3.46%) TCP/IP
7 7 (3.03%) Skype
8 6 (2.60%) DHCP
9 4 (1.73%) BGP
9 4 (1.73%) Network Security
9 4 (1.73%) OSPF
9 4 (1.73%) Unified Communications
10 3 (1.30%) 4G
10 3 (1.30%) Cisco Nexus
10 3 (1.30%) iSCSI
10 3 (1.30%) Radio Access Network
10 3 (1.30%) Wi-Fi
Database & Business Intelligence
1 19 (8.23%) Power BI
2 5 (2.16%) Relational Database
2 5 (2.16%) SQL Server
3 4 (1.73%) BusinessObjects
3 4 (1.73%) MS Access
4 2 (0.87%) Power Query
4 2 (0.87%) Tableau
5 1 (0.43%) BigQuery
5 1 (0.43%) Data Lake
5 1 (0.43%) Data Warehouse
5 1 (0.43%) DTS
5 1 (0.43%) GIS
5 1 (0.43%) Hadoop
5 1 (0.43%) Looker
5 1 (0.43%) PowerPivot
5 1 (0.43%) Qlik Sense
5 1 (0.43%) RDBMS
5 1 (0.43%) SQL Server Reporting Services
Development Applications
1 48 (20.78%) JIRA
2 14 (6.06%) Visual Studio
3 4 (1.73%) Git
3 4 (1.73%) Hudson
4 2 (0.87%) Sonatype Nexus
5 1 (0.43%) Bitbucket
5 1 (0.43%) Jenkins
General
1 136 (58.87%) Social Skills
2 74 (32.03%) Finance
3 50 (21.65%) Analytical Skills
4 33 (14.29%) Public Sector
5 19 (8.23%) Presentation Skills
6 18 (7.79%) Banking
7 17 (7.36%) Manufacturing
8 10 (4.33%) Inclusion and Diversity
9 9 (3.90%) Documentation Skills
9 9 (3.90%) Marketing
10 7 (3.03%) Organisational Skills
11 6 (2.60%) Retail
12 4 (1.73%) Arabic Language
12 4 (1.73%) Back Office
12 4 (1.73%) Czech Language
12 4 (1.73%) Telecoms
13 3 (1.30%) Electronics
13 3 (1.30%) Influencing Skills
13 3 (1.30%) Italian Language
13 3 (1.30%) Pharmaceutical
Job Titles
1 46 (19.91%) Analyst
2 18 (7.79%) IT Support
3 17 (7.36%) Developer
4 15 (6.49%) Administrator
4 15 (6.49%) Support Engineer
5 14 (6.06%) Delphi Developer
6 13 (5.63%) Help Desk Support
6 13 (5.63%) Project Manager
7 12 (5.19%) Senior
8 10 (4.33%) Business Analyst
8 10 (4.33%) IT Engineer
8 10 (4.33%) IT Support Engineer
8 10 (4.33%) Virtualisation Engineer
9 9 (3.90%) Service Analyst
9 9 (3.90%) Service Desk Analyst
9 9 (3.90%) Support Officer
10 8 (3.46%) 2nd Line Support
11 7 (3.03%) 1st Line Support
11 7 (3.03%) Consultant
11 7 (3.03%) Support Analyst
Libraries, Frameworks & Software Standards
1 10 (4.33%) Flash
2 4 (1.73%) Web Services
3 3 (1.30%) CSS
3 3 (1.30%) HTML
3 3 (1.30%) TensorFlow
4 2 (0.87%) REST
5 1 (0.43%) .NET
5 1 (0.43%) .NET Framework
5 1 (0.43%) ASP.NET
5 1 (0.43%) ASP.NET MVC
5 1 (0.43%) Bootstrap
5 1 (0.43%) Elastic Stack
5 1 (0.43%) Entity Framework
5 1 (0.43%) HTML5 Canvas
5 1 (0.43%) jQuery
5 1 (0.43%) React
5 1 (0.43%) SailPoint
Miscellaneous
1 13 (5.63%) Management Information System
1 13 (5.63%) Onboarding
2 10 (4.33%) Clustering
3 8 (3.46%) Data Centre
3 8 (3.46%) PMI
4 7 (3.03%) Driving Licence
4 7 (3.03%) PKI
4 7 (3.03%) Self-Motivation
5 4 (1.73%) Greenfield Project
5 4 (1.73%) Video Conferencing
6 3 (1.30%) Data Protection Act
6 3 (1.30%) Data Structures
6 3 (1.30%) Digital Media
6 3 (1.30%) IVR
6 3 (1.30%) Learning Management System
6 3 (1.30%) Reference Data
6 3 (1.30%) Social Media
7 2 (0.87%) Analytical Mindset
7 2 (0.87%) Life Science
7 2 (0.87%) Renewable Energy
Operating Systems
1 67 (29.00%) Windows
2 28 (12.12%) Windows 10
3 13 (5.63%) Windows Server
4 6 (2.60%) Linux
5 5 (2.16%) Android
5 5 (2.16%) Windows Server 2016
6 4 (1.73%) Mac OS
6 4 (1.73%) Windows Server 2012
7 3 (1.30%) VMS
8 2 (0.87%) Unix
9 1 (0.43%) Apple iOS
9 1 (0.43%) Windows 7
Processes & Methodologies
1 84 (36.36%) Problem-Solving
2 46 (19.91%) Agile
3 35 (15.15%) Service Management
4 34 (14.72%) ITIL
5 30 (12.99%) Stakeholder Management
6 25 (10.82%) Collaborative Working
7 22 (9.52%) Project Management
8 21 (9.09%) Time Management
9 20 (8.66%) Customer Service
10 18 (7.79%) Decision-Making
11 17 (7.36%) Business Intelligence
11 17 (7.36%) Change Management
11 17 (7.36%) Infrastructure Engineering
11 17 (7.36%) ITSM
12 15 (6.49%) Computer Science
12 15 (6.49%) Functional Testing
12 15 (6.49%) NsoIT
12 15 (6.49%) Programme Management
12 15 (6.49%) Root Cause Analysis
12 15 (6.49%) System Testing
Programming Languages
1 33 (14.29%) SQL
2 15 (6.49%) C#
3 14 (6.06%) Delphi
3 14 (6.06%) PL/SQL
4 13 (5.63%) PowerShell
5 9 (3.90%) Python
6 5 (2.16%) VBA
7 4 (1.73%) JavaScript
8 1 (0.43%) Groovy
8 1 (0.43%) R
Qualifications
1 52 (22.51%) Degree
2 43 (18.61%) Security Cleared
3 39 (16.88%) SC Cleared
4 15 (6.49%) Cisco Certification
4 15 (6.49%) DV Cleared
5 13 (5.63%) Master's Degree
6 12 (5.19%) CCNA
7 11 (4.76%) VMware Certified Professional (VCP)
8 10 (4.33%) PMI Certification
9 6 (2.60%) Microsoft Certification
10 5 (2.16%) CCNP
10 5 (2.16%) MCSE
11 4 (1.73%) Computer Science Degree
12 3 (1.30%) PMP
13 2 (0.87%) CISA
13 2 (0.87%) CISM
13 2 (0.87%) CISSP
13 2 (0.87%) HNC
13 2 (0.87%) JNCIA
13 2 (0.87%) PRINCE2 Certification
Quality Assurance & Compliance
1 17 (7.36%) PMO
2 12 (5.19%) SLA
3 6 (2.60%) Accessibility
4 4 (1.73%) GDPR
5 3 (1.30%) Data Quality
5 3 (1.30%) NIST
5 3 (1.30%) QA
5 3 (1.30%) Sarbanes-Oxley
5 3 (1.30%) SOC 2
6 2 (0.87%) NIST 800
7 1 (0.43%) Actionable Recommendations
7 1 (0.43%) Cyber Essentials
7 1 (0.43%) NCSC
System Software
1 33 (14.29%) Active Directory
2 13 (5.63%) VMware Infrastructure
3 11 (4.76%) VMware NSX
4 10 (4.33%) VMware ESXi
5 5 (2.16%) Microsoft Virtual Server
5 5 (2.16%) Virtual Servers
6 3 (1.30%) Docker
7 2 (0.87%) Hyper-V
7 2 (0.87%) Virtual Desktop
8 1 (0.43%) Virtual Machines
8 1 (0.43%) vSphere
Systems Management
1 11 (4.76%) vCenter Server
2 9 (3.90%) Microsoft Intune
2 9 (3.90%) WSUS
3 3 (1.30%) Ansible
3 3 (1.30%) FortiGate
3 3 (1.30%) Terraform
4 2 (0.87%) SCCM
5 1 (0.43%) HP Quality Center
5 1 (0.43%) NSN NetAct
5 1 (0.43%) PaperCut
5 1 (0.43%) PowerCLI
Vendors
1 173 (74.89%) Microsoft
2 17 (7.36%) Cisco
2 17 (7.36%) Oracle
3 15 (6.49%) Atlassian
3 15 (6.49%) VMware
4 13 (5.63%) SAP
5 12 (5.19%) ServiceNow
6 8 (3.46%) Palo Alto
7 6 (2.60%) Apple
8 4 (1.73%) Broadcom
8 4 (1.73%) Zscaler
9 3 (1.30%) Google
9 3 (1.30%) IFS
9 3 (1.30%) Juniper
9 3 (1.30%) Lotus
9 3 (1.30%) Nokia
9 3 (1.30%) Veeam
9 3 (1.30%) Xero
10 2 (0.87%) Citrix
10 2 (0.87%) Ericsson