Service Design Jobs in the UK excluding London

Service Design
UK > UK excluding London

The following table provides summary statistics for permanent job vacancies advertised in the UK excluding London with a requirement for Service Design skills. Included is a benchmarking guide to the salaries offered in vacancies that have cited Service Design over the 6 months to 11 May 2024 with a comparison to the same period in the previous 2 years.

6 months to
11 May 2024
Same period 2023 Same period 2022
Rank 381 363 232
Rank change year-on-year -18 -131 +193
Permanent jobs citing Service Design 433 483 1,145
As % of all permanent jobs advertised in the UK excluding London 0.61% 0.81% 1.61%
As % of the Processes & Methodologies category 0.73% 0.84% 1.71%
Number of salaries quoted 166 210 426
10th Percentile £38,792 £41,250 £37,600
25th Percentile £46,063 £45,813 £45,000
Median annual salary (50th Percentile) £55,000 £58,816 £55,000
Median % change year-on-year -6.49% +6.94% +4.76%
75th Percentile £62,500 £77,500 £67,500
90th Percentile £71,625 £100,612 £75,000
UK median annual salary £58,800 £60,000 £60,000
% change year-on-year -2.00% - -

All Process and Methodology Skills
UK excluding London

Service Design is in the Processes and Methodologies category. The following table is for comparison with the above and provides summary statistics for all permanent job vacancies advertised in the UK excluding London with a requirement for process or methodology skills.

Permanent vacancies with a requirement for process or methodology skills 59,616 57,236 66,838
As % of all permanent jobs advertised in the UK excluding London 83.97% 95.60% 94.08%
Number of salaries quoted 41,251 29,494 41,057
10th Percentile £27,250 £30,500 £30,000
25th Percentile £36,250 £40,000 £38,750
Median annual salary (50th Percentile) £50,000 £55,000 £52,500
Median % change year-on-year -9.09% +4.76% +10.53%
75th Percentile £65,000 £70,000 £67,500
90th Percentile £77,500 £82,500 £80,000
UK median annual salary £55,000 £61,000 £60,000
% change year-on-year -9.84% +1.67% +9.09%

Service Design
Job Vacancy Trend in the UK excluding London

Job postings citing Service Design as a proportion of all IT jobs advertised in the UK excluding London.
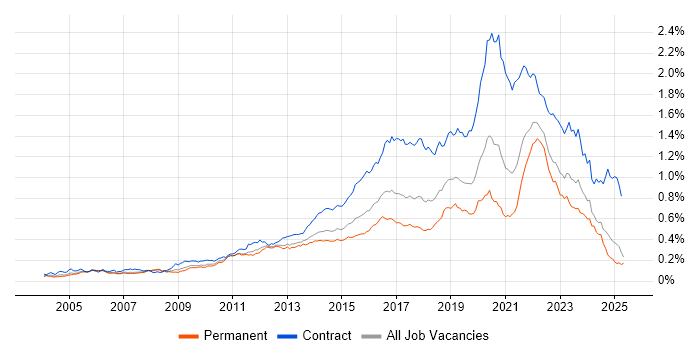
Job vacancy trend for Service Design in the UK excluding London

Service Design
Salary Trend in the UK excluding London

3-month moving average salary quoted in jobs citing Service Design in the UK excluding London.

Salary trend for Service Design in the UK excluding London

Service Design
Salary Histogram in the UK excluding London

Salary distribution for jobs citing Service Design in the UK excluding London over the 6 months to 11 May 2024.

Salary histogram for Service Design in the UK excluding London

Service Design
Job Locations in the UK excluding London

The table below looks at the demand and provides a guide to the median salaries quoted in IT jobs citing Service Design within the UK excluding London region over the 6 months to 11 May 2024. The 'Rank Change' column provides an indication of the change in demand within each location based on the same 6 month period last year.

Location Rank Change
on Same Period
Last Year
Matching
Permanent
IT Job Ads
Median Salary
Past 6 Months
Median Salary
% Change
on Same Period
Last Year
Live
Jobs
North of England +52 111 £57,965 +5.62% 26
Scotland -2 102 £54,395 -38.85% 8
South West -40 69 £55,000 -10.20% 10
North West +35 65 £62,888 +14.59% 12
South East -57 59 £50,000 -4.76% 10
Midlands -39 43 £57,500 -5.35% 15
Yorkshire +62 29 £57,965 -0.94% 8
West Midlands -14 29 £57,965 -4.59% 12
East of England +13 26 £42,500 -15.00% 7
North East 0 17 £57,965 +25.76% 7
East Midlands -25 14 £35,000 -44.00% 3
Wales -8 13 £47,000 -21.67% 5
Northern Ireland +30 10 £58,800 - 2
Service Design
UK

Service Design
Co-occurring Skills and Capabilities in the UK excluding London by Category

The follow tables expand on the table above by listing co-occurrences grouped by category. The same employment type, locality and period is covered with up to 20 co-occurrences shown in each of the following categories:

Application Platforms
1 18 (4.16%) Microsoft Exchange
2 8 (1.85%) CMS
3 4 (0.92%) SharePoint
4 1 (0.23%) Jetty
4 1 (0.23%) SAS
Applications
1 32 (7.39%) UserZoom
2 26 (6.00%) Microsoft Office
3 11 (2.54%) Microsoft Excel
4 10 (2.31%) Microsoft PowerPoint
5 7 (1.62%) Spreadsheet
6 6 (1.39%) Trello
7 5 (1.15%) Sketch
8 4 (0.92%) Microsoft Project
8 4 (0.92%) MS Visio
9 3 (0.69%) Chatbot
10 2 (0.46%) Adobe XD
11 1 (0.23%) InVision
11 1 (0.23%) Zeplin
Business Applications
1 4 (0.92%) ResourceLink
2 3 (0.69%) Dynamics NAV
2 3 (0.69%) Salesforce CRM
Cloud Services
1 69 (15.94%) Figma
2 64 (14.78%) SurveyMonkey
3 48 (11.09%) Azure
4 42 (9.70%) Microsoft 365
5 20 (4.62%) AWS
6 17 (3.93%) SaaS
7 16 (3.70%) Power Platform
8 9 (2.08%) PowerApps
9 6 (1.39%) dbt
10 5 (1.15%) Azure DevOps
10 5 (1.15%) Dynamics 365
10 5 (1.15%) Power Automate
11 4 (0.92%) AWS CloudFormation
12 3 (0.69%) Adobe Creative Cloud
12 3 (0.69%) Miro
13 1 (0.23%) Amazon ECS
13 1 (0.23%) Azure AKS
13 1 (0.23%) GitHub
13 1 (0.23%) IaaS
13 1 (0.23%) OneDrive
Communications & Networking
1 17 (3.93%) WAN
2 13 (3.00%) MPLS
2 13 (3.00%) SD-WAN
3 10 (2.31%) VoIP
4 6 (1.39%) Firewall
5 5 (1.15%) NAS
5 5 (1.15%) SAN
6 4 (0.92%) BGP
6 4 (0.92%) DHCP
6 4 (0.92%) DNS
6 4 (0.92%) LAN
6 4 (0.92%) Wi-Fi
7 1 (0.23%) VSAT
Database & Business Intelligence
1 10 (2.31%) Power BI
2 8 (1.85%) Big Data
3 7 (1.62%) Relational Database
3 7 (1.62%) Tableau
4 6 (1.39%) Snowflake Schema
4 6 (1.39%) SQL Server
4 6 (1.39%) Star Schema
5 4 (0.92%) BusinessObjects
5 4 (0.92%) MySQL
6 1 (0.23%) Data Mining
6 1 (0.23%) DB2
Development Applications
1 34 (7.85%) Jenkins
2 6 (1.39%) JIRA
3 4 (0.92%) Visual Studio
4 1 (0.23%) Axure RP
4 1 (0.23%) GitLab
General
1 154 (35.57%) Social Skills
2 122 (28.18%) Finance
3 99 (22.86%) Inclusion and Diversity
3 99 (22.86%) Law
4 84 (19.40%) Marketing
4 84 (19.40%) Public Sector
5 39 (9.01%) Legal
6 32 (7.39%) Social Science
7 21 (4.85%) Analytical Skills
7 21 (4.85%) Retail
8 17 (3.93%) Banking
9 16 (3.70%) Investment Banking
10 12 (2.77%) Presentation Skills
11 7 (1.62%) Financial Institution
12 6 (1.39%) Influencing Skills
13 5 (1.15%) Tech for Good
14 4 (0.92%) Fire and Rescue
14 4 (0.92%) French Language
14 4 (0.92%) German Language
14 4 (0.92%) Police
Job Titles
1 91 (21.02%) Architect
2 69 (15.94%) Designer
2 69 (15.94%) Lead
3 62 (14.32%) Senior
4 43 (9.93%) User Experience Researcher
5 34 (7.85%) Service Architect
6 32 (7.39%) Analyst
7 29 (6.70%) ITSM Architect
8 28 (6.47%) Service Designer
9 26 (6.00%) Interaction Designer
10 23 (5.31%) Senior Designer
11 21 (4.85%) Consultant
12 20 (4.62%) Senior Interaction Designer
12 20 (4.62%) Service Manager
12 20 (4.62%) Systems Architect
13 18 (4.16%) Senior Consultant
14 17 (3.93%) Head of Design
15 16 (3.70%) Solutions Architect
15 16 (3.70%) Systems Engineer
16 14 (3.23%) Technical Architect
Libraries, Frameworks & Software Standards
1 19 (4.39%) HTML
2 9 (2.08%) CSS
2 9 (2.08%) React
3 8 (1.85%) Web Services
4 6 (1.39%) EDI
4 6 (1.39%) IDoc
5 5 (1.15%) Middleware
6 4 (0.92%) .NET
6 4 (0.92%) XML
6 4 (0.92%) XSLT
7 3 (0.69%) .NET Framework
7 3 (0.69%) ADO
7 3 (0.69%) Entity Framework
8 1 (0.23%) AngularJS
8 1 (0.23%) Apache CXF
8 1 (0.23%) Mustache
8 1 (0.23%) Node.js
8 1 (0.23%) RESTful
8 1 (0.23%) Spring
8 1 (0.23%) Spring Boot
Miscellaneous
1 48 (11.09%) Management Information System
2 32 (7.39%) Product Ownership
3 27 (6.24%) Market Risk
4 16 (3.70%) Onboarding
5 15 (3.46%) Data Structures
6 12 (2.77%) Algorithms
6 12 (2.77%) NHS
7 10 (2.31%) Data Centre
8 8 (1.85%) Operational Technology
9 7 (1.62%) Self-Motivation
10 5 (1.15%) Enterprise Software
10 5 (1.15%) Low-Code
11 4 (0.92%) Enterprise Cloud
11 4 (0.92%) Fat Client
11 4 (0.92%) Thin Client
11 4 (0.92%) Virtual Team
12 3 (0.69%) Cloud Native
12 3 (0.69%) Educational Technology
12 3 (0.69%) PMI
12 3 (0.69%) Video Conferencing
Operating Systems
1 37 (8.55%) Windows
2 30 (6.93%) Windows Server
3 9 (2.08%) Windows Server 2016
4 4 (0.92%) Linux
5 3 (0.69%) Windows 10
6 2 (0.46%) Windows 7
6 2 (0.46%) Windows 8
7 1 (0.23%) zOS
Processes & Methodologies
1 180 (41.57%) Actionable Insight
2 161 (37.18%) User Experience
3 154 (35.57%) Agile
4 132 (30.48%) User Research
5 119 (27.48%) ITIL
6 109 (25.17%) Project Management
7 102 (23.56%) Service Delivery
8 99 (22.86%) Roadmaps
9 92 (21.25%) Product Management
10 84 (19.40%) UX Research
11 81 (18.71%) Interaction Design
11 81 (18.71%) Mentoring
12 77 (17.78%) Analytics
13 75 (17.32%) Anthropology
13 75 (17.32%) Psychology
14 74 (17.09%) Service Management
15 72 (16.63%) User-Centered Design (UCD)
16 69 (15.94%) Problem-Solving
16 69 (15.94%) Prototyping
17 68 (15.70%) Visualisation
Programming Languages
1 39 (9.01%) R
2 24 (5.54%) SQL
3 11 (2.54%) T-SQL
4 10 (2.31%) JavaScript
5 8 (1.85%) PowerShell
6 7 (1.62%) Python
7 4 (0.92%) C#
7 4 (0.92%) C++
7 4 (0.92%) VB
8 1 (0.23%) Go
8 1 (0.23%) Java
Qualifications
1 172 (39.72%) Degree
2 124 (28.64%) Security Cleared
3 74 (17.09%) SC Cleared
4 56 (12.93%) Master's Degree
5 43 (9.93%) PhD
6 22 (5.08%) Microsoft Certification
7 14 (3.23%) Cisco Certification
8 10 (2.31%) CCNA
8 10 (2.31%) MCSE
9 9 (2.08%) Computer Science Degree
10 7 (1.62%) IIBA
10 7 (1.62%) MBA
11 6 (1.39%) BPSS Clearance
12 4 (0.92%) AWS Certification
12 4 (0.92%) CCDP
12 4 (0.92%) CCNP
12 4 (0.92%) CCSP
12 4 (0.92%) ITIL Foundation Certificate
12 4 (0.92%) PMI Certification
12 4 (0.92%) TOGAF Certification
Quality Assurance & Compliance
1 66 (15.24%) Accessibility
2 33 (7.62%) Actionable Recommendations
3 28 (6.47%) WCAG
4 9 (2.08%) QA
5 8 (1.85%) Sarbanes-Oxley
6 6 (1.39%) SLA
7 2 (0.46%) ISO/IEC 20000
8 1 (0.23%) GDPR
8 1 (0.23%) ISO/IEC 27001
8 1 (0.23%) PMO
System Software
1 33 (7.62%) Active Directory
2 13 (3.00%) Hyper-V
3 6 (1.39%) VMware Infrastructure
4 5 (1.15%) Docker
5 4 (0.92%) Virtual Desktop
6 2 (0.46%) vSphere
Systems Management
1 16 (3.70%) Microsoft Intune
2 6 (1.39%) Terraform
3 4 (0.92%) Ansible
4 3 (0.69%) HAProxy
5 2 (0.46%) Kubernetes
5 2 (0.46%) SCCM
Vendors
1 64 (14.78%) Microsoft
1 64 (14.78%) Qualtrics
2 13 (3.00%) Meraki
3 7 (1.62%) Cisco
3 7 (1.62%) VMware
4 6 (1.39%) OpenText
4 6 (1.39%) SAP
5 5 (1.15%) Automation Anywhere
5 5 (1.15%) iManage
6 4 (0.92%) Adobe
6 4 (0.92%) Citrix
6 4 (0.92%) Computacenter
6 4 (0.92%) NetApp
6 4 (0.92%) Oracle
7 3 (0.69%) Salesforce
7 3 (0.69%) Workday
8 1 (0.23%) Atlassian