Business Strategy Jobs in the UK excluding London

Business Strategy
UK > UK excluding London

The table below provides summary statistics for permanent job vacancies advertised in the UK excluding London requiring Business Strategy skills. It includes a benchmarking guide to the annual salaries offered in vacancies that cited Business Strategy over the 6 months leading up to 30 May 2025, comparing them to the same period in the previous two years.

6 months to
30 May 2025
Same period 2024 Same period 2023
Rank 170 180 179
Rank change year-on-year +10 -1 -12
Permanent jobs citing Business Strategy 746 1,128 1,163
As % of all permanent jobs advertised in the UK excluding London 1.89% 1.51% 2.00%
As % of the Processes & Methodologies category 2.04% 1.84% 2.10%
Number of salaries quoted 265 649 521
10th Percentile £40,000 £35,000 £34,250
25th Percentile £48,894 £45,000 £42,500
Median annual salary (50th Percentile) £62,500 £58,700 £60,000
Median % change year-on-year +6.47% -2.17% +6.37%
75th Percentile £72,500 £76,250 £80,000
90th Percentile £90,000 £92,500 £95,000
UK median annual salary £65,000 £62,500 £67,925
% change year-on-year +4.00% -7.99% +4.50%

All Process and Methodology Skills
UK excluding London

Business Strategy falls under the Processes and Methodologies category. For comparison with the information above, the following table provides summary statistics for all permanent job vacancies requiring process or methodology skills in the UK excluding London.

Permanent vacancies with a requirement for process or methodology skills 36,483 61,419 55,450
As % of all permanent jobs advertised in the UK excluding London 92.65% 82.37% 95.58%
Number of salaries quoted 17,392 42,187 28,711
10th Percentile £26,250 £27,250 £30,500
25th Percentile £36,750 £36,250 £40,000
Median annual salary (50th Percentile) £51,574 £50,000 £55,000
Median % change year-on-year +3.15% -9.09% +4.76%
75th Percentile £65,000 £65,000 £70,000
90th Percentile £77,500 £77,500 £82,500
UK median annual salary £57,443 £55,000 £60,899
% change year-on-year +4.44% -9.69% +1.50%

Business Strategy
Job Vacancy Trend in the UK excluding London

Job postings citing Business Strategy as a proportion of all IT jobs advertised in the UK excluding London.
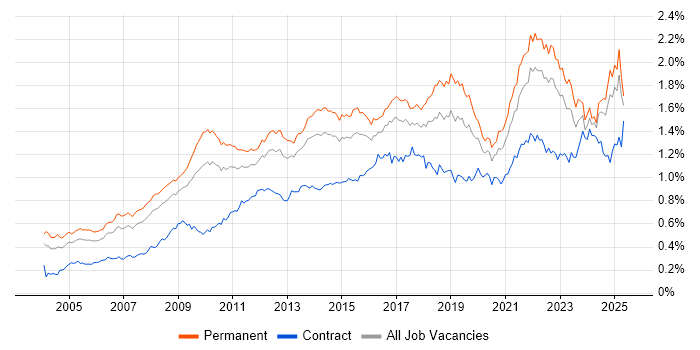
Job vacancy trend for Business Strategy in the UK excluding London

Business Strategy
Salary Trend in the UK excluding London

3-month moving average salary quoted in jobs citing Business Strategy in the UK excluding London.

Salary trend for Business Strategy in the UK excluding London

Business Strategy
Salary Histogram in the UK excluding London

Salary distribution for jobs citing Business Strategy in the UK excluding London over the 6 months to 30 May 2025.

Salary histogram for Business Strategy in the UK excluding London

Business Strategy
Job Locations in the UK excluding London

The table below looks at the demand and provides a guide to the median salaries quoted in IT jobs citing Business Strategy within the UK excluding London region over the 6 months to 30 May 2025. The 'Rank Change' column provides an indication of the change in demand within each location based on the same 6 month period last year.

Location Rank Change
on Same Period
Last Year
Matching
Permanent
IT Job Ads
Median Salary
Past 6 Months
Median Salary
% Change
on Same Period
Last Year
Live
Jobs
North of England -5 260 £57,836 +0.58% 608
North West -1 202 £57,560 +0.10% 286
South East +21 158 £65,500 +13.91% 911
East of England +121 146 £54,250 -1.36% 401
Midlands +3 76 £63,500 +8.18% 551
South West +1 53 £65,000 +4.00% 325
Yorkshire +2 49 £65,000 +4.00% 248
West Midlands +4 46 £67,500 +17.39% 297
Scotland +36 44 £70,000 +41.41% 145
East Midlands +9 29 £63,500 +1.60% 219
Wales +33 7 £75,000 +71.33% 67
North East +21 7 £58,750 +6.82% 75
Northern Ireland +34 3 - - 39
Business Strategy
UK

Business Strategy
Co-occurring Skills and Capabilities in the UK excluding London by Category

The follow tables expand on the table above by listing co-occurrences grouped by category. The same employment type, locality and period is covered with up to 20 co-occurrences shown in each of the following categories:

Application Platforms
1 80 (10.72%) Confluence
2 41 (5.50%) SharePoint
3 8 (1.07%) Apache Spark
4 4 (0.54%) IIS
5 3 (0.40%) Microsoft Exchange
6 2 (0.27%) OpenStack
6 2 (0.27%) WordPress
7 1 (0.13%) Apache Airflow
7 1 (0.13%) CMS
7 1 (0.13%) Kentico
7 1 (0.13%) Moodle
7 1 (0.13%) Oracle Workflow
7 1 (0.13%) SAS
7 1 (0.13%) Totara
7 1 (0.13%) Umbraco
Applications
1 30 (4.02%) Microsoft PowerPoint
2 9 (1.21%) Microsoft Excel
2 9 (1.21%) Microsoft Office
3 5 (0.67%) Microsoft Project
4 2 (0.27%) Adobe Creative Suite
4 2 (0.27%) Adobe Illustrator
4 2 (0.27%) Photoshop
5 1 (0.13%) Siemens NX
Business Applications
1 8 (1.07%) SAP S/4HANA
2 5 (0.67%) Dynamics AX
2 5 (0.67%) Dynamics CRM
3 3 (0.40%) Sage 200
4 2 (0.27%) Academy Revenues and Benefits
5 1 (0.13%) iTrent
5 1 (0.13%) Oracle EBS
5 1 (0.13%) Oracle EBS R12
5 1 (0.13%) Oracle ERP
5 1 (0.13%) Oracle Procure-to-Pay
5 1 (0.13%) SAP CO
5 1 (0.13%) SAP FI
5 1 (0.13%) SAP FI/CO
5 1 (0.13%) SAP GRC
5 1 (0.13%) SAP SCM
5 1 (0.13%) SAP SD
5 1 (0.13%) SAP WM
5 1 (0.13%) Teamcenter
Cloud Services
1 73 (9.79%) Azure
2 62 (8.31%) Power Platform
3 39 (5.23%) SaaS
4 34 (4.56%) AWS
5 28 (3.75%) Power Automate
6 27 (3.62%) PowerApps
7 25 (3.35%) Microsoft 365
8 21 (2.82%) Salesforce Sales Cloud
9 11 (1.47%) Entra ID
10 9 (1.21%) Azure Logic Apps
11 8 (1.07%) Amazon SageMaker
11 8 (1.07%) Azure Data Factory
11 8 (1.07%) Azure DevOps
11 8 (1.07%) Dynamics 365
12 6 (0.80%) Boomi
12 6 (0.80%) GCP
13 5 (0.67%) GitHub
13 5 (0.67%) Salesforce Commerce Cloud
13 5 (0.67%) SAP Commerce Cloud
13 5 (0.67%) Snowflake
Communications & Networking
1 12 (1.61%) LAN
1 12 (1.61%) WAN
2 8 (1.07%) VoIP
3 7 (0.94%) Network Security
4 6 (0.80%) Unified Communications
5 5 (0.67%) IP Telephony
6 4 (0.54%) Firewall
6 4 (0.54%) MPLS
7 3 (0.40%) BGP
7 3 (0.40%) DNS
7 3 (0.40%) OSPF
8 2 (0.27%) DHCP
8 2 (0.27%) TCP/IP
8 2 (0.27%) VLAN
8 2 (0.27%) WPA
9 1 (0.13%) Broadband
9 1 (0.13%) Cisco ASA
9 1 (0.13%) HSRP
9 1 (0.13%) PuTTY
9 1 (0.13%) WLAN
Database & Business Intelligence
1 56 (7.51%) Power BI
2 40 (5.36%) Tableau
3 37 (4.96%) Big Data
4 27 (3.62%) Data Lake
5 8 (1.07%) Azure SQL Database
6 7 (0.94%) NoSQL
6 7 (0.94%) SQL Server Integration Services
7 6 (0.80%) BusinessObjects
7 6 (0.80%) Data Warehouse
7 6 (0.80%) SQL Server
8 5 (0.67%) SQL Server Reporting Services
9 4 (0.54%) Amazon Athena
9 4 (0.54%) Metadata
9 4 (0.54%) MongoDB
9 4 (0.54%) PostgreSQL
9 4 (0.54%) Spark SQL
10 3 (0.40%) Electronic Patient Records
10 3 (0.40%) Parquet
11 2 (0.27%) Metadata Repository
11 2 (0.27%) Oracle Reports
Development Applications
1 82 (10.99%) JIRA
2 8 (1.07%) Git
3 3 (0.40%) GitLab
4 1 (0.13%) Burp Suite
4 1 (0.13%) Metasploit
4 1 (0.13%) Oracle Forms
4 1 (0.13%) Visual Studio
General
1 273 (36.60%) Social Skills
2 236 (31.64%) Finance
3 118 (15.82%) Manufacturing
4 105 (14.08%) Law
5 98 (13.14%) Marketing
6 92 (12.33%) Analytical Skills
7 80 (10.72%) Inclusion and Diversity
8 50 (6.70%) Presentation Skills
9 44 (5.90%) Banking
10 36 (4.83%) Public Sector
11 33 (4.42%) Electronics
12 32 (4.29%) Retail
13 31 (4.16%) German Language
14 30 (4.02%) Financial Institution
14 30 (4.02%) Influencing Skills
15 29 (3.89%) French Language
16 28 (3.75%) Legal
17 16 (2.14%) Documentation Skills
18 15 (2.01%) Organisational Skills
19 14 (1.88%) Telecoms
Job Titles
1 158 (21.18%) Lead
2 154 (20.64%) Architect
3 118 (15.82%) Business Manager
4 90 (12.06%) Development Manager
5 85 (11.39%) Solutions Architect
6 83 (11.13%) Business Development Manager
7 64 (8.58%) Analyst
7 64 (8.58%) Lead Architect
8 58 (7.77%) Lead Solutions Architect
9 57 (7.64%) Enterprise Architect
10 51 (6.84%) Senior
11 30 (4.02%) Credit Analyst
12 29 (3.89%) Research Analyst
13 27 (3.62%) Product Manager
14 24 (3.22%) Operations Manager
15 22 (2.95%) Business Relationship Manager
15 22 (2.95%) Relationships Manager
16 21 (2.82%) Salesforce Architect
17 18 (2.41%) IT Manager
18 16 (2.14%) Business Analyst
Libraries, Frameworks & Software Standards
1 25 (3.35%) REST
2 24 (3.22%) Lightning Web Components
3 23 (3.08%) Middleware
4 22 (2.95%) SOAP
5 6 (0.80%) .NET
5 6 (0.80%) EDI
6 5 (0.67%) GraphQL
6 5 (0.67%) Kafka
6 5 (0.67%) PySpark
6 5 (0.67%) RESTful
6 5 (0.67%) Spring
6 5 (0.67%) Spring Boot
7 3 (0.40%) .NET Framework
7 3 (0.40%) ARM Templates
7 3 (0.40%) XGBoost
8 2 (0.27%) ASP.NET
8 2 (0.27%) CSS
8 2 (0.27%) CSS3
8 2 (0.27%) HTML5
8 2 (0.27%) Web Services
Miscellaneous
1 67 (8.98%) Management Information System
2 39 (5.23%) Product Ownership
3 38 (5.09%) Enterprise Software
4 37 (4.96%) FMCG
5 30 (4.02%) Credit Risk
6 29 (3.89%) Fixed Income
7 27 (3.62%) Data Centre
8 21 (2.82%) PMI
8 21 (2.82%) Self-Motivation
9 16 (2.14%) Hybrid Cloud
10 13 (1.74%) Algorithms
11 12 (1.61%) Renewable Energy
11 12 (1.61%) Social Media
12 11 (1.47%) SCADA
13 7 (0.94%) Public Cloud
14 6 (0.80%) Marketing Technology
14 6 (0.80%) Onboarding
14 6 (0.80%) Operational Technology
14 6 (0.80%) Private Cloud
15 4 (0.54%) Driving Licence
Operating Systems
1 9 (1.21%) Windows
2 7 (0.94%) Windows Vista
3 2 (0.27%) Android
3 2 (0.27%) Apple iOS
4 1 (0.13%) Unix
4 1 (0.13%) Windows Server
Processes & Methodologies
1 222 (29.76%) Agile
2 170 (22.79%) Roadmaps
3 158 (21.18%) Stakeholder Management
4 125 (16.76%) Business Development
5 124 (16.62%) Analytics
6 121 (16.22%) Decision-Making
7 117 (15.68%) Enterprise Architecture
8 107 (14.34%) Continuous Improvement
9 98 (13.14%) Project Management
10 90 (12.06%) Risk Management
11 87 (11.66%) Business Enablement
12 84 (11.26%) ERP
13 81 (10.86%) Data Analysis
14 80 (10.72%) Customer Service
15 75 (10.05%) Business Intelligence
15 75 (10.05%) Problem-Solving
16 74 (9.92%) Mentoring
17 70 (9.38%) Data Governance
18 69 (9.25%) Data Management
19 64 (8.58%) Data Science
Programming Languages
1 43 (5.76%) SQL
2 30 (4.02%) Python
3 23 (3.08%) Java
4 21 (2.82%) Apex Code
5 15 (2.01%) C
6 5 (0.67%) JavaScript
7 4 (0.54%) PHP
8 3 (0.40%) C#
8 3 (0.40%) PowerShell
9 2 (0.27%) VB.NET
10 1 (0.13%) Bash
10 1 (0.13%) PROC SQL
10 1 (0.13%) R
10 1 (0.13%) TypeScript
Qualifications
1 220 (29.49%) Degree
2 109 (14.61%) BPSS Clearance
3 67 (8.98%) Master's Degree
4 32 (4.29%) HND
5 31 (4.16%) CFA
6 24 (3.22%) Computer Science Degree
7 23 (3.08%) DBS Check
7 23 (3.08%) PMI Certification
8 17 (2.28%) ACCA
9 16 (2.14%) Security Cleared
10 14 (1.88%) CIMA
10 14 (1.88%) PMP
11 12 (1.61%) CCAB
11 12 (1.61%) CIPFA
11 12 (1.61%) ICAEW
12 11 (1.47%) SC Cleared
13 10 (1.34%) Chartered Engineer
14 8 (1.07%) TOGAF Certification
15 7 (0.94%) AWS Certification
16 6 (0.80%) Azure Certification
Quality Assurance & Compliance
1 60 (8.04%) Data Quality
2 27 (3.62%) SLA
3 21 (2.82%) Accessibility
4 15 (2.01%) GDPR
5 10 (1.34%) California Consumer Privacy Act
6 7 (0.94%) QA
7 4 (0.54%) PCI DSS
8 3 (0.40%) Actionable Recommendations
8 3 (0.40%) IEC 61508
8 3 (0.40%) Sarbanes-Oxley
9 2 (0.27%) ISO/IEC 27001
9 2 (0.27%) NIST
10 1 (0.13%) Cyber Essentials
10 1 (0.13%) Cyber Essentials PLUS
10 1 (0.13%) ISO 14001
10 1 (0.13%) ISO 22301
10 1 (0.13%) ISO 9001
10 1 (0.13%) ITGC
10 1 (0.13%) NIST 800
10 1 (0.13%) PMO
System Software
1 17 (2.28%) Virtual Machines
2 4 (0.54%) Active Directory
3 2 (0.27%) VMware Infrastructure
4 1 (0.13%) Apache Flume
4 1 (0.13%) HDFS
4 1 (0.13%) Virtual Desktop
Systems Management
1 17 (2.28%) Terraform
2 11 (1.47%) Ansible
3 4 (0.54%) Cisco CUCM
4 3 (0.40%) Functional Safety
4 3 (0.40%) Jamf Pro
4 3 (0.40%) SCCM
5 2 (0.27%) Active Directory Federation Services
5 2 (0.27%) Microsoft Intune
6 1 (0.13%) EMC NetWorker
6 1 (0.13%) Kibana
6 1 (0.13%) logstash
6 1 (0.13%) Nessus
6 1 (0.13%) Oozie
Vendors
1 89 (11.93%) Microsoft
2 73 (9.79%) YouTube
3 71 (9.52%) SAP
4 59 (7.91%) Siemens
5 31 (4.16%) Salesforce
6 29 (3.89%) Bloomberg
6 29 (3.89%) ServiceNow
7 22 (2.95%) Cisco
8 21 (2.82%) Atlassian
8 21 (2.82%) Salesforce Marketing Cloud
9 19 (2.55%) Fortinet
9 19 (2.55%) Oracle
10 12 (1.61%) Palo Alto
11 11 (1.47%) Aruba
11 11 (1.47%) Facebook
11 11 (1.47%) Mellanox
11 11 (1.47%) NVIDIA
12 9 (1.21%) Informatica
12 9 (1.21%) Tenable
13 7 (0.94%) Databricks