Feasibility Studies
UK

The following table provides summary statistics for permanent job vacancies with a requirement for Feasibility Study skills. Included is a benchmarking guide to the salaries offered in vacancies that have cited Feasibility Study over the 6 months to 9 May 2024 with a comparison to the same period in the previous 2 years.

6 months to
9 May 2024
Same period 2023 Same period 2022
Rank 738 775 972
Rank change year-on-year +37 +197 -200
Permanent jobs citing Feasibility Study 164 198 257
As % of all permanent jobs advertised in the UK 0.17% 0.20% 0.16%
As % of the Processes & Methodologies category 0.19% 0.20% 0.17%
Number of salaries quoted 104 77 109
10th Percentile £34,254 £35,764 £44,500
25th Percentile £37,918 £43,750 £51,250
Median annual salary (50th Percentile) £73,750 £57,500 £60,000
Median % change year-on-year +28.26% -4.17% -
75th Percentile £84,964 £72,500 £80,000
90th Percentile - £86,000 £90,500
UK excluding London median annual salary £61,250 £50,000 £55,000
% change year-on-year +22.50% -9.09% -6.38%

All Process and Methodology Skills
UK

Feasibility Study is in the Processes and Methodologies category. The following table is for comparison with the above and provides summary statistics for all permanent job vacancies with a requirement for process or methodology skills.

Permanent vacancies with a requirement for process or methodology skills 84,809 96,894 150,102
As % of all permanent jobs advertised in the UK 85.57% 95.61% 95.67%
Number of salaries quoted 59,843 56,945 82,179
10th Percentile £29,000 £34,000 £33,500
25th Percentile £40,000 £45,000 £43,750
Median annual salary (50th Percentile) £55,000 £61,180 £60,000
Median % change year-on-year -10.10% +1.97% +9.09%
75th Percentile £72,500 £81,250 £80,000
90th Percentile £92,500 £100,000 £96,550
UK excluding London median annual salary £50,000 £55,000 £52,500
% change year-on-year -9.09% +4.76% +9.38%

Feasibility Study
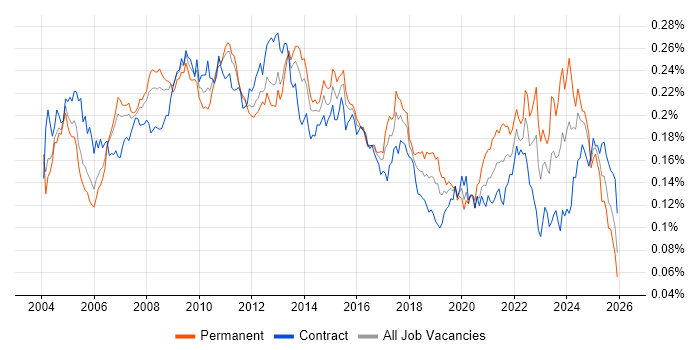
Job Vacancy Trend

Job postings citing Feasibility Study as a proportion of all IT jobs advertised.

Job vacancy trend for Feasibility Study in the UK

Feasibility Study
Salary Trend

3-month moving average salary quoted in jobs citing Feasibility Study.

Salary trend for Feasibility Study in the UK

Feasibility Study
Salary Histogram

Salary distribution for jobs citing Feasibility Study over the 6 months to 9 May 2024.

Salary histogram for Feasibility Study in the UK

Feasibility Study
Top 16 Job Locations

The table below looks at the demand and provides a guide to the median salaries quoted in IT jobs citing Feasibility Study within the UK over the 6 months to 9 May 2024. The 'Rank Change' column provides an indication of the change in demand within each location based on the same 6 month period last year.

Location Rank Change
on Same Period
Last Year
Matching
Permanent
IT Job Ads
Median Salary
Past 6 Months
Median Salary
% Change
on Same Period
Last Year
Live
Jobs
England +61 151 £65,000 +8.33% 93
UK excluding London +6 126 £61,250 +22.50% 71
Work from Home +126 80 £79,932 +33.22% 29
North of England +95 50 £79,932 +61.48% 14
London +91 31 £80,000 +18.52% 24
Midlands -14 29 £52,500 -28.57% 12
North East - 20 £40,000 - 3
West Midlands +10 19 £51,250 -30.27% 3
North West +23 18 £79,932 +61.48% 6
East of England -2 15 £75,000 +107.07% 17
South East -7 14 £80,000 +31.77% 21
Yorkshire - 12 £79,932 - 5
South West -30 11 £45,000 -25.00% 6
East Midlands -18 10 £52,500 - 9
Northern Ireland - 5 - -
Scotland -66 2 £80,000 +88.24% 7

Feasibility Study
Co-occurring Skills and Capabilities by Category

The follow tables expand on the table above by listing co-occurrences grouped by category. The same employment type, locality and period is covered with up to 20 co-occurrences shown in each of the following categories:

Applications
1 9 (5.49%) Microsoft Excel
1 9 (5.49%) Microsoft PowerPoint
2 6 (3.66%) Simulink
2 6 (3.66%) Stateflow
3 4 (2.44%) Microsoft Office
4 1 (0.61%) AutoCAD
4 1 (0.61%) Spreadsheet
Business Applications
1 4 (2.44%) Dynamics CRM
2 3 (1.83%) Sage 200
2 3 (1.83%) Sage 300 ERP
3 1 (0.61%) SAP ERP
3 1 (0.61%) SAP S/4HANA
Cloud Services
1 13 (7.93%) Azure
2 6 (3.66%) OCI
3 4 (2.44%) Azure DevOps
3 4 (2.44%) Dynamics 365
3 4 (2.44%) IaaS
3 4 (2.44%) PaaS
3 4 (2.44%) SaaS
4 3 (1.83%) Power Platform
5 2 (1.22%) AWS
Communications & Networking
1 9 (5.49%) Firewall
2 5 (3.05%) Wireless
3 4 (2.44%) 4G
4 2 (1.22%) 5G
4 2 (1.22%) LTE
5 1 (0.61%) Bluetooth
5 1 (0.61%) LoRaWAN
5 1 (0.61%) Modbus
5 1 (0.61%) MQTT
5 1 (0.61%) VSAN
5 1 (0.61%) ZigBee
Database & Business Intelligence
1 5 (3.05%) CockroachDB
2 3 (1.83%) Power BI
2 3 (1.83%) SQL Server Reporting Services
3 1 (0.61%) DTS
3 1 (0.61%) GIS
3 1 (0.61%) SQL Server
Development Applications
1 5 (3.05%) Jaeger
1 5 (3.05%) Jenkins
1 5 (3.05%) JIRA
1 5 (3.05%) Sonatype Nexus
2 1 (0.61%) Git
General
1 58 (35.37%) Social Skills
2 38 (23.17%) Inclusion and Diversity
3 27 (16.46%) Manufacturing
4 24 (14.63%) Analytical Skills
4 24 (14.63%) Finance
5 15 (9.15%) Retail
6 12 (7.32%) Public Sector
7 11 (6.71%) Police
8 9 (5.49%) Telecoms
9 6 (3.66%) Legal
10 5 (3.05%) Financial Institution
10 5 (3.05%) Law
10 5 (3.05%) Local Government
10 5 (3.05%) Marketing
10 5 (3.05%) Pharmaceutical
11 4 (2.44%) Electronics
11 4 (2.44%) Games
11 4 (2.44%) Organisational Skills
11 4 (2.44%) Presentation Skills
12 1 (0.61%) Influencing Skills
Job Titles
1 42 (25.61%) Senior
2 36 (21.95%) Lead
3 29 (17.68%) Technical Leader
4 22 (13.41%) Analyst
5 18 (10.98%) Architect
6 12 (7.32%) Business Analyst
7 11 (6.71%) Project Manager
8 10 (6.10%) Systems Engineer
9 7 (4.27%) Business Change Specialist
9 7 (4.27%) Business Process Specialist
9 7 (4.27%) Solutions Architect
10 6 (3.66%) Project Engineer
10 6 (3.66%) RF Design Engineer
10 6 (3.66%) RF Engineer
11 5 (3.05%) Business Process Analyst
11 5 (3.05%) Design Engineer
11 5 (3.05%) Developer
11 5 (3.05%) Process Analyst
11 5 (3.05%) Technical Analyst
11 5 (3.05%) Technical Business Analyst
Libraries, Frameworks & Software Standards
1 6 (3.66%) PyTorch
1 6 (3.66%) TensorFlow
2 5 (3.05%) Kafka
2 5 (3.05%) Middleware
2 5 (3.05%) OpenTelemetry
2 5 (3.05%) Spring Boot
3 3 (1.83%) XML
4 2 (1.22%) OpenCV
4 2 (1.22%) scikit-learn
5 1 (0.61%) Unreal Engine
5 1 (0.61%) Yocto
Miscellaneous
1 21 (12.80%) Driving Licence
2 15 (9.15%) Management Information System
3 7 (4.27%) Algorithms
4 5 (3.05%) Distributed Systems
4 5 (3.05%) FPGA
5 4 (2.44%) Enterprise Software
5 4 (2.44%) Robotics
6 3 (1.83%) Renewable Energy
7 2 (1.22%) Blog
7 2 (1.22%) EPoS
7 2 (1.22%) Fibre Optics
7 2 (1.22%) Self-Motivation
7 2 (1.22%) Social Media
8 1 (0.61%) CPLD
8 1 (0.61%) Device Driver
8 1 (0.61%) FMCG
8 1 (0.61%) IoT
8 1 (0.61%) State Machine
8 1 (0.61%) Virtual Team
Operating Systems
1 7 (4.27%) Linux
1 7 (4.27%) Windows
2 4 (2.44%) Windows Server
3 2 (1.22%) Windows Server 2008
4 1 (0.61%) Embedded Linux
4 1 (0.61%) Unix
4 1 (0.61%) Windows Embedded Compact
Processes & Methodologies
1 58 (35.37%) Agile
2 40 (24.39%) Mentoring
3 38 (23.17%) Roadmaps
4 37 (22.56%) Coaching
4 37 (22.56%) Project Delivery
5 35 (21.34%) Architectural Design
6 34 (20.73%) Open Source
7 33 (20.12%) Software Engineering
8 29 (17.68%) Product Roadmap
8 29 (17.68%) Re-Platforming
8 29 (17.68%) Strategic Thinking
9 27 (16.46%) Impact Assessments
9 27 (16.46%) Process Improvement
10 25 (15.24%) Project Management
11 20 (12.20%) Decision-Making
11 20 (12.20%) GAP Analysis
12 19 (11.59%) Problem-Solving
13 18 (10.98%) Six Sigma
14 17 (10.37%) Data Analysis
15 16 (9.76%) PRINCE2
Programming Languages
1 37 (22.56%) Python
2 31 (18.90%) C
2 31 (18.90%) C++
3 29 (17.68%) COBOL
3 29 (17.68%) Micro Focus COBOL
4 8 (4.88%) SQL
5 6 (3.66%) Java
5 6 (3.66%) MATLAB
6 4 (2.44%) JavaScript
7 1 (0.61%) Shell Script
Qualifications
1 46 (28.05%) Degree
2 20 (12.20%) Postgraduate
3 19 (11.59%) Security Cleared
4 12 (7.32%) APMP
4 12 (7.32%) SC Cleared
5 9 (5.49%) Master's Degree
6 6 (3.66%) PhD
6 6 (3.66%) PMI Certification
6 6 (3.66%) PMP
7 4 (2.44%) BPSS Clearance
8 3 (1.83%) Computer Science Degree
9 2 (1.22%) DBS Check
10 1 (0.61%) CCA
10 1 (0.61%) DV Cleared
Quality Assurance & Compliance
1 3 (1.83%) Data Quality
1 3 (1.83%) QA
2 2 (1.22%) GDPR
3 1 (0.61%) Actionable Recommendations
3 1 (0.61%) MISRA
3 1 (0.61%) MISRA C
3 1 (0.61%) SLA
System Software
1 5 (3.05%) Docker
1 5 (3.05%) Firmware
2 4 (2.44%) Active Directory
3 1 (0.61%) VMware Infrastructure
3 1 (0.61%) vSphere
Systems Management
1 9 (5.49%) Ansible
2 5 (3.05%) Kiali
2 5 (3.05%) Kubernetes
3 4 (2.44%) Terraform
4 1 (0.61%) VxRail
Vendors
1 29 (17.68%) Micro Focus
2 15 (9.15%) Microsoft
3 7 (4.27%) Oracle
4 6 (3.66%) OpenAI
5 5 (3.05%) AppDynamics
5 5 (3.05%) Google
5 5 (3.05%) Splunk
6 3 (1.83%) EMC
6 3 (1.83%) Sage
7 2 (1.22%) Ericsson
7 2 (1.22%) Salesforce
7 2 (1.22%) SAP
8 1 (0.61%) Alias
8 1 (0.61%) CA
8 1 (0.61%) Dell
8 1 (0.61%) Renesas
8 1 (0.61%) Samsung
8 1 (0.61%) VMware
8 1 (0.61%) Workday
8 1 (0.61%) Xilinx