Senior Architect
UK

The median Senior Architect salary in the UK is £85,500 per year according to job vacancies posted during the 6 months to 7 December 2023.

The first table below provides salary benchmarking and summary statistics including a comparison to same period in the previous 2 years.

6 months to
7 Dec 2023
Same period 2022 Same period 2021
Rank 418 481 552
Rank change year-on-year +63 +71 -11
Permanent jobs requiring a Senior Architect 344 783 645
As % of all permanent jobs advertised in the UK 0.65% 0.64% 0.50%
As % of the Job Titles category 0.68% 0.67% 0.53%
Number of salaries quoted 146 509 451
10th Percentile £59,441 £62,500 £62,500
25th Percentile £71,500 £72,000 £68,750
Median annual salary (50th Percentile) £85,500 £85,000 £85,000
Median % change year-on-year +0.59% - +3.03%
75th Percentile £100,000 £97,290 £100,000
90th Percentile £136,250 £107,500 £118,750
UK excluding London median annual salary £80,000 £80,000 £75,000
% change year-on-year - +6.67% +7.14%

All Permanent IT Job Vacancies
UK

The following table is for comparison with the above and includes summary statistics for all permanent IT job vacancies. Most job vacancies include a discernible job title that can be normalized. As such, the figures in the second row provide an indication of the number of permanent jobs in our overall sample.

Permanent vacancies in the UK with a recognized job title 50,561 117,203 121,950
% of permanent jobs with a recognized job title 95.43% 95.41% 95.16%
Number of salaries quoted 36,942 73,752 84,378
10th Percentile £31,250 £32,798 £32,125
25th Percentile £42,500 £45,000 £42,500
Median annual salary (50th Percentile) £60,000 £60,000 £57,500
Median % change year-on-year - +4.35% +4.55%
75th Percentile £80,000 £81,250 £77,500
90th Percentile £97,500 £98,750 £95,000
UK excluding London median annual salary £52,500 £52,500 £50,000
% change year-on-year - +5.00% +5.26%

Senior Architect
Job Vacancy Trend

Job postings that featured Senior Architect in the job title as a proportion of all IT jobs advertised.
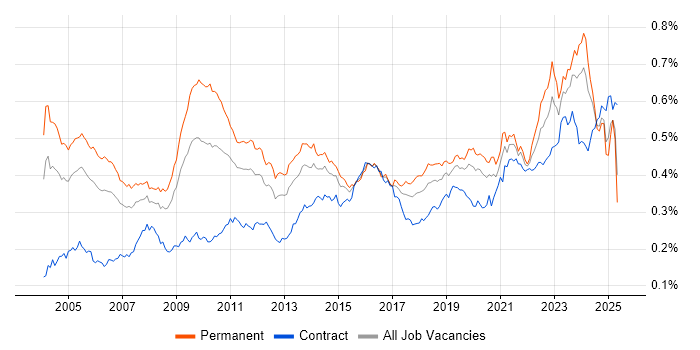
Job vacancy trend for Senior Architect in the UK

Senior Architect
Salary Trend

3-month moving average salary quoted in jobs citing Senior Architect.

Salary trend for Senior Architect in the UK

Senior Architect
Salary Histogram

Salary distribution for jobs citing Senior Architect over the 6 months to 7 December 2023.

Salary histogram for Senior Architect in the UK

Senior Architect
Top 17 Job Locations

The table below looks at the demand and provides a guide to the median salaries quoted in IT jobs citing Senior Architect within the UK over the 6 months to 7 December 2023. The 'Rank Change' column provides an indication of the change in demand within each location based on the same 6 month period last year.

Location Rank Change
on Same Period
Last Year
Matching
Permanent
IT Job Ads
Median Salary
Past 6 Months
Median Salary
% Change
on Same Period
Last Year
Live
Jobs
England +67 280 £87,500 +2.94% 138
UK excluding London +86 173 £80,000 - 71
London +139 146 £95,000 +5.56% 67
Work from Home +69 144 £73,000 -14.12% 80
North of England +144 42 £80,000 -4.59% 23
South East +52 29 £81,250 +1.56% 15
Scotland +37 26 £67,634 -28.24% 1
South West +28 26 £80,000 -10.95% 3
North West +132 25 £79,632 +2.75% 10
Midlands +69 21 £80,000 -4.48% 15
Yorkshire +94 18 £80,000 -5.88% 11
Wales +27 14 £85,000 -5.56% 7
East of England +102 13 - - 6
West Midlands +62 11 £80,000 - 13
East Midlands +58 10 - - 2
Northern Ireland - 10 £85,000 - 1
North East +42 1 £82,500 +13.79% 2

Senior Architect Skill Set
Top 30 Co-occurring Skills and Capabilities

For the 6 months to 7 December 2023, Senior Architect job roles required the following skills and capabilities in order of popularity. The figures indicate the absolute number co-occurrences and as a proportion of all permanent job ads featuring Senior Architect in the job title.

1 155 (45.06%) Azure
2 143 (41.57%) Agile
3 127 (36.92%) AWS
4 115 (33.43%) Actionable Insight
5 108 (31.40%) Enterprise Architecture
6 99 (28.78%) Presales
7 95 (27.62%) TOGAF
8 91 (26.45%) Roadmaps
9 82 (23.84%) Scrum
9 82 (23.84%) Cloud Native
10 80 (23.26%) Data Warehouse
11 78 (22.67%) Scaled Agile Framework
12 76 (22.09%) Business Case
13 75 (21.80%) Design Patterns
13 75 (21.80%) Software Delivery
14 72 (20.93%) Data Structures
14 72 (20.93%) TOGAF Certification
14 72 (20.93%) Conceptual Models
15 70 (20.35%) Finance
15 70 (20.35%) Degree
16 69 (20.06%) Mentoring
17 68 (19.77%) Social Skills
18 62 (18.02%) Microsoft
19 60 (17.44%) Stakeholder Management
20 58 (16.86%) IT Strategy
21 56 (16.28%) Customer Engagement
22 45 (13.08%) Project Management
23 44 (12.79%) Requirements Gathering
24 43 (12.50%) Artificial Intelligence
25 42 (12.21%) Retail

Senior Architect Skill Set
Co-occurring Skills and Capabilities by Category

The follow tables expand on the table above by listing co-occurrences grouped by category. The same employment type, locality and period is covered with up to 20 co-occurrences shown in each of the following categories:

Application Platforms
1 11 (3.20%) Apache Spark
2 4 (1.16%) CMS
3 1 (0.29%) Kentico
Applications
1 1 (0.29%) AutoCAD
1 1 (0.29%) Microsoft Office
1 1 (0.29%) SketchUp
Business Applications
1 11 (3.20%) Oracle EBS
2 4 (1.16%) Cerner Millennium
3 2 (0.58%) Dynamics CRM
3 2 (0.58%) SAP IBP
3 2 (0.58%) SAP S/4HANA
Cloud Services
1 155 (45.06%) Azure
2 127 (36.92%) AWS
3 24 (6.98%) GCP
4 19 (5.52%) SaaS
5 18 (5.23%) Entra ID
6 15 (4.36%) Microsoft 365
7 10 (2.91%) AWS CodePipeline
7 10 (2.91%) IaaS
7 10 (2.91%) PaaS
7 10 (2.91%) Sentry
8 9 (2.62%) AWS CloudFormation
9 7 (2.03%) Azure Data Factory
9 7 (2.03%) Serverless
10 4 (1.16%) Azure Functions
10 4 (1.16%) Azure Logic Apps
10 4 (1.16%) Cloud Computing
11 3 (0.87%) OpenShift
11 3 (0.87%) Oracle CX
11 3 (0.87%) Power Platform
12 2 (0.58%) SuccessFactors
Communications & Networking
1 16 (4.65%) DHCP
2 14 (4.07%) SAN
3 13 (3.78%) DNS
3 13 (3.78%) TCP/IP
4 8 (2.33%) HTTP
5 5 (1.45%) BGP
5 5 (1.45%) LAN
5 5 (1.45%) MPLS
6 4 (1.16%) Firewall
6 4 (1.16%) IPsec
6 4 (1.16%) Network Security
6 4 (1.16%) WAN
7 3 (0.87%) Cisco IOS
7 3 (0.87%) HSRP
7 3 (0.87%) Junos
7 3 (0.87%) NX-OS
7 3 (0.87%) OSPF
7 3 (0.87%) SSL
7 3 (0.87%) VLAN
7 3 (0.87%) VRRP
Database & Business Intelligence
1 80 (23.26%) Data Warehouse
2 13 (3.78%) Elasticsearch
3 12 (3.49%) Big Data
3 12 (3.49%) Hadoop
3 12 (3.49%) Metadata
4 11 (3.20%) Apache Ignite
4 11 (3.20%) Data Mining
5 10 (2.91%) Data Lake
6 7 (2.03%) Metadata Repository
7 6 (1.74%) SQL Server
8 5 (1.45%) Electronic Patient Records
8 5 (1.45%) OLAP
9 4 (1.16%) BigQuery
9 4 (1.16%) OLTP
10 3 (0.87%) Enterprise Data Warehouse
11 2 (0.58%) Amazon Redshift
11 2 (0.58%) MongoDB
12 1 (0.29%) Apache Cassandra
12 1 (0.29%) Azure SQL Database
12 1 (0.29%) Tableau
Development Applications
1 10 (2.91%) CircleCI
2 4 (1.16%) ERwin
3 1 (0.29%) GitLab
3 1 (0.29%) JIRA
General
1 70 (20.35%) Finance
2 68 (19.77%) Social Skills
3 42 (12.21%) Retail
4 34 (9.88%) Analytical Skills
5 28 (8.14%) Inclusion and Diversity
6 27 (7.85%) Presentation Skills
7 21 (6.10%) Public Sector
8 16 (4.65%) Organisational Skills
9 14 (4.07%) Marketing
10 13 (3.78%) Influencing Skills
11 12 (3.49%) Telecoms
12 10 (2.91%) Automotive
12 10 (2.91%) Pharmaceutical
13 9 (2.62%) Banking
14 5 (1.45%) Legal
15 4 (1.16%) Documentation Skills
15 4 (1.16%) Local Government
16 3 (0.87%) Law
17 2 (0.58%) Retail Banking
18 1 (0.29%) Private Banking
Libraries, Frameworks & Software Standards
1 21 (6.10%) Node.js
2 15 (4.36%) Kafka
3 11 (3.20%) .NET
3 11 (3.20%) HTML
4 10 (2.91%) React
5 9 (2.62%) OpenID
5 9 (2.62%) SAML
6 4 (1.16%) FHIR
7 3 (0.87%) Spring
7 3 (0.87%) Spring Boot
8 2 (0.58%) FIX Protocol
8 2 (0.58%) HTML5
8 2 (0.58%) JSON
8 2 (0.58%) Middleware
8 2 (0.58%) RESTful
8 2 (0.58%) Web Services
9 1 (0.29%) ASP.NET
9 1 (0.29%) LAMP
9 1 (0.29%) SOAP
9 1 (0.29%) XML
Miscellaneous
1 82 (23.84%) Cloud Native
2 72 (20.93%) Data Structures
3 13 (3.78%) Embedded Systems
3 13 (3.78%) Enterprise Software
3 13 (3.78%) Mali
3 13 (3.78%) Virtual Team
4 12 (3.49%) Cyberattack
5 6 (1.74%) Product Ownership
5 6 (1.74%) Self-Motivation
6 5 (1.45%) IoT
7 4 (1.16%) Clustering
7 4 (1.16%) Data Centre
7 4 (1.16%) Mobile App
7 4 (1.16%) NHS
7 4 (1.16%) Public Cloud
7 4 (1.16%) Reinsurance
7 4 (1.16%) Smart City
8 3 (0.87%) Management Information System
8 3 (0.87%) Robotics
8 3 (0.87%) Taxonomies
Operating Systems
1 31 (9.01%) Linux
2 18 (5.23%) Windows
3 13 (3.78%) Android
4 5 (1.45%) Windows Server
5 1 (0.29%) Unix
Processes & Methodologies
1 143 (41.57%) Agile
2 115 (33.43%) Actionable Insight
3 108 (31.40%) Enterprise Architecture
4 99 (28.78%) Presales
5 95 (27.62%) TOGAF
6 91 (26.45%) Roadmaps
7 82 (23.84%) Scrum
8 78 (22.67%) Scaled Agile Framework
9 76 (22.09%) Business Case
10 75 (21.80%) Design Patterns
10 75 (21.80%) Software Delivery
11 72 (20.93%) Conceptual Models
12 69 (20.06%) Mentoring
13 60 (17.44%) Stakeholder Management
14 58 (16.86%) IT Strategy
15 56 (16.28%) Customer Engagement
16 45 (13.08%) Project Management
17 44 (12.79%) Requirements Gathering
18 43 (12.50%) Artificial Intelligence
19 40 (11.63%) Technical Leadership
Programming Languages
1 24 (6.98%) C#
2 19 (5.52%) JavaScript
2 19 (5.52%) SQL
3 15 (4.36%) Java
4 13 (3.78%) C
4 13 (3.78%) C++
5 10 (2.91%) PL/SQL
6 9 (2.62%) Python
6 9 (2.62%) TypeScript
7 4 (1.16%) PowerShell
8 3 (0.87%) Perl
9 2 (0.58%) Go
9 2 (0.58%) Rust
10 1 (0.29%) Bash
Qualifications
1 72 (20.93%) TOGAF Certification
2 70 (20.35%) Degree
3 27 (7.85%) Security Cleared
4 24 (6.98%) AWS Certification
5 17 (4.94%) Master's Degree
6 12 (3.49%) DV Cleared
6 12 (3.49%) SC Cleared
7 11 (3.20%) AWS Certified Solutions Architect
8 10 (2.91%) MBA
9 7 (2.03%) Microsoft Certification
10 5 (1.45%) Computer Science Degree
11 4 (1.16%) Azure Certification
11 4 (1.16%) MCSA
12 3 (0.87%) CCIE
12 3 (0.87%) Cisco Certification
12 3 (0.87%) JNCIE
13 2 (0.58%) AWS Certified Cloud Practitioner
13 2 (0.58%) AWS Certified Developer
13 2 (0.58%) BPSS Clearance
14 1 (0.29%) AWS Certified DevOps Engineer
Quality Assurance & Compliance
1 21 (6.10%) QA
2 7 (2.03%) Data Quality
3 4 (1.16%) HL7
4 3 (0.87%) SEPA
5 2 (0.58%) SLA
6 1 (0.29%) NCSC
6 1 (0.29%) NIST
System Software
1 18 (5.23%) Docker
2 14 (4.07%) Active Directory
3 13 (3.78%) Embedded Firmware
3 13 (3.78%) Firmware
4 4 (1.16%) Hyper-V
4 4 (1.16%) VMware Infrastructure
5 2 (0.58%) KVM
5 2 (0.58%) Squid
5 2 (0.58%) VMware ESXi
6 1 (0.29%) Apache ZooKeeper
6 1 (0.29%) RACF
Systems Management
1 22 (6.40%) Kubernetes
2 11 (3.20%) Terraform
3 10 (2.91%) Grafana
3 10 (2.91%) Kibana
3 10 (2.91%) Prometheus
4 5 (1.45%) SCCM
5 2 (0.58%) Ansible
5 2 (0.58%) Endace
5 2 (0.58%) Nagios
5 2 (0.58%) Puppet
5 2 (0.58%) vCenter Server
5 2 (0.58%) vRealize
6 1 (0.29%) FortiGate
6 1 (0.29%) Single Sign-On
6 1 (0.29%) WMI
Vendors
1 62 (18.02%) Microsoft
2 16 (4.65%) Oracle
3 15 (4.36%) Dell
4 11 (3.20%) Google
5 8 (2.33%) SAP
6 7 (2.03%) Informatica
7 6 (1.74%) Cisco
7 6 (1.74%) Databricks
7 6 (1.74%) Juniper
7 6 (1.74%) VMware
8 5 (1.45%) Salesforce
9 4 (1.16%) Cerner
9 4 (1.16%) TOWER Software
10 3 (0.87%) MuleSoft
10 3 (0.87%) Teradata
11 2 (0.58%) ArcSight
11 2 (0.58%) F5
11 2 (0.58%) LogRhythm
11 2 (0.58%) Splunk
11 2 (0.58%) Veeam