Microsoft Excel Jobs

Microsoft Excel
UK

The table below provides summary statistics for permanent job vacancies requiring Microsoft Excel skills. It includes a benchmarking guide to the annual salaries offered in vacancies that cited Microsoft Excel over the 6 months leading up to 30 April 2025, comparing them to the same period in the previous two years.

6 months to
30 Apr 2025
Same period 2024 Same period 2023
Rank 75 54 86
Rank change year-on-year -21 +32 +48
Permanent jobs citing Microsoft Excel 1,806 4,368 3,902
As % of all permanent jobs advertised in the UK 3.46% 4.44% 3.75%
As % of the Applications category 28.22% 44.63% 42.56%
Number of salaries quoted 1,008 2,248 1,934
10th Percentile £26,500 £25,000 £26,250
25th Percentile £32,500 £28,500 £31,250
Median annual salary (50th Percentile) £47,000 £40,000 £44,447
Median % change year-on-year +17.50% -10.01% -1.23%
75th Percentile £57,500 £53,750 £59,787
90th Percentile £72,500 £67,500 £72,500
UK excluding London median annual salary £42,500 £36,750 £36,975
% change year-on-year +15.65% -0.61% -7.56%

All Software Application Skills
UK

Microsoft Excel falls under the Software Applications category. For comparison with the information above, the following table provides summary statistics for all permanent job vacancies requiring software application skills.

Permanent vacancies with a requirement for software application skills 6,399 9,787 9,168
As % of all permanent jobs advertised in the UK 12.27% 9.95% 8.82%
Number of salaries quoted 3,206 6,127 4,993
10th Percentile £27,750 £24,500 £25,750
25th Percentile £37,500 £27,847 £31,250
Median annual salary (50th Percentile) £50,000 £37,500 £44,666
Median % change year-on-year +33.33% -16.04% -0.74%
75th Percentile £60,265 £53,250 £60,000
90th Percentile £68,432 £67,500 £77,500
UK excluding London median annual salary £49,000 £35,000 £37,500
% change year-on-year +40.00% -6.67% -4.63%

Microsoft Excel
Job Vacancy Trend

Job postings citing Microsoft Excel as a proportion of all IT jobs advertised.
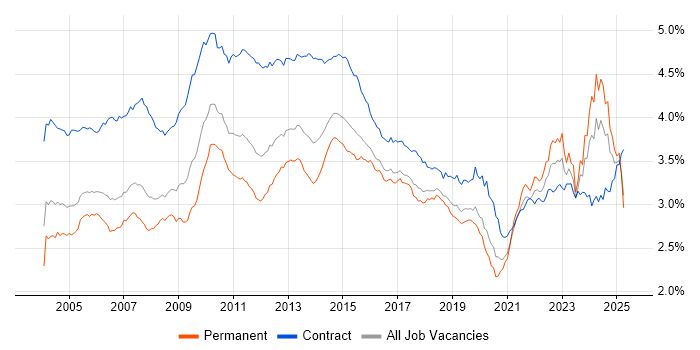
Job vacancy trend for Microsoft Excel in the UK

Microsoft Excel
Salary Trend

3-month moving average salary quoted in jobs citing Microsoft Excel.

Salary trend for Microsoft Excel in the UK

Microsoft Excel
Salary Histogram

Salary distribution for jobs citing Microsoft Excel over the 6 months to 30 April 2025.

Salary histogram for Microsoft Excel in the UK

Microsoft Excel
Top 18 Job Locations

The table below looks at the demand and provides a guide to the median salaries quoted in IT jobs citing Microsoft Excel within the UK over the 6 months to 30 April 2025. The 'Rank Change' column provides an indication of the change in demand within each location based on the same 6 month period last year.

Location Rank Change
on Same Period
Last Year
Matching
Permanent
IT Job Ads
Median Salary
Past 6 Months
Median Salary
% Change
on Same Period
Last Year
Live
Jobs
England -22 1,611 £47,000 +17.50% 2,113
UK excluding London -21 1,183 £42,500 +15.65% 1,130
London -34 509 £55,000 +0.78% 1,064
Work from Home -34 477 £44,827 +1.88% 879
North of England +17 464 £47,000 +40.02% 303
North West +6 385 £50,055 +43.01% 174
Midlands -32 249 £37,500 - 212
South East -87 197 £35,000 -16.67% 318
West Midlands -23 182 £37,500 -6.25% 117
South West +6 93 £44,730 +19.28% 97
East of England -45 88 £43,000 +32.31% 129
Scotland +32 77 £52,000 +38.40% 43
East Midlands -34 67 £36,250 +14.17% 91
Yorkshire +11 65 £35,000 - 102
North East +13 14 £39,550 +31.83% 30
Northern Ireland +29 11 - - 26
Wales -34 4 £50,000 +75.44% 29
Isle of Man +4 1 £31,000 -31.11%

Microsoft Excel
Co-occurring Skills and Capabilities by Category

The follow tables expand on the table above by listing co-occurrences grouped by category. The same employment type, locality and period is covered with up to 20 co-occurrences shown in each of the following categories:

Application Platforms
1 106 (5.87%) SharePoint
2 52 (2.88%) Confluence
3 37 (2.05%) Microsoft Exchange
4 29 (1.61%) CMS
5 17 (0.94%) SAS
6 13 (0.72%) IBM Domino
7 12 (0.66%) WordPress
8 9 (0.50%) Apache Spark
9 8 (0.44%) Kinematics
10 7 (0.39%) Sitecore CMS
11 5 (0.28%) Jupyter
12 3 (0.17%) Apache Airflow
12 3 (0.17%) nginx
13 2 (0.11%) Mule
14 1 (0.055%) MTS
14 1 (0.055%) Skype for Business
Applications
1 718 (39.76%) Microsoft Office
2 618 (34.22%) Microsoft PowerPoint
3 97 (5.37%) Microsoft Project
4 81 (4.49%) MS Visio
5 34 (1.88%) Spreadsheet
6 11 (0.61%) SOLIDWORKS
7 10 (0.55%) Photoshop
8 7 (0.39%) Trello
9 6 (0.33%) InDesign
10 5 (0.28%) Adobe Illustrator
11 4 (0.22%) SPSS
12 3 (0.17%) Adobe Creative Suite
12 3 (0.17%) Adobe Premiere
13 2 (0.11%) AutoCAD
14 1 (0.055%) Acrobat
14 1 (0.055%) Camtasia
14 1 (0.055%) EPLAN
14 1 (0.055%) Siemens NX
14 1 (0.055%) Sketch
14 1 (0.055%) Stata
Business Applications
1 151 (8.36%) Teamcenter
2 15 (0.83%) Dynamics CRM
3 14 (0.78%) Dynamics NAV
4 9 (0.50%) Raiser’s Edge
4 9 (0.50%) SAP S/4HANA
5 7 (0.39%) Dynamics GP
5 7 (0.39%) iTrent
6 6 (0.33%) Infor SunSystems
7 5 (0.28%) Markit EDM
7 5 (0.28%) SAP GTS
8 4 (0.22%) Maximo
8 4 (0.22%) Relativity
8 4 (0.22%) Ringtail
8 4 (0.22%) Veritas eDiscovery
9 3 (0.17%) CA PPM
9 3 (0.17%) Oracle EBS
10 2 (0.11%) NEC Housing
10 2 (0.11%) Oracle Payables
10 2 (0.11%) Oracle Receivables
10 2 (0.11%) Sage 200
Cloud Services
1 384 (21.26%) Power Platform
2 137 (7.59%) Microsoft 365
3 132 (7.31%) Azure
4 53 (2.93%) Google Analytics
5 46 (2.55%) SaaS
6 37 (2.05%) AWS
7 35 (1.94%) Entra ID
8 34 (1.88%) Dynamics 365
9 29 (1.61%) Google Sheets
10 27 (1.50%) Google Ads
11 24 (1.33%) Google Workspace
11 24 (1.33%) Power Automate
12 20 (1.11%) Snowflake
13 18 (1.00%) Azure Data Factory
14 17 (0.94%) Smartsheet
15 16 (0.89%) Azure DevOps
16 15 (0.83%) GCP
16 15 (0.83%) PowerApps
17 14 (0.78%) Azure Synapse Analytics
18 13 (0.72%) OneDrive
Communications & Networking
1 45 (2.49%) Firewall
2 35 (1.94%) DNS
3 33 (1.83%) DHCP
4 24 (1.33%) VLAN
5 23 (1.27%) TCP/IP
6 17 (0.94%) Intranet
7 16 (0.89%) BGP
7 16 (0.89%) OSPF
7 16 (0.89%) WLAN
8 15 (0.83%) Internet
9 13 (0.72%) LAN
10 11 (0.61%) Structured Cabling
10 11 (0.61%) Wi-Fi
11 9 (0.50%) PBX
11 9 (0.50%) SAN
12 8 (0.44%) Cisco IOS
12 8 (0.44%) FTP
12 8 (0.44%) IPv4
12 8 (0.44%) SMTP
13 7 (0.39%) Network Security
Database & Business Intelligence
1 381 (21.10%) Power BI
2 131 (7.25%) Tableau
3 49 (2.71%) Relational Database
4 44 (2.44%) Power Query
4 44 (2.44%) SQL Server
5 38 (2.10%) Data Warehouse
6 31 (1.72%) MS Access
7 28 (1.55%) SQL Server Reporting Services
8 25 (1.38%) Big Data
9 19 (1.05%) SQL Server Integration Services
10 17 (0.94%) Data Lake
11 15 (0.83%) GIS
11 15 (0.83%) Oracle Reports
12 13 (0.72%) Metadata
13 12 (0.66%) BusinessObjects
14 11 (0.61%) Data Mining
15 10 (0.55%) MySQL
16 9 (0.50%) PowerPivot
17 8 (0.44%) Amazon RDS
17 8 (0.44%) Metadata Repository
Development Applications
1 112 (6.20%) JIRA
2 12 (0.66%) Git
3 7 (0.39%) NDoc
4 6 (0.33%) Visual Studio
5 5 (0.28%) SoapUI
5 5 (0.28%) SQL Server Management Studio (SSMS)
6 4 (0.22%) Balsamiq
6 4 (0.22%) GitLab
6 4 (0.22%) Postman
7 3 (0.17%) Selenium
7 3 (0.17%) Subversion
8 2 (0.11%) Maven
8 2 (0.11%) MSI
9 1 (0.055%) Bitbucket
9 1 (0.055%) ClearCase
9 1 (0.055%) ClearQuest
9 1 (0.055%) LabVIEW
9 1 (0.055%) Rational DOORS
9 1 (0.055%) RStudio
9 1 (0.055%) Team Foundation Server
General
1 938 (51.94%) Social Skills
2 567 (31.40%) Finance
3 415 (22.98%) Analytical Skills
4 189 (10.47%) Marketing
5 176 (9.75%) Automotive
6 172 (9.52%) Aerospace
7 144 (7.97%) Presentation Skills
8 141 (7.81%) Organisational Skills
9 104 (5.76%) Inclusion and Diversity
10 102 (5.65%) Legal
11 96 (5.32%) Retail
12 65 (3.60%) Banking
13 62 (3.43%) Law
14 59 (3.27%) Public Sector
15 58 (3.21%) Manufacturing
16 55 (3.05%) Telecoms
17 45 (2.49%) Advertising
18 24 (1.33%) Local Government
19 23 (1.27%) Billing
19 23 (1.27%) Influencing Skills
Job Titles
1 486 (26.91%) Analyst
2 169 (9.36%) Systems Engineer
3 164 (9.08%) Senior
4 132 (7.31%) Project Manager
5 126 (6.98%) Data Analyst
6 74 (4.10%) Graduate
7 72 (3.99%) Financial Analyst
8 67 (3.71%) Administrator
9 60 (3.32%) Support Analyst
10 54 (2.99%) Consultant
10 54 (2.99%) Lead
11 50 (2.77%) Business Analyst
12 49 (2.71%) Developer
13 47 (2.60%) IT Support
14 46 (2.55%) Senior Analyst
15 42 (2.33%) Assistant Project Manager
15 42 (2.33%) Senior Manager
16 36 (1.99%) IT Analyst
17 35 (1.94%) Senior Project Manager
18 33 (1.83%) Support Specialist
Libraries, Frameworks & Software Standards
1 22 (1.22%) .NET
2 19 (1.05%) XML
3 12 (0.66%) EDI
3 12 (0.66%) Pandas
4 11 (0.61%) HTML
5 9 (0.50%) JSON
6 6 (0.33%) .NET Framework
6 6 (0.33%) CSS
6 6 (0.33%) FIX Protocol
7 5 (0.28%) Hugging Face
7 5 (0.28%) Lightning Web Components
8 4 (0.22%) Blazor
8 4 (0.22%) Middleware
8 4 (0.22%) ODBC
8 4 (0.22%) PySpark
8 4 (0.22%) Regular Expression
8 4 (0.22%) WPF
9 3 (0.17%) ADO
9 3 (0.17%) LEMP Stack
9 3 (0.17%) NumPy
Miscellaneous
1 191 (10.58%) Management Information System
2 95 (5.26%) Social Media
3 68 (3.77%) Self-Motivation
4 52 (2.88%) Onboarding
5 31 (1.72%) Analytical Mindset
6 28 (1.55%) Data Structures
7 25 (1.38%) Data Protection Act
8 23 (1.27%) Product Ownership
9 21 (1.16%) Video Conferencing
10 19 (1.05%) Legacy Systems
11 18 (1.00%) e-Learning
11 18 (1.00%) FMCG
12 17 (0.94%) Life Science
13 16 (0.89%) Smartphone
14 15 (0.83%) NHS
14 15 (0.83%) PMI
15 12 (0.66%) Algorithms
15 12 (0.66%) Digital Media
15 12 (0.66%) Reference Data
16 10 (0.55%) Linux Command Line
Operating Systems
1 154 (8.53%) Windows
2 57 (3.16%) Windows Server
3 53 (2.93%) Linux
4 47 (2.60%) Windows 10
5 28 (1.55%) Windows Vista
6 25 (1.38%) Unix
7 23 (1.27%) Windows Server 2016
8 20 (1.11%) Ubuntu
9 16 (0.89%) Mac OS X
9 16 (0.89%) Windows Server 2019
10 12 (0.66%) Android
11 7 (0.39%) Windows 7
12 6 (0.33%) Apple iOS
13 5 (0.28%) Mac OS
14 4 (0.22%) Rocky
15 3 (0.17%) Red Hat Enterprise Linux
16 2 (0.11%) CentOS
17 1 (0.055%) Debian
17 1 (0.055%) Windows 8
17 1 (0.055%) zOS
Processes & Methodologies
1 375 (20.76%) Business Intelligence
2 373 (20.65%) Analytics
3 353 (19.55%) Problem-Solving
4 306 (16.94%) Data Analysis
5 302 (16.72%) Customer Service
6 239 (13.23%) Project Management
7 222 (12.29%) Continuous Improvement
8 212 (11.74%) Data Management
9 200 (11.07%) Process Improvement
10 196 (10.85%) Decision-Making
11 183 (10.13%) Visualisation
12 171 (9.47%) Systems Engineering
13 157 (8.69%) PLM
14 151 (8.36%) Time Management
15 145 (8.03%) Customer Experience
16 131 (7.25%) Actionable Insight
17 123 (6.81%) ERP
17 123 (6.81%) Stakeholder Management
18 122 (6.76%) Data Analytics
19 115 (6.37%) Agile
Programming Languages
1 390 (21.59%) SQL
2 158 (8.75%) Python
3 153 (8.47%) MATLAB
4 56 (3.10%) VBA
5 51 (2.82%) PowerShell
6 35 (1.94%) Data Analysis Expressions
6 35 (1.94%) T-SQL
7 33 (1.83%) R
8 26 (1.44%) Java
9 22 (1.22%) C#
9 22 (1.22%) VB
10 18 (1.00%) C++
11 17 (0.94%) Bash
11 17 (0.94%) JavaScript
12 5 (0.28%) PL/SQL
12 5 (0.28%) VB.NET
13 4 (0.22%) Delphi
13 4 (0.22%) PHP
13 4 (0.22%) Scala
13 4 (0.22%) XAML
Qualifications
1 688 (38.10%) Degree
2 218 (12.07%) BPSS Clearance
3 192 (10.63%) HND
4 175 (9.69%) HNC
5 83 (4.60%) DBS Check
6 51 (2.82%) ACCA
7 48 (2.66%) CIMA
8 45 (2.49%) Master's Degree
9 44 (2.44%) Security Cleared
10 35 (1.94%) SC Cleared
11 32 (1.77%) Microsoft Certification
12 26 (1.44%) Computer Science Degree
13 24 (1.33%) MBA
14 21 (1.16%) PMI Certification
15 16 (0.89%) AAT
15 16 (0.89%) MCSE
15 16 (0.89%) PRINCE2 Certification
16 15 (0.83%) A+ Certification
17 12 (0.66%) CCNA
17 12 (0.66%) Cisco Certification
Quality Assurance & Compliance
1 141 (7.81%) Data Quality
2 62 (3.43%) QA
3 46 (2.55%) SLA
4 42 (2.33%) PMO
5 40 (2.21%) GDPR
6 17 (0.94%) ISO/IEC 27001
7 16 (0.89%) Accessibility
8 10 (0.55%) Sarbanes-Oxley
9 9 (0.50%) ISO 9001
10 5 (0.28%) NIST
11 4 (0.22%) GRC
12 3 (0.17%) COBIT
12 3 (0.17%) ISO 14001
12 3 (0.17%) P3O
13 2 (0.11%) Actionable Recommendations
13 2 (0.11%) Cyber Essentials
14 1 (0.055%) California Consumer Privacy Act
14 1 (0.055%) IFRS
14 1 (0.055%) ITGC
14 1 (0.055%) NIST 800
System Software
1 93 (5.15%) Active Directory
2 17 (0.94%) Hyper-V
3 12 (0.66%) VMware Infrastructure
4 8 (0.44%) Virtual Desktop
4 8 (0.44%) VMware ESXi
5 7 (0.39%) Docker
6 3 (0.17%) Samba
7 2 (0.11%) Virtual Machines
8 1 (0.055%) Job Entry Subsystem
8 1 (0.055%) Time Sharing Option
8 1 (0.055%) vSphere
Systems Management
1 20 (1.11%) Microsoft Intune
2 8 (0.44%) SCCM
2 8 (0.44%) WSUS
3 4 (0.22%) Grafana
4 2 (0.11%) Computer Emergency Response Teams
4 2 (0.11%) RSA Archer
5 1 (0.055%) PaperCut
5 1 (0.055%) Single Sign-On
5 1 (0.055%) Systems Management Server (SMS)
Vendors
1 1,009 (55.87%) Microsoft
2 151 (8.36%) ANSYS
3 116 (6.42%) Google
4 88 (4.87%) SAP
5 86 (4.76%) Salesforce
6 42 (2.33%) Oracle
7 35 (1.94%) YouTube
8 34 (1.88%) Cisco
9 29 (1.61%) Apple
10 21 (1.16%) Adobe
10 21 (1.16%) NEC
10 21 (1.16%) ServiceNow
11 20 (1.11%) Alteryx
11 20 (1.11%) Facebook
12 18 (1.00%) Databricks
12 18 (1.00%) Dell
13 16 (0.89%) Fortinet
13 16 (0.89%) IFS
13 16 (0.89%) Ubiquiti
13 16 (0.89%) VMware