Tableau
UK

The following table provides summary statistics for permanent job vacancies with a requirement for Tableau skills. Included is a benchmarking guide to the salaries offered in vacancies that have cited Tableau over the 6 months to 7 December 2023 with a comparison to the same period in the previous 2 years.

6 months to
7 Dec 2023
Same period 2022 Same period 2021
Rank 251 203 205
Rank change year-on-year -48 +2 +39
Permanent jobs citing Tableau 715 2,321 2,414
As % of all permanent jobs advertised in the UK 1.35% 1.89% 1.88%
As % of the Database & Business Intelligence category 6.34% 8.12% 6.95%
Number of salaries quoted 540 1,363 1,645
10th Percentile £37,500 £37,500 £36,250
25th Percentile £45,000 £45,000 £42,500
Median annual salary (50th Percentile) £60,000 £55,000 £55,000
Median % change year-on-year +9.09% - +10.00%
75th Percentile £77,500 £80,000 £70,000
90th Percentile £86,375 £95,000 £85,000
UK excluding London median annual salary £52,084 £50,000 £47,500
% change year-on-year +4.17% +5.26% +5.56%

All Database and Business Intelligence Skills
UK

Tableau is in the Databases and Business Intelligence category. The following table is for comparison with the above and provides summary statistics for all permanent job vacancies with a requirement for database or business intelligence skills.

Permanent vacancies with a requirement for database or business intelligence skills 11,277 28,579 34,744
As % of all permanent jobs advertised in the UK 21.28% 23.27% 27.11%
Number of salaries quoted 8,446 17,544 22,627
10th Percentile £36,750 £36,750 £35,500
25th Percentile £46,580 £46,250 £42,500
Median annual salary (50th Percentile) £60,000 £62,500 £58,500
Median % change year-on-year -4.00% +6.84% +6.36%
75th Percentile £80,000 £82,500 £77,500
90th Percentile £95,000 £100,000 £95,000
UK excluding London median annual salary £55,000 £55,000 £50,000
% change year-on-year - +10.00% +2.04%

Tableau
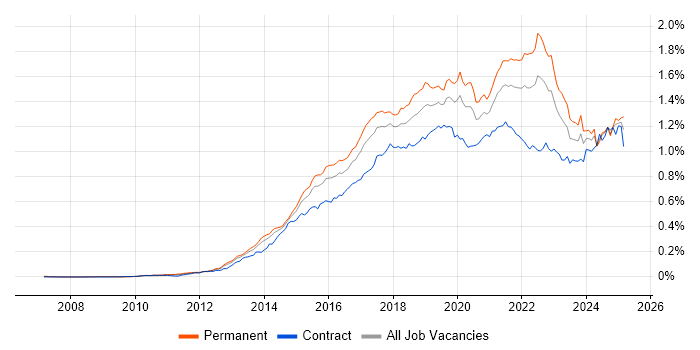
Job Vacancy Trend

Job postings citing Tableau as a proportion of all IT jobs advertised.

Job vacancy trend for Tableau in the UK

Tableau
Salary Trend

3-month moving average salary quoted in jobs citing Tableau.

Salary trend for Tableau in the UK

Tableau
Salary Histogram

Salary distribution for jobs citing Tableau over the 6 months to 7 December 2023.

Salary histogram for Tableau in the UK

Tableau
Top 17 Job Locations

The table below looks at the demand and provides a guide to the median salaries quoted in IT jobs citing Tableau within the UK over the 6 months to 7 December 2023. The 'Rank Change' column provides an indication of the change in demand within each location based on the same 6 month period last year.

Location Rank Change
on Same Period
Last Year
Matching
Permanent
IT Job Ads
Median Salary
Past 6 Months
Median Salary
% Change
on Same Period
Last Year
Live
Jobs
England -37 662 £60,000 +4.35% 371
UK excluding London -60 342 £52,084 +4.17% 193
London -17 331 £65,000 -2.26% 204
Work from Home -39 287 £60,000 +9.09% 199
North of England -7 108 £52,084 -0.79% 64
Midlands -28 85 £45,000 -7.00% 35
West Midlands -8 82 £43,000 -8.24% 29
North West +100 80 £52,084 +4.17% 42
South West +78 70 £46,791 -6.42% 17
Scotland +13 30 £60,249 +20.50% 13
Yorkshire -58 24 £52,000 -13.33% 17
South East -37 23 £50,000 -9.09% 39
East of England +79 18 £50,000 - 15
Wales -8 5 £52,500 -2.78% 8
North East +29 4 £46,250 -10.59% 8
Northern Ireland +23 3 - - 5
East Midlands +6 3 £52,500 -3.23% 6

Tableau
Co-occurring Skills and Capabilities by Category

The follow tables expand on the table above by listing co-occurrences grouped by category. The same employment type, locality and period is covered with up to 20 co-occurrences shown in each of the following categories:

Application Platforms
1 59 (8.25%) Apache
2 57 (7.97%) Apache Spark
3 33 (4.62%) Apache Airflow
4 29 (4.06%) SAS
5 11 (1.54%) Oracle Application Server
6 9 (1.26%) SharePoint
7 6 (0.84%) Luigi
8 5 (0.70%) Confluence
9 3 (0.42%) Jupyter
10 2 (0.28%) CMS
10 2 (0.28%) Tomcat
10 2 (0.28%) WebLogic
11 1 (0.14%) EPiServer
11 1 (0.14%) IIS
11 1 (0.14%) JBoss
11 1 (0.14%) WordPress
Applications
1 110 (15.38%) Microsoft Excel
2 30 (4.20%) Microsoft Office
3 22 (3.08%) Microsoft PowerPoint
4 11 (1.54%) SPSS
5 10 (1.40%) MS Visio
6 7 (0.98%) Microsoft Project
7 6 (0.84%) Spreadsheet
8 3 (0.42%) Trello
9 2 (0.28%) Simulink
10 1 (0.14%) Photoshop
Business Applications
1 6 (0.84%) SAP S/4HANA
2 5 (0.70%) SystmOne
3 4 (0.56%) HFM
3 4 (0.56%) Oracle ERP
3 4 (0.56%) SAP ERP
4 3 (0.42%) NetSuite
5 2 (0.28%) Magento
5 2 (0.28%) Primavera
6 1 (0.14%) Eloqua
6 1 (0.14%) FastStats
6 1 (0.14%) GoldMine
6 1 (0.14%) IBM Planning Analytics
6 1 (0.14%) Oracle Applications
6 1 (0.14%) Oracle EBS
6 1 (0.14%) Raiser's Edge
6 1 (0.14%) Salesforce CRM
6 1 (0.14%) Sparx Enterprise Architect
Cloud Services
1 488 (68.25%) Power Platform
2 138 (19.30%) Azure
3 120 (16.78%) AWS
4 119 (16.64%) GCP
5 68 (9.51%) Snowflake
6 63 (8.81%) Google Analytics
7 52 (7.27%) GitHub
8 49 (6.85%) GitHub Actions
9 47 (6.57%) Vertex AI
10 30 (4.20%) Azure Data Factory
10 30 (4.20%) dbt
11 28 (3.92%) Azure DevOps
12 18 (2.52%) Azure Synapse Analytics
13 15 (2.10%) Matillion
14 13 (1.82%) PowerApps
15 12 (1.68%) Amazon Kinesis
16 11 (1.54%) Amazon S3
17 10 (1.40%) Dagster
18 9 (1.26%) Cloud Computing
18 9 (1.26%) SaaS
Communications & Networking
1 6 (0.84%) Wi-Fi
2 4 (0.56%) DSL
2 4 (0.56%) WebEx
3 3 (0.42%) Unified Communications
4 2 (0.28%) Internet
5 1 (0.14%) FTP
Database & Business Intelligence
1 486 (67.97%) Power BI
2 151 (21.12%) Data Warehouse
3 106 (14.83%) Looker
4 91 (12.73%) Data Lake
5 76 (10.63%) BigQuery
6 75 (10.49%) SQL Server
7 73 (10.21%) NoSQL
8 67 (9.37%) Relational Database
9 65 (9.09%) Big Data
10 61 (8.53%) PostgreSQL
11 54 (7.55%) MySQL
12 51 (7.13%) Bigtable
13 46 (6.43%) SQL Server Reporting Services
14 41 (5.73%) Amazon QuickSight
14 41 (5.73%) SQL Server Integration Services
15 40 (5.59%) QlikView
16 31 (4.34%) Data Mining
17 27 (3.78%) Metadata
18 24 (3.36%) BusinessObjects
19 18 (2.52%) Qlik Sense
Development Applications
1 51 (7.13%) Jenkins
2 38 (5.31%) Git
3 25 (3.50%) JIRA
4 5 (0.70%) Cucumber
5 3 (0.42%) Maven
5 3 (0.42%) TeamCity
6 2 (0.28%) Atlassian Bamboo
6 2 (0.28%) Bitbucket
6 2 (0.28%) JUnit
6 2 (0.28%) SpecFlow
7 1 (0.14%) Apache Continuum
7 1 (0.14%) Artifactory
7 1 (0.14%) GitLab
7 1 (0.14%) MLflow
7 1 (0.14%) Selenium
7 1 (0.14%) SonarQube
7 1 (0.14%) Visual Studio
7 1 (0.14%) Visual Website Optimizer
General
1 253 (35.38%) Finance
2 252 (35.24%) Social Skills
3 243 (33.99%) Analytical Skills
4 99 (13.85%) Banking
5 90 (12.59%) Marketing
6 76 (10.63%) Retail
7 51 (7.13%) Presentation Skills
8 33 (4.62%) Inclusion and Diversity
9 22 (3.08%) Legal
10 16 (2.24%) Automotive
10 16 (2.24%) Manufacturing
10 16 (2.24%) Public Sector
11 15 (2.10%) Games
12 13 (1.82%) Influencing Skills
12 13 (1.82%) Law
13 11 (1.54%) Advertising
14 10 (1.40%) Organisational Skills
15 9 (1.26%) Investment Banking
16 7 (0.98%) Financial Institution
16 7 (0.98%) Social Science
Job Titles
1 254 (35.52%) Analyst
2 133 (18.60%) Data Analyst
3 130 (18.18%) Senior
4 101 (14.13%) Data Engineer
5 83 (11.61%) Developer
6 79 (11.05%) Lead
7 45 (6.29%) Business Intelligence Analyst
8 42 (5.87%) Senior Analyst
9 39 (5.45%) Senior Data Engineer
10 38 (5.31%) Insight Analyst
11 34 (4.76%) Business Analyst
12 30 (4.20%) Business Developer
13 29 (4.06%) Architect
14 27 (3.78%) Data Scientist
15 26 (3.64%) Business Intelligence Manager
15 26 (3.64%) Lead Developer
15 26 (3.64%) Team Leader
16 21 (2.94%) Data Architect
16 21 (2.94%) Data Business Analyst
16 21 (2.94%) SQL Analyst
Libraries, Frameworks & Software Standards
1 54 (7.55%) Kafka
2 22 (3.08%) Pandas
3 21 (2.94%) PySpark
4 17 (2.38%) HTML
5 11 (1.54%) Django
6 10 (1.40%) Great Expectations
7 9 (1.26%) .NET
8 8 (1.12%) PyTorch
8 8 (1.12%) React
8 8 (1.12%) TensorFlow
9 7 (0.98%) D3.js
9 7 (0.98%) REST
10 6 (0.84%) Apache Beam
10 6 (0.84%) CSS
11 5 (0.70%) JSON
11 5 (0.70%) Keras
12 4 (0.56%) .NET Framework
12 4 (0.56%) HTML5
12 4 (0.56%) RESTful
12 4 (0.56%) SQLAlchemy
Miscellaneous
1 45 (6.29%) Public Cloud
2 36 (5.03%) Onboarding
3 34 (4.76%) Self-Motivation
4 29 (4.06%) Management Information System
5 20 (2.80%) Algorithms
6 19 (2.66%) Product Ownership
7 13 (1.82%) Data Structures
8 11 (1.54%) Analytical Mindset
9 8 (1.12%) Mobile Games
9 8 (1.12%) Reinsurance
10 6 (0.84%) Data Protection Act
10 6 (0.84%) Low-Code
10 6 (0.84%) NHS
10 6 (0.84%) Pricing Data
10 6 (0.84%) Video Conferencing
11 5 (0.70%) Cloud Native
12 4 (0.56%) Enterprise Software
12 4 (0.56%) Mobile App
12 4 (0.56%) PropTech
12 4 (0.56%) Taxonomies
Operating Systems
1 10 (1.40%) Linux
2 9 (1.26%) Windows
3 6 (0.84%) Mac OS
3 6 (0.84%) Unix
4 1 (0.14%) Embedded Linux
4 1 (0.14%) Mac OS X
4 1 (0.14%) Windows Server
Processes & Methodologies
1 493 (68.95%) Business Intelligence
2 412 (57.62%) Analytics
3 388 (54.27%) Visualisation
4 313 (43.78%) Data Visualisation
5 177 (24.76%) Data Science
6 173 (24.20%) Agile
7 172 (24.06%) ETL
8 167 (23.36%) Data Analysis
9 166 (23.22%) Data Analytics
10 162 (22.66%) Machine Learning
11 160 (22.38%) Problem-Solving
12 148 (20.70%) Data Modelling
13 132 (18.46%) Data Pipeline
14 121 (16.92%) Decision-Making
15 101 (14.13%) Dashboard Development
16 87 (12.17%) Data Integration
17 81 (11.33%) Artificial Intelligence
17 81 (11.33%) Data Management
18 78 (10.91%) CI/CD
19 72 (10.07%) Data Governance
Programming Languages
1 414 (57.90%) SQL
2 295 (41.26%) Python
3 92 (12.87%) R
4 37 (5.17%) T-SQL
5 31 (4.34%) C#
6 30 (4.20%) Java
7 25 (3.50%) VBA
8 21 (2.94%) JavaScript
9 15 (2.10%) MATLAB
10 13 (1.82%) Bash
11 11 (1.54%) PHP
12 10 (1.40%) Data Analysis Expressions
12 10 (1.40%) Scala
13 6 (0.84%) PowerShell
14 5 (0.70%) PL/SQL
15 3 (0.42%) Go
16 2 (0.28%) C++
16 2 (0.28%) VB.NET
17 1 (0.14%) C
17 1 (0.14%) Shell Script
Qualifications
1 197 (27.55%) Degree
2 36 (5.03%) Computer Science Degree
2 36 (5.03%) Master's Degree
3 14 (1.96%) Security Cleared
4 11 (1.54%) Numerate Degree
4 11 (1.54%) SC Cleared
5 10 (1.40%) Postgraduate
6 8 (1.12%) Azure Certification
6 8 (1.12%) PhD
6 8 (1.12%) Tableau Certification
7 6 (0.84%) Microsoft Certification
8 5 (0.70%) MCSA
8 5 (0.70%) MCSE
9 3 (0.42%) HND
9 3 (0.42%) Six Sigma Black Belt
9 3 (0.42%) Six Sigma Green Belt
10 2 (0.28%) IIBA
10 2 (0.28%) ISTQB
10 2 (0.28%) MBA
10 2 (0.28%) PMI Certification
Quality Assurance & Compliance
1 119 (16.64%) Data Quality
2 25 (3.50%) GDPR
3 20 (2.80%) PMO
4 16 (2.24%) QA
5 7 (0.98%) Actionable Recommendations
6 5 (0.70%) SLA
7 3 (0.42%) GMP
8 2 (0.28%) Accessibility
8 2 (0.28%) ISO 9001
9 1 (0.14%) COSHH
9 1 (0.14%) HIPAA
9 1 (0.14%) ISAE 3402
9 1 (0.14%) Sarbanes-Oxley
9 1 (0.14%) SNOMED CT
System Software
1 22 (3.08%) Docker
2 3 (0.42%) IAG
3 2 (0.28%) HDFS
4 1 (0.14%) Active Directory
Systems Management
1 53 (7.41%) Terraform
2 24 (3.36%) Kubernetes
3 2 (0.28%) Ansible
4 1 (0.14%) Grafana
4 1 (0.14%) Kibana
4 1 (0.14%) Kubeflow
Vendors
1 151 (21.12%) Google
2 110 (15.38%) Microsoft
3 54 (7.55%) Alteryx
4 51 (7.13%) Oracle
5 49 (6.85%) Databricks
6 28 (3.92%) Salesforce
7 19 (2.66%) SAP
8 16 (2.24%) Adobe
9 15 (2.10%) Informatica
10 11 (1.54%) Cognos
10 11 (1.54%) MicroStrategy
11 10 (1.40%) Dataiku
11 10 (1.40%) YouTube
12 7 (0.98%) Advent
12 7 (0.98%) Bloomberg
12 7 (0.98%) FactSet
12 7 (0.98%) Splunk
13 6 (0.84%) Apple
14 5 (0.70%) Anaplan
15 4 (0.56%) Talend