Use Cases
UK

The following table provides summary statistics for permanent job vacancies with a requirement for Use Case skills. Included is a benchmarking guide to the salaries offered in vacancies that have cited Use Case over the 6 months to 28 November 2023 with a comparison to the same period in the previous 2 years.

6 months to
28 Nov 2023
Same period 2022 Same period 2021
Rank 315 231 288
Rank change year-on-year -84 +57 +51
Permanent jobs citing Use Case 525 2,031 1,632
As % of all permanent jobs advertised in the UK 0.97% 1.62% 1.27%
As % of the Processes & Methodologies category 1.03% 1.69% 1.33%
Number of salaries quoted 373 1,006 950
10th Percentile £39,826 £37,885 £41,250
25th Percentile £52,027 £47,500 £50,000
Median annual salary (50th Percentile) £65,000 £62,500 £65,000
Median % change year-on-year +4.00% -3.85% +13.04%
75th Percentile £85,000 £82,375 £80,000
90th Percentile £97,500 £105,000 £95,000
UK excluding London median annual salary £59,526 £50,792 £55,000
% change year-on-year +17.20% -7.65% +7.32%

All Process and Methodology Skills
UK

Use Case is in the Processes and Methodologies category. The following table is for comparison with the above and provides summary statistics for all permanent job vacancies with a requirement for process or methodology skills.

Permanent vacancies with a requirement for process or methodology skills 51,121 120,104 122,523
As % of all permanent jobs advertised in the UK 94.09% 95.72% 95.43%
Number of salaries quoted 36,956 73,203 81,032
10th Percentile £32,500 £34,313 £32,500
25th Percentile £43,750 £45,000 £42,500
Median annual salary (50th Percentile) £60,000 £60,000 £59,000
Median % change year-on-year - +1.69% +7.27%
75th Percentile £80,000 £81,250 £77,500
90th Percentile £98,750 £100,000 £95,000
UK excluding London median annual salary £52,500 £53,000 £50,000
% change year-on-year -0.94% +6.00% +4.17%

Use Case
Job Vacancy Trend

Job postings citing Use Case as a proportion of all IT jobs advertised.
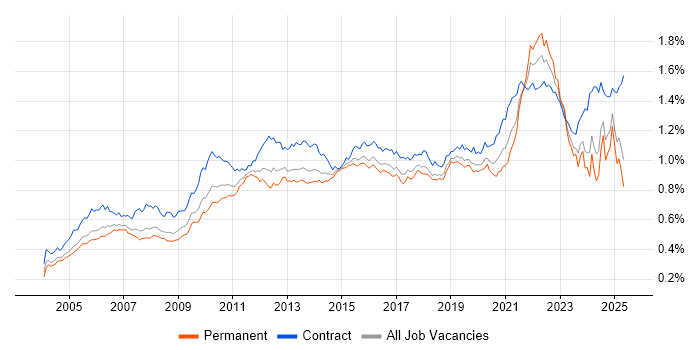
Job vacancy trend for Use Case in the UK

Use Case
Salary Trend

3-month moving average salary quoted in jobs citing Use Case.

Salary trend for Use Case in the UK

Use Case
Salary Histogram

Salary distribution for jobs citing Use Case over the 6 months to 28 November 2023.

Salary histogram for Use Case in the UK

Use Case
Top 17 Job Locations

The table below looks at the demand and provides a guide to the median salaries quoted in IT jobs citing Use Case within the UK over the 6 months to 28 November 2023. The 'Rank Change' column provides an indication of the change in demand within each location based on the same 6 month period last year.

Location Rank Change
on Same Period
Last Year
Matching
Permanent
IT Job Ads
Median Salary
Past 6 Months
Median Salary
% Change
on Same Period
Last Year
Live
Jobs
England -61 483 £65,000 +4.00% 315
UK excluding London -66 284 £59,526 +17.20% 147
Work from Home -50 255 £67,000 +7.20% 131
London -46 217 £73,000 -2.67% 182
North of England +11 82 £59,526 - 37
South West -24 70 £55,000 +37.11% 10
South East -6 49 £57,500 +2.22% 41
North West +58 43 £57,500 - 26
Yorkshire +18 37 £62,500 +5.00% 8
Midlands +63 30 £60,000 +20.00% 29
West Midlands +58 29 £61,250 +22.50% 25
Scotland -11 28 £59,526 +19.05% 12
East of England +41 19 £79,000 +37.39% 19
Northern Ireland +39 4 £65,000 +46.07% 3
North East +31 2 - - 3
Wales +1 2 £37,500 -53.13% 1
East Midlands +40 1 £42,500 +6.52% 4

Use Case
Co-occurring Skills and Capabilities by Category

The follow tables expand on the table above by listing co-occurrences grouped by category. The same employment type, locality and period is covered with up to 20 co-occurrences shown in each of the following categories:

Application Platforms
1 30 (5.71%) Confluence
2 9 (1.71%) Jupyter
3 8 (1.52%) CMS
3 8 (1.52%) SAS
3 8 (1.52%) SharePoint
4 5 (0.95%) Apache
5 3 (0.57%) Anypoint
5 3 (0.57%) Apache Airflow
5 3 (0.57%) Apache Spark
5 3 (0.57%) BizTalk Server
6 2 (0.38%) Camunda
7 1 (0.19%) Drupal
Applications
1 16 (3.05%) Microsoft Excel
1 16 (3.05%) Microsoft Office
1 16 (3.05%) MS Visio
2 11 (2.10%) Microsoft PowerPoint
3 6 (1.14%) OrCAD
4 5 (0.95%) Windchill
5 2 (0.38%) AutoCAD
5 2 (0.38%) Siemens NX
5 2 (0.38%) Trello
6 1 (0.19%) Microsoft Project
Business Applications
1 4 (0.76%) Dynamics CRM
1 4 (0.76%) SAP Oil and Gas
2 3 (0.57%) Oracle ERP
2 3 (0.57%) Sparx Enterprise Architect
3 2 (0.38%) Oracle Applications
3 2 (0.38%) Oracle FAH
3 2 (0.38%) Oracle Financials
4 1 (0.19%) Aladdin
4 1 (0.19%) SAP Hybris
4 1 (0.19%) SAP S/4HANA
4 1 (0.19%) SAP SD
4 1 (0.19%) thinkFolio
Cloud Services
1 145 (27.62%) Azure
2 85 (16.19%) AWS
3 62 (11.81%) GCP
4 52 (9.90%) Azure DevOps
5 50 (9.52%) GitHub
6 45 (8.57%) PaaS
7 32 (6.10%) Power Platform
8 31 (5.90%) SaaS
9 21 (4.00%) IaaS
10 19 (3.62%) Microsoft 365
11 10 (1.90%) Azure Data Factory
11 10 (1.90%) Azure Sentinel
11 10 (1.90%) Azure Service Bus
12 6 (1.14%) Azure Cosmos DB
12 6 (1.14%) Azure Logic Apps
12 6 (1.14%) Azure Monitor
12 6 (1.14%) Cloud Computing
12 6 (1.14%) Cloudflare
12 6 (1.14%) Serverless
12 6 (1.14%) Vertex AI
Communications & Networking
1 54 (10.29%) Firewall
2 18 (3.43%) Intrusion Detection
3 6 (1.14%) DNS
3 6 (1.14%) Network Security
3 6 (1.14%) Software-Defined Radio
3 6 (1.14%) TCP/IP
4 5 (0.95%) DHCP
4 5 (0.95%) Wi-Fi
5 4 (0.76%) IPv4
5 4 (0.76%) Wireless
6 3 (0.57%) HTTP
6 3 (0.57%) LAN
6 3 (0.57%) VPN
7 2 (0.38%) GSM
7 2 (0.38%) Remote Desktop
8 1 (0.19%) 5G
8 1 (0.19%) Broadband
8 1 (0.19%) DMZ
8 1 (0.19%) Internet
8 1 (0.19%) IPv6
Database & Business Intelligence
1 27 (5.14%) Power BI
2 26 (4.95%) Metadata
3 22 (4.19%) Tableau
4 18 (3.43%) Data Warehouse
5 16 (3.05%) SQL Server
6 11 (2.10%) Big Data
6 11 (2.10%) Electronic Patient Records
7 9 (1.71%) MongoDB
8 8 (1.52%) Azure SQL Database
9 7 (1.33%) Data Vault
10 6 (1.14%) Hadoop
10 6 (1.14%) Redis
10 6 (1.14%) Relational Database
11 5 (0.95%) Geospatial Data
11 5 (0.95%) QlikView
12 3 (0.57%) Data Hub
12 3 (0.57%) Looker
12 3 (0.57%) NoSQL
13 2 (0.38%) Data Mining
13 2 (0.38%) MySQL
Development Applications
1 52 (9.90%) JIRA
2 43 (8.19%) Jenkins
3 33 (6.29%) Git
4 16 (3.05%) Bitbucket
5 15 (2.86%) Visual Studio
6 6 (1.14%) Rational DOORS
7 5 (0.95%) Postman
8 3 (0.57%) RStudio
8 3 (0.57%) Selenium
8 3 (0.57%) Visual Studio Code
9 1 (0.19%) CircleCI
9 1 (0.19%) Cucumber
9 1 (0.19%) GitLab
9 1 (0.19%) GoCD
9 1 (0.19%) InstallShield
9 1 (0.19%) Oracle APEX
General
1 214 (40.76%) Finance
2 140 (26.67%) Social Skills
3 109 (20.76%) Banking
4 87 (16.57%) Analytical Skills
5 34 (6.48%) Marketing
6 31 (5.90%) Influencing Skills
7 29 (5.52%) Inclusion and Diversity
7 29 (5.52%) Manufacturing
8 25 (4.76%) Legal
8 25 (4.76%) Presentation Skills
9 21 (4.00%) Back Office
10 20 (3.81%) Retail
11 19 (3.62%) Law
12 15 (2.86%) Automotive
12 15 (2.86%) Games
12 15 (2.86%) Military
13 13 (2.48%) Electronics
14 11 (2.10%) Public Sector
14 11 (2.10%) Telecoms
15 10 (1.90%) Financial Institution
Job Titles
1 209 (39.81%) Analyst
2 94 (17.90%) Business Analyst
3 88 (16.76%) Senior
4 76 (14.48%) Lead
5 68 (12.95%) Security Engineer
6 54 (10.29%) Cloud Engineer
7 53 (10.10%) Cloud Security Engineer
8 39 (7.43%) Security Analyst
9 36 (6.86%) Architect
10 30 (5.71%) Developer
11 29 (5.52%) Data Analyst
12 26 (4.95%) Cybersecurity Analyst
12 26 (4.95%) Senior Analyst
13 23 (4.38%) Technical Analyst
14 20 (3.81%) Senior Cloud Engineer
14 20 (3.81%) Senior Security Engineer
14 20 (3.81%) SOC Analyst
15 17 (3.24%) Technical Business Analyst
16 16 (3.05%) Cloud Security Lead
16 16 (3.05%) Lead Cloud Engineer
Libraries, Frameworks & Software Standards
1 20 (3.81%) JSON
2 16 (3.05%) YAML
3 15 (2.86%) RESTful
4 14 (2.67%) Unity (Game Engine)
5 11 (2.10%) REST
6 10 (1.90%) PyTorch
6 10 (1.90%) scikit-learn
6 10 (1.90%) TensorFlow
7 9 (1.71%) .NET
7 9 (1.71%) React
8 8 (1.52%) SailPoint
9 7 (1.33%) Kafka
9 7 (1.33%) LDAP
9 7 (1.33%) Next.js
9 7 (1.33%) SOAP
10 6 (1.14%) HTML
10 6 (1.14%) Keras
10 6 (1.14%) Node.js
10 6 (1.14%) XSLT
11 5 (0.95%) Web Services
Miscellaneous
1 51 (9.71%) Product Ownership
2 47 (8.95%) Public Cloud
3 28 (5.33%) Onboarding
4 27 (5.14%) Management Information System
5 25 (4.76%) Cyber Threat
6 24 (4.57%) Embedded Systems
7 20 (3.81%) Cloud Native
8 16 (3.05%) Linux Command Line
9 15 (2.86%) Data Centre
10 14 (2.67%) Hybrid Cloud
10 14 (2.67%) Virtual Reality
11 13 (2.48%) Mali
11 13 (2.48%) Security Posture
12 12 (2.29%) Security Operations Centre
13 11 (2.10%) Self-Motivation
14 10 (1.90%) Blockchain
14 10 (1.90%) Culture of Ownership
15 9 (1.71%) Algorithms
15 9 (1.71%) Distributed Denial-of-Service
16 8 (1.52%) Enterprise Software
Operating Systems
1 35 (6.67%) Linux
2 31 (5.90%) Windows
3 13 (2.48%) Android
4 6 (1.14%) Windows Server
5 5 (0.95%) FreeRTOS
6 4 (0.76%) Unix
7 2 (0.38%) Windows 10
7 2 (0.38%) Windows Server 2016
Processes & Methodologies
1 225 (42.86%) Agile
2 125 (23.81%) Cybersecurity
3 118 (22.48%) Analytics
4 117 (22.29%) Roadmaps
5 103 (19.62%) DevOps
6 95 (18.10%) Business Analysis
7 77 (14.67%) Cloud Security
8 70 (13.33%) Problem-Solving
9 69 (13.14%) SIEM
10 67 (12.76%) User Stories
11 58 (11.05%) Security Operations
11 58 (11.05%) Software Engineering
12 56 (10.67%) Business Intelligence
13 55 (10.48%) Infrastructure as Code
13 55 (10.48%) UML
14 54 (10.29%) CI/CD
14 54 (10.29%) Data Modelling
15 49 (9.33%) Information Security
15 49 (9.33%) Migration
15 49 (9.33%) Waterfall
Programming Languages
1 121 (23.05%) Python
2 63 (12.00%) SQL
3 41 (7.81%) PowerShell
4 31 (5.90%) C#
5 26 (4.95%) C
6 24 (4.57%) Bash
7 20 (3.81%) C++
8 18 (3.43%) JavaScript
9 17 (3.24%) Java
10 16 (3.05%) R
11 8 (1.52%) Kusto Query Language
12 6 (1.14%) MATLAB
13 5 (0.95%) Go
14 2 (0.38%) Embedded C
14 2 (0.38%) PL/SQL
14 2 (0.38%) T-SQL
14 2 (0.38%) TypeScript
15 1 (0.19%) Embedded C++
15 1 (0.19%) Perl
15 1 (0.19%) PHP
Qualifications
1 110 (20.95%) Degree
2 75 (14.29%) Security Cleared
3 47 (8.95%) SC Cleared
4 20 (3.81%) Network+ Certification
5 19 (3.62%) CISSP
6 18 (3.43%) AWS Certification
6 18 (3.43%) CompTIA Security+
7 17 (3.24%) Azure Certification
7 17 (3.24%) Cisco Certification
8 16 (3.05%) BPSS Clearance
9 14 (2.67%) (ISC)2 CCSP
9 14 (2.67%) CCSP
9 14 (2.67%) DV Cleared
10 13 (2.48%) CompTIA CySA+
11 12 (2.29%) AWS Certified Cloud Practitioner
12 9 (1.71%) IIBA
13 7 (1.33%) Computer Science Degree
13 7 (1.33%) Master's Degree
13 7 (1.33%) Six Sigma Black Belt
14 5 (0.95%) CISM
Quality Assurance & Compliance
1 50 (9.52%) Data Quality
2 22 (4.19%) NIST
3 21 (4.00%) QA
4 18 (3.43%) ISO/IEC 27001
5 16 (3.05%) ISO/IEC 15288
6 12 (2.29%) Cyber Essentials
6 12 (2.29%) GDPR
6 12 (2.29%) SOC 2
7 9 (1.71%) PCI DSS
8 6 (1.14%) ISO 9000
8 6 (1.14%) SLA
9 5 (0.95%) ISO 9001
10 4 (0.76%) Actionable Recommendations
10 4 (0.76%) MISRA
10 4 (0.76%) MISRA C
10 4 (0.76%) PMO
11 3 (0.57%) NIST 800
12 2 (0.38%) Accessibility
12 2 (0.38%) Cyber Essentials PLUS
12 2 (0.38%) ISO 26262
System Software
1 39 (7.43%) Docker
2 24 (4.57%) Firmware
3 13 (2.48%) Embedded Firmware
4 12 (2.29%) Active Directory
5 5 (0.95%) VMware Infrastructure
6 3 (0.57%) Virtual Desktop
7 2 (0.38%) Hyper-V
8 1 (0.19%) OpenAM
8 1 (0.19%) Snort
Systems Management
1 63 (12.00%) Kubernetes
2 55 (10.48%) Terraform
3 17 (3.24%) Istio
4 16 (3.05%) Ansible
5 5 (0.95%) CASB
6 3 (0.57%) Computer Emergency Response Teams
6 3 (0.57%) Nagios
7 2 (0.38%) CSIRT
8 1 (0.19%) Fortio
8 1 (0.19%) Grafana
8 1 (0.19%) Kiali
8 1 (0.19%) Progress Chef
8 1 (0.19%) Puppet
8 1 (0.19%) SysTrack
Vendors
1 81 (15.43%) Microsoft
2 49 (9.33%) Google
3 19 (3.62%) SAP
4 14 (2.67%) Carbon Black
4 14 (2.67%) McAfee
5 13 (2.48%) Oracle
6 12 (2.29%) ArcSight
6 12 (2.29%) Databricks
6 12 (2.29%) Splunk
7 11 (2.10%) CyberArk
8 9 (1.71%) Cadence
8 9 (1.71%) IBM
9 8 (1.52%) Okta
10 7 (1.33%) Informatica
11 6 (1.14%) ServiceNow
11 6 (1.14%) Workday
12 5 (0.95%) Alteryx
12 5 (0.95%) Centrify
12 5 (0.95%) Cognos
12 5 (0.95%) Salesforce