Requirements Gathering Jobs

Requirements Gathering (Requirements Elicitation)
UK

The table below provides summary statistics for permanent job vacancies requiring Requirements Gathering skills. It includes a benchmarking guide to the annual salaries offered in vacancies that cited Requirements Gathering over the 6 months leading up to 23 January 2025, comparing them to the same period in the previous two years.

6 months to
23 Jan 2025
Same period 2024 Same period 2023
Rank 203 181 157
Rank change year-on-year -22 -24 +1
Permanent jobs citing Requirements Gathering 964 1,198 2,446
As % of all permanent jobs advertised in the UK 1.48% 1.79% 2.28%
As % of the Processes & Methodologies category 1.60% 2.00% 2.39%
Number of salaries quoted 538 801 1,668
10th Percentile £38,750 £37,500 £41,250
25th Percentile £42,750 £43,461 £47,250
Median annual salary (50th Percentile) £60,000 £55,000 £60,000
Median % change year-on-year +9.09% -8.33% +9.09%
75th Percentile £76,250 £76,250 £76,250
90th Percentile £92,150 £93,750 £90,000
UK excluding London median annual salary £54,000 £50,000 £50,000
% change year-on-year +8.00% - -

All Process and Methodology Skills
UK

Requirements Gathering falls under the Processes and Methodologies category. For comparison with the information above, the following table provides summary statistics for all permanent job vacancies requiring process or methodology skills.

Permanent vacancies with a requirement for process or methodology skills 60,309 59,780 102,411
As % of all permanent jobs advertised in the UK 92.34% 89.55% 95.43%
Number of salaries quoted 25,978 43,902 64,334
10th Percentile £35,000 £30,125 £35,000
25th Percentile £45,500 £41,250 £46,250
Median annual salary (50th Percentile) £60,000 £57,500 £62,500
Median % change year-on-year +4.35% -8.00% +4.17%
75th Percentile £77,500 £77,500 £82,500
90th Percentile £98,750 £96,250 £100,000
UK excluding London median annual salary £55,000 £50,000 £55,000
% change year-on-year +10.00% -9.09% +10.00%

Requirements Gathering
Job Vacancy Trend

Job postings citing Requirements Gathering as a proportion of all IT jobs advertised.
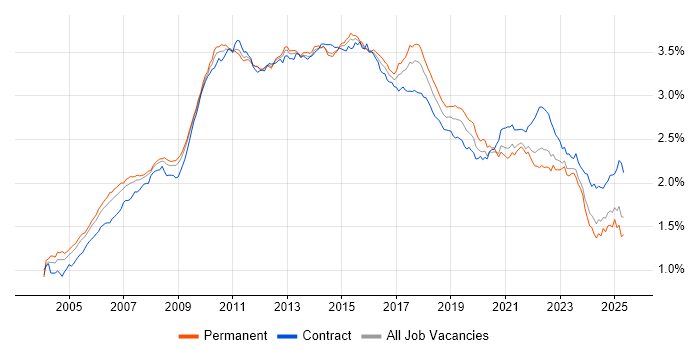
Job vacancy trend for Requirements Gathering in the UK

Requirements Gathering
Salary Trend

3-month moving average salary quoted in jobs citing Requirements Gathering.

Salary trend for Requirements Gathering in the UK

Requirements Gathering
Salary Histogram

Salary distribution for jobs citing Requirements Gathering over the 6 months to 23 January 2025.

Salary histogram for Requirements Gathering in the UK

Requirements Gathering
Top 17 Job Locations

The table below looks at the demand and provides a guide to the median salaries quoted in IT jobs citing Requirements Gathering within the UK over the 6 months to 23 January 2025. The 'Rank Change' column provides an indication of the change in demand within each location based on the same 6 month period last year.

Location Rank Change
on Same Period
Last Year
Matching
Permanent
IT Job Ads
Median Salary
Past 6 Months
Median Salary
% Change
on Same Period
Last Year
Live
Jobs
England -12 878 £60,000 +9.09% 302
UK excluding London -12 617 £54,000 +8.00% 190
Work from Home -59 316 £60,000 +11.11% 245
London -36 305 £72,500 - 127
Midlands +25 191 £55,000 +10.00% 31
South East -16 174 £55,000 +10.00% 34
West Midlands +30 150 £52,500 +5.00% 23
North of England -33 105 £42,500 -15.00% 65
North West -41 82 £42,500 -15.00% 39
South West +7 53 £54,439 +8.88% 23
Scotland +15 42 £62,500 +47.06% 23
East Midlands -11 41 £55,000 +9.45% 8
East of England -50 37 £70,000 +40.00% 12
Yorkshire -5 20 £52,500 +5.00% 20
Wales +21 10 £52,052 +4.10% 1
Northern Ireland +14 8 £60,000 +54.84% 1
North East -15 3 £60,000 -29.41% 6

Requirements Gathering
Co-occurring Skills and Capabilities by Category

The follow tables expand on the table above by listing co-occurrences grouped by category. The same employment type, locality and period is covered with up to 20 co-occurrences shown in each of the following categories:

Application Platforms
1 35 (3.63%) SharePoint
2 28 (2.90%) CMS
3 24 (2.49%) Confluence
4 15 (1.56%) SAS
5 7 (0.73%) Apache Spark
6 5 (0.52%) TPMS
7 4 (0.41%) Oracle Workflow
8 2 (0.21%) Apache Airflow
9 1 (0.10%) Drupal
9 1 (0.10%) Kinematics
9 1 (0.10%) Microsoft Exchange
9 1 (0.10%) Sitecore CMS
Applications
1 52 (5.39%) Microsoft Excel
2 22 (2.28%) Microsoft Office
3 18 (1.87%) Microsoft Project
4 9 (0.93%) MS Visio
5 7 (0.73%) Microsoft PowerPoint
6 1 (0.10%) Notion
6 1 (0.10%) Sketch
6 1 (0.10%) S-PLUS
6 1 (0.10%) Trello
Business Applications
1 53 (5.50%) NetSuite
2 34 (3.53%) Shopify
3 31 (3.22%) Dynamics CRM
4 28 (2.90%) Magento
5 26 (2.70%) SAP S/4HANA
6 7 (0.73%) Odoo
7 6 (0.62%) Oracle Payables
7 6 (0.62%) Oracle Receivables
7 6 (0.62%) SAP EWM
7 6 (0.62%) SAP MM
7 6 (0.62%) SAP PP
7 6 (0.62%) SAP SD
8 5 (0.52%) Oracle Assets
8 5 (0.52%) Oracle General Ledger
9 4 (0.41%) Demantra
9 4 (0.41%) Oracle ASCP
9 4 (0.41%) Oracle EBS
9 4 (0.41%) Oracle E-Business Tax
9 4 (0.41%) SAP FI
9 4 (0.41%) SAP Travel Management
Cloud Services
1 97 (10.06%) Azure
2 90 (9.34%) Power Platform
3 72 (7.47%) AWS
4 39 (4.05%) Dynamics 365
5 28 (2.90%) Microsoft 365
6 26 (2.70%) Amazon S3
7 24 (2.49%) Cloud Computing
8 22 (2.28%) Amazon EC2
8 22 (2.28%) PowerApps
9 19 (1.97%) Serverless
10 18 (1.87%) SaaS
11 13 (1.35%) Azure Functions
11 13 (1.35%) Power Automate
12 11 (1.14%) GitHub
13 10 (1.04%) Azure DevOps
14 7 (0.73%) Azure Data Factory
14 7 (0.73%) GCP
14 7 (0.73%) Salesforce Service Cloud
15 6 (0.62%) Salesforce Sales Cloud
15 6 (0.62%) Virtual Private Cloud
Communications & Networking
1 26 (2.70%) Internet
2 12 (1.24%) Firewall
3 9 (0.93%) LAN
3 9 (0.93%) WAN
4 8 (0.83%) BGP
4 8 (0.83%) Cisco IOS
4 8 (0.83%) HTTPS
4 8 (0.83%) IPsec
4 8 (0.83%) Junos
4 8 (0.83%) MPLS
5 7 (0.73%) Network Security
6 5 (0.52%) DNS
6 5 (0.52%) IPv6
6 5 (0.52%) Reverse Proxy
6 5 (0.52%) TCP/IP
6 5 (0.52%) VPN
7 4 (0.41%) Wi-Fi
8 3 (0.31%) Multicast
9 2 (0.21%) Cisco Firepower
10 1 (0.10%) Wireless
Database & Business Intelligence
1 59 (6.12%) Power BI
2 39 (4.05%) Data Warehouse
3 33 (3.42%) Relational Database
4 31 (3.22%) SQL Server
5 25 (2.59%) Tableau
6 24 (2.49%) Azure SQL Database
7 19 (1.97%) NoSQL
8 16 (1.66%) Amazon Redshift
8 16 (1.66%) Data Mining
9 15 (1.56%) Amazon QuickSight
9 15 (1.56%) DynamoDB
10 14 (1.45%) MySQL
11 13 (1.35%) SQL Server Integration Services
12 12 (1.24%) Data Lake
12 12 (1.24%) PostgreSQL
13 10 (1.04%) MongoDB
13 10 (1.04%) SQL Server Reporting Services
14 9 (0.93%) Big Data
15 8 (0.83%) Enterprise Data Warehouse
16 6 (0.62%) MS Access
Development Applications
1 62 (6.43%) Rational DOORS
2 47 (4.88%) JIRA
3 17 (1.76%) Jenkins
4 15 (1.56%) Git
5 12 (1.24%) Visual Studio
6 7 (0.73%) Visual Studio Code
7 6 (0.62%) Cypress.io
7 6 (0.62%) GitLab
7 6 (0.62%) LSMW
8 3 (0.31%) Android Studio
8 3 (0.31%) Eclipse
8 3 (0.31%) JMeter
8 3 (0.31%) Postman
8 3 (0.31%) Xcode
9 2 (0.21%) Cucumber
9 2 (0.21%) Robot Framework
9 2 (0.21%) Selenium
10 1 (0.10%) ERwin
10 1 (0.10%) Jasmine
10 1 (0.10%) Karma Test Runner
General
1 431 (44.71%) Social Skills
2 274 (28.42%) Analytical Skills
3 259 (26.87%) Finance
4 98 (10.17%) Manufacturing
5 92 (9.54%) Law
6 63 (6.54%) Organisational Skills
7 47 (4.88%) Marketing
8 40 (4.15%) Banking
9 35 (3.63%) Military
10 32 (3.32%) Public Sector
11 30 (3.11%) Legal
12 29 (3.01%) Inclusion and Diversity
12 29 (3.01%) Retail
13 23 (2.39%) Presentation Skills
14 18 (1.87%) Aerospace
15 16 (1.66%) Electronics
16 14 (1.45%) Influencing Skills
17 12 (1.24%) Front Office
18 11 (1.14%) Publishing
19 10 (1.04%) General Ledger
Job Titles
1 222 (23.03%) Analyst
2 171 (17.74%) Consultant
3 137 (14.21%) Business Analyst
4 128 (13.28%) Senior
5 110 (11.41%) Developer
6 75 (7.78%) Architect
7 71 (7.37%) Lead
8 61 (6.33%) Logistics Engineer
9 60 (6.22%) Functional Consultant
10 59 (6.12%) Project Engineer
10 59 (6.12%) Senior Analyst
11 53 (5.50%) Principal Engineer
12 50 (5.19%) Solutions Architect
13 47 (4.88%) Principal Systems Engineer
13 47 (4.88%) Requirements Engineer
14 43 (4.46%) NetSuite Consultant
15 41 (4.25%) Software Engineer
16 32 (3.32%) Technical Analyst
17 30 (3.11%) Project Manager
17 30 (3.11%) Systems Analyst
Libraries, Frameworks & Software Standards
1 78 (8.09%) HTML
2 53 (5.50%) .NET
3 51 (5.29%) Middleware
4 42 (4.36%) React
5 41 (4.25%) CSS
6 39 (4.05%) AngularJS
7 33 (3.42%) ASP.NET
8 28 (2.90%) REST
9 27 (2.80%) .NET Framework
10 26 (2.70%) HTML5
11 22 (2.28%) Entity Framework
12 19 (1.97%) JSON
12 19 (1.97%) Web Services
12 19 (1.97%) XML
13 17 (1.76%) jQuery
14 14 (1.45%) .NET Core
15 13 (1.35%) ASP.NET Core
15 13 (1.35%) CSS3
15 13 (1.35%) Vue
16 12 (1.24%) ASP.NET MVC
Miscellaneous
1 77 (7.99%) Management Information System
2 47 (4.88%) Self-Motivation
3 42 (4.36%) Product Ownership
4 25 (2.59%) Virtual Team
5 20 (2.07%) Mobile App
6 16 (1.66%) Legacy Systems
7 12 (1.24%) Analytical Mindset
7 12 (1.24%) Greenfield Project
8 11 (1.14%) Low-Code
9 9 (0.93%) PMI
9 9 (0.93%) Reinsurance
10 8 (0.83%) Algorithms
10 8 (0.83%) Data Structures
10 8 (0.83%) Foreign Exchange (FX)
11 7 (0.73%) Online Banking
12 6 (0.62%) Data Protection Act
12 6 (0.62%) Mainframe
12 6 (0.62%) Molecular Biology
12 6 (0.62%) Onboarding
13 5 (0.52%) Video\Live Streaming
Operating Systems
1 23 (2.39%) Linux
2 21 (2.18%) Windows
3 17 (1.76%) Android
3 17 (1.76%) Apple iOS
4 8 (0.83%) Mac OS
4 8 (0.83%) Unix
4 8 (0.83%) Windows Server
5 5 (0.52%) Windows 10
6 1 (0.10%) Robot Operating System
Processes & Methodologies
1 304 (31.54%) Agile
2 228 (23.65%) Problem-Solving
3 160 (16.60%) Project Management
3 160 (16.60%) Stakeholder Management
4 117 (12.14%) ERP
5 116 (12.03%) Validation
6 114 (11.83%) Business Analysis
7 112 (11.62%) Scrum
8 109 (11.31%) Logistics
8 109 (11.31%) Migration
9 108 (11.20%) Data Analysis
10 98 (10.17%) CRM
11 94 (9.75%) Analytics
12 91 (9.44%) CI/CD
13 90 (9.34%) Data Migration
14 89 (9.23%) Change Management
15 87 (9.02%) Data Management
16 86 (8.92%) Decision-Making
17 84 (8.71%) Business Case
18 83 (8.61%) SDLC
Programming Languages
1 189 (19.61%) SQL
2 106 (11.00%) JavaScript
3 97 (10.06%) Python
4 49 (5.08%) C#
5 33 (3.42%) Java
6 26 (2.70%) TypeScript
7 18 (1.87%) C++
8 17 (1.76%) PowerShell
8 17 (1.76%) R
9 15 (1.56%) MATLAB
9 15 (1.56%) T-SQL
10 13 (1.35%) VBA
11 11 (1.14%) PHP
12 7 (0.73%) ABAP
12 7 (0.73%) C
12 7 (0.73%) Data Analysis Expressions
12 7 (0.73%) Kotlin
12 7 (0.73%) PL/SQL
13 5 (0.52%) VB
14 4 (0.41%) Swift
Qualifications
1 220 (22.82%) Degree
2 127 (13.17%) Security Cleared
3 83 (8.61%) SC Cleared
4 47 (4.88%) Chartered Engineer
5 39 (4.05%) Computer Science Degree
6 31 (3.22%) Master's Degree
7 20 (2.07%) DV Cleared
8 18 (1.87%) BPSS Clearance
8 18 (1.87%) Microsoft Certification
9 15 (1.56%) PMI Certification
10 11 (1.14%) CCNA
10 11 (1.14%) CCNP
10 11 (1.14%) Cisco Certification
10 11 (1.14%) JNCIS
11 9 (0.93%) HNC
12 7 (0.73%) CBAP
12 7 (0.73%) IIBA
13 6 (0.62%) Azure Certification
13 6 (0.62%) PMP
14 5 (0.52%) CREST Certified
Quality Assurance & Compliance
1 65 (6.74%) QA
2 21 (2.18%) Data Quality
3 11 (1.14%) SLA
4 9 (0.93%) PMO
5 7 (0.73%) GDPR
6 6 (0.62%) Cyber Essentials
6 6 (0.62%) PCI DSS
7 5 (0.52%) ISO/IEC 20000
8 3 (0.31%) ISO/IEC 27001
9 2 (0.21%) Accessibility
9 2 (0.21%) GxP
9 2 (0.21%) MiFID
10 1 (0.10%) Actionable Recommendations
10 1 (0.10%) Dodd-Frank
10 1 (0.10%) GRC
10 1 (0.10%) HIPAA
10 1 (0.10%) Solvency II
System Software
1 30 (3.11%) Docker
2 7 (0.73%) Active Directory
3 5 (0.52%) Hyper-V
3 5 (0.52%) VMware Infrastructure
4 4 (0.41%) Virtual Machines
5 3 (0.31%) vSphere
Systems Management
1 28 (2.90%) Kubernetes
2 15 (1.56%) Terraform
3 8 (0.83%) Ansible
4 6 (0.62%) Kustomize
5 5 (0.52%) Microsoft Intune
6 1 (0.10%) Grafana
6 1 (0.10%) SCCM
6 1 (0.10%) Systems Management Server (SMS)
Vendors
1 89 (9.23%) Microsoft
2 62 (6.43%) SAP
3 60 (6.22%) Oracle
4 46 (4.77%) Salesforce
5 43 (4.46%) ServiceNow
6 13 (1.35%) Xamarin
7 12 (1.24%) Guidewire
8 11 (1.14%) Cisco
8 11 (1.14%) Google
8 11 (1.14%) Juniper
9 10 (1.04%) Sage
10 9 (0.93%) Epicor
10 9 (0.93%) Pega
11 8 (0.83%) Databricks
11 8 (0.83%) VMware
12 6 (0.62%) BeyondTrust
12 6 (0.62%) CyberArk
12 6 (0.62%) Okta
12 6 (0.62%) Salesforce Marketing Cloud
12 6 (0.62%) Sawtooth Software