Local Government (Local Authority, Local Council)
UK

The table below looks at the prevalence of the term Local Government in permanent job vacancies. Included is a benchmarking guide to the salaries offered in vacancies that have cited Local Government over the 6 months to 29 November 2023 with a comparison to the same period over the previous 2 years.

6 months to
29 Nov 2023
Same period 2022 Same period 2021
Rank 223 473 645
Rank change year-on-year +250 +172 -139
Permanent jobs citing Local Government 841 848 505
As % of all permanent jobs advertised in the UK 1.55% 0.67% 0.39%
As % of the General category 2.36% 0.98% 0.65%
Number of salaries quoted 645 526 297
10th Percentile - £30,288 £27,250
25th Percentile £25,000 £38,386 £31,250
Median annual salary (50th Percentile) £26,500 £42,773 £42,230
Median % change year-on-year -38.05% +1.29% -15.54%
75th Percentile £43,750 £61,718 £53,750
90th Percentile £60,000 £73,750 £70,000
UK excluding London median annual salary £26,500 £39,500 £39,810
% change year-on-year -32.91% -0.78% -15.75%

All General Skills
UK

Local Government is in the General Skills category. The following table is for comparison with the above and provides summary statistics for all permanent job vacancies with a requirement for common skills.

Permanent vacancies with a requirement for common skills 35,601 86,161 77,362
As % of all permanent jobs advertised in the UK 65.80% 68.47% 59.94%
Number of salaries quoted 24,969 49,279 47,539
10th Percentile £30,750 £32,500 £31,500
25th Percentile £42,500 £45,000 £42,000
Median annual salary (50th Percentile) £60,000 £60,000 £57,500
Median % change year-on-year - +4.35% +4.55%
75th Percentile £80,000 £82,500 £78,750
90th Percentile £100,000 £100,000 £97,500
UK excluding London median annual salary £50,000 £52,500 £49,000
% change year-on-year -4.76% +7.14% +3.16%

Local Government
Job Vacancy Trend

Job postings citing Local Government as a proportion of all IT jobs advertised.
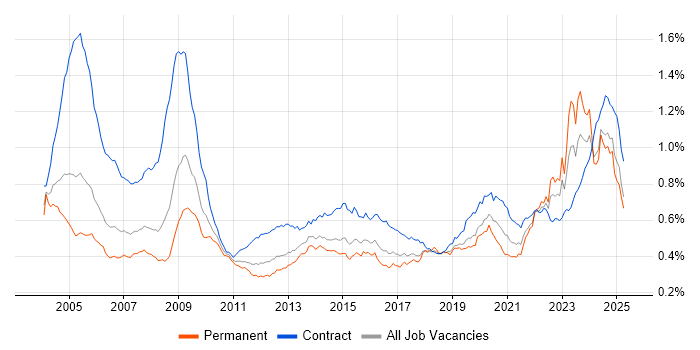
Job vacancy trend for Local Government in the UK

Local Government
Salary Trend

3-month moving average salary quoted in jobs citing Local Government.

Salary trend for Local Government in the UK

Local Government
Salary Histogram

Salary distribution for jobs citing Local Government over the 6 months to 29 November 2023.

Salary histogram for Local Government in the UK

Local Government
Top 17 Job Locations

The table below looks at the demand and provides a guide to the median salaries quoted in IT jobs citing Local Government within the UK over the 6 months to 29 November 2023. The 'Rank Change' column provides an indication of the change in demand within each location based on the same 6 month period last year.

Location Rank Change
on Same Period
Last Year
Matching
Permanent
IT Job Ads
Median Salary
Past 6 Months
Median Salary
% Change
on Same Period
Last Year
Live
Jobs
UK excluding London +180 612 £26,500 -32.91% 274
England +217 518 £30,000 -31.03% 382
Work from Home +144 250 £51,814 +4.00% 152
Scotland +143 243 £25,000 -36.42% 26
London +259 171 £37,500 -34.50% 153
Midlands +221 155 £26,500 -39.08% 55
West Midlands +197 114 £26,500 -39.08% 27
North of England +16 80 £30,000 -24.60% 52
South West +83 59 £42,500 +12.09% 43
Wales +26 49 £41,598 +5.79% 10
North West +16 46 £45,500 +8.08% 32
East Midlands +70 40 £26,500 -42.60% 28
Yorkshire +71 28 £30,000 -22.08% 18
South East +108 27 £42,784 +0.67% 69
East of England +83 8 £43,685 +11.10% 28
North East +31 6 £25,000 -36.42% 3
Northern Ireland +23 4 £29,993 -23.72% 1

Local Government
Co-occurring Skills and Capabilities by Category

The follow tables expand on the table above by listing co-occurrences grouped by category. The same employment type, locality and period is covered with up to 20 co-occurrences shown in each of the following categories:

Application Platforms
1 9 (1.07%) SharePoint
2 6 (0.71%) MS Exchange
3 2 (0.24%) Apache
3 2 (0.24%) Apache Spark
Applications
1 25 (2.97%) Microsoft Office
2 20 (2.38%) Microsoft Excel
3 7 (0.83%) AutoCAD
4 4 (0.48%) Microsoft PowerPoint
5 3 (0.36%) Microsoft Project
6 2 (0.24%) Spreadsheet
7 1 (0.12%) Oracle Smart View
7 1 (0.12%) SOLIDWORKS
Business Applications
1 3 (0.36%) Academy Revenues and Benefits
2 1 (0.12%) Academy Housing
2 1 (0.12%) Eloqua
2 1 (0.12%) Oracle ERP
2 1 (0.12%) Siebel CRM
2 1 (0.12%) Sparx Enterprise Architect
Cloud Services
1 41 (4.88%) Azure
2 39 (4.64%) Google Sheets
3 30 (3.57%) SaaS
4 29 (3.45%) Microsoft 365
5 15 (1.78%) AWS
6 10 (1.19%) Power Platform
7 6 (0.71%) Cloud Computing
7 6 (0.71%) Entra ID
7 6 (0.71%) Google Workspace
8 4 (0.48%) Azure Stack
9 3 (0.36%) Azure Monitor
10 2 (0.24%) OneDrive
10 2 (0.24%) Oracle CX
10 2 (0.24%) Oracle Service Cloud
10 2 (0.24%) Power Automate
10 2 (0.24%) PowerApps
11 1 (0.12%) Dynamics 365
11 1 (0.12%) GCP
11 1 (0.12%) PaaS
11 1 (0.12%) WhatsApp
Communications & Networking
1 357 (42.45%) Broadband
2 15 (1.78%) LAN
3 14 (1.66%) Internet
3 14 (1.66%) Network Security
4 13 (1.55%) WAN
5 10 (1.19%) Wireless
6 9 (1.07%) Firewall
7 6 (0.71%) MPLS
8 5 (0.59%) Modbus
8 5 (0.59%) SAN
8 5 (0.59%) Unified Communications
8 5 (0.59%) VPN
8 5 (0.59%) Wi-Fi
8 5 (0.59%) WLAN
9 4 (0.48%) DNS
9 4 (0.48%) SD-WAN
10 3 (0.36%) NAS
10 3 (0.36%) PSTN
10 3 (0.36%) VLAN
11 2 (0.24%) Software-Defined Networking
Database & Business Intelligence
1 19 (2.26%) Oracle Database
2 16 (1.90%) Relational Database
3 8 (0.95%) GIS
3 8 (0.95%) Power BI
4 7 (0.83%) SQL Server
5 4 (0.48%) Tableau
6 3 (0.36%) RDBMS
7 2 (0.24%) Data Lake
8 1 (0.12%) Data Warehouse
8 1 (0.12%) Electronic Patient Records
8 1 (0.12%) MySQL
8 1 (0.12%) Oracle BI Publisher
8 1 (0.12%) Oracle Reports
8 1 (0.12%) SQL Server Integration Services
Development Applications
1 19 (2.26%) Oracle APEX
2 1 (0.12%) ERwin
2 1 (0.12%) JIRA
General
1 487 (57.91%) Social Skills
2 373 (44.35%) Retail
3 356 (42.33%) Telecoms
4 313 (37.22%) Games
5 140 (16.65%) Analytical Skills
6 87 (10.34%) Public Sector
7 71 (8.44%) Finance
8 58 (6.90%) Inclusion and Diversity
9 46 (5.47%) Police
10 36 (4.28%) Social Housing
11 15 (1.78%) Presentation Skills
12 12 (1.43%) Fire and Rescue
13 10 (1.19%) Legal
14 8 (0.95%) Organisational Skills
15 7 (0.83%) Influencing Skills
16 6 (0.71%) Manufacturing
17 5 (0.59%) Marketing
18 4 (0.48%) Back Office
18 4 (0.48%) Electronics
18 4 (0.48%) Military
Job Titles
1 193 (22.95%) Consultant
2 179 (21.28%) Development Manager
3 177 (21.05%) Business Development Manager
3 177 (21.05%) Business Manager
3 177 (21.05%) Enterprise Consultant
4 130 (15.46%) Analyst
5 75 (8.92%) Digital Analyst
6 73 (8.68%) Operations Analyst
7 60 (7.13%) Senior
8 36 (4.28%) Programmer
9 25 (2.97%) Developer
10 24 (2.85%) Architect
11 23 (2.73%) Lead
12 21 (2.50%) Service Manager
13 19 (2.26%) Audit Manager
13 19 (2.26%) Oracle Developer
13 19 (2.26%) PL/SQL Developer
13 19 (2.26%) Project Manager
14 18 (2.14%) Business Intelligence Analyst
14 18 (2.14%) SQL Developer
Libraries, Frameworks & Software Standards
1 23 (2.73%) HTML
2 20 (2.38%) CSS
2 20 (2.38%) JSON
2 20 (2.38%) XML
3 19 (2.26%) REST
3 19 (2.26%) Ruby on Rails
3 19 (2.26%) SOAP
3 19 (2.26%) Web Services
4 9 (1.07%) .NET
5 3 (0.36%) EDI
6 2 (0.24%) .NET Framework
6 2 (0.24%) ASP.NET
6 2 (0.24%) HTML5
6 2 (0.24%) Sass
7 1 (0.12%) Core Animation
7 1 (0.12%) jQuery
7 1 (0.12%) Laravel
7 1 (0.12%) Node.js
7 1 (0.12%) React
7 1 (0.12%) React Native
Miscellaneous
1 98 (11.65%) Management Information System
2 37 (4.40%) Housing Association
2 37 (4.40%) NHS
3 32 (3.80%) Self-Motivation
4 31 (3.69%) PDA
5 26 (3.09%) Data Centre
6 12 (1.43%) IoT
7 11 (1.31%) Data Protection Act
7 11 (1.31%) Driving Licence
8 9 (1.07%) CCTV
8 9 (1.07%) Smart City
9 7 (0.83%) Onboarding
10 6 (0.71%) Smartphone
11 5 (0.59%) CAN bus
11 5 (0.59%) Cyberattack
11 5 (0.59%) Embedded Systems
11 5 (0.59%) Operational Technology
11 5 (0.59%) SCADA
12 4 (0.48%) Freedom of Information
13 3 (0.36%) PMI
Operating Systems
1 26 (3.09%) Windows
2 9 (1.07%) Android
3 8 (0.95%) Windows 10
4 6 (0.71%) Windows Server
5 4 (0.48%) Apple iOS
5 4 (0.48%) Linux
6 3 (0.36%) Unix
7 2 (0.24%) Windows 7
7 2 (0.24%) Windows 8
Processes & Methodologies
1 435 (51.72%) Decision-Making
2 395 (46.97%) Customer Experience
3 361 (42.93%) Collaborative Working
4 356 (42.33%) B2B
4 356 (42.33%) B2C
5 197 (23.42%) Business Development
6 110 (13.08%) Customer Service
7 93 (11.06%) Problem-Solving
8 91 (10.82%) Artificial Intelligence
9 62 (7.37%) Agile
10 56 (6.66%) Service Delivery
11 54 (6.42%) Project Management
12 46 (5.47%) ITIL
13 43 (5.11%) Service Management
14 42 (4.99%) Line Management
15 37 (4.40%) CRM
16 36 (4.28%) Case Management
16 36 (4.28%) Roadmaps
17 32 (3.80%) Project Delivery
18 30 (3.57%) Continuous Improvement
Programming Languages
1 41 (4.88%) SQL
2 25 (2.97%) Java
3 21 (2.50%) PL/SQL
4 20 (2.38%) JavaScript
5 19 (2.26%) Ruby
6 13 (1.55%) Python
7 6 (0.71%) PowerShell
8 4 (0.48%) C#
9 3 (0.36%) R
10 2 (0.24%) Data Analysis Expressions
10 2 (0.24%) PHP
11 1 (0.12%) Kotlin
11 1 (0.12%) MATLAB
11 1 (0.12%) Objective-C
11 1 (0.12%) Swift
11 1 (0.12%) TypeScript
11 1 (0.12%) VB
Qualifications
1 115 (13.67%) Degree
2 62 (7.37%) DBS Check
3 48 (5.71%) Security Cleared
4 39 (4.64%) SC Cleared
5 19 (2.26%) ACCA
6 17 (2.02%) Chartered Engineer
7 11 (1.31%) BPSS Clearance
8 10 (1.19%) Master's Degree
9 9 (1.07%) HNC
10 8 (0.95%) CISSP
10 8 (0.95%) ITIL Certification
11 7 (0.83%) Cisco Certification
12 6 (0.71%) AWS Certification
12 6 (0.71%) CEH
12 6 (0.71%) CISM
12 6 (0.71%) GIAC
12 6 (0.71%) HND
12 6 (0.71%) ISSAP
12 6 (0.71%) Microsoft Certification
12 6 (0.71%) PMI Certification
Quality Assurance & Compliance
1 43 (5.11%) Data Quality
2 17 (2.02%) QA
3 14 (1.66%) GDPR
4 13 (1.55%) Cyber Essentials
5 12 (1.43%) NIST
5 12 (1.43%) PMO
6 8 (0.95%) Cyber Essentials PLUS
7 6 (0.71%) IASME
7 6 (0.71%) NCSC
8 5 (0.59%) NIST 800
9 4 (0.48%) SLA
10 3 (0.36%) GAAP
10 3 (0.36%) IFRS
11 2 (0.24%) COBIT
11 2 (0.24%) ISO/IEC 27001
11 2 (0.24%) RMADS
12 1 (0.12%) Accessibility
12 1 (0.12%) ISO 9001
System Software
1 24 (2.85%) Active Directory
2 5 (0.59%) Virtual Servers
2 5 (0.59%) VMware Infrastructure
3 3 (0.36%) Firmware
3 3 (0.36%) Virtual Desktop
4 2 (0.24%) Microsoft Virtual Server
4 2 (0.24%) vSphere
5 1 (0.12%) BitLocker
5 1 (0.12%) Docker
Systems Management
1 18 (2.14%) Microsoft Intune
2 9 (1.07%) SCCM
3 8 (0.95%) Nessus
4 3 (0.36%) SCOM
5 2 (0.24%) Single Sign-On
5 2 (0.24%) SmoothWall
Vendors
1 354 (42.09%) BT
2 87 (10.34%) Microsoft
3 49 (5.83%) Google
4 35 (4.16%) Capita
5 28 (3.33%) Oracle
6 19 (2.26%) CA
7 10 (1.19%) SolarWinds
8 9 (1.07%) ServiceNow
9 8 (0.95%) Darktrace
9 8 (0.95%) NEC
9 8 (0.95%) OneTrust
9 8 (0.95%) Remedy
10 7 (0.83%) Cisco
10 7 (0.83%) VMware
11 5 (0.59%) Apple
11 5 (0.59%) Citrix
12 4 (0.48%) Facebook
13 3 (0.36%) HP
13 3 (0.36%) Motorola
14 2 (0.24%) Dell