Marketing Jobs

Marketing
UK

The table below looks at the prevalence of the term Marketing in permanent job vacancies. Included is a benchmarking guide to the salaries offered in vacancies that cited Marketing over the 6 months leading up to 18 July 2025, comparing them to the same period in the previous two years.

6 months to
18 Jul 2025
Same period 2024 Same period 2023
Rank 29 31 70
Rank change year-on-year +2 +39 -28
Permanent jobs citing Marketing 4,226 5,714 3,592
As % of all permanent jobs advertised in the UK 7.03% 5.71% 4.26%
As % of the General category 10.36% 9.93% 6.43%
Number of salaries quoted 1,434 2,728 2,031
10th Percentile £26,500 £27,000 £31,250
25th Percentile £31,250 £32,500 £37,500
Median annual salary (50th Percentile) £49,570 £45,000 £55,000
Median % change year-on-year +10.16% -18.18% -
75th Percentile £67,500 £63,750 £72,500
90th Percentile £90,000 £82,500 £87,500
UK excluding London median annual salary £40,000 £42,500 £42,500
% change year-on-year -5.88% - -10.53%

All General Skills
UK

Marketing falls under the General Skills category. For comparison with the information above, the following table provides summary statistics for all permanent job vacancies requiring common skills.

Permanent vacancies with a requirement for common skills 40,795 57,553 55,858
As % of all permanent jobs advertised in the UK 67.85% 57.56% 66.22%
Number of salaries quoted 20,127 36,571 34,073
10th Percentile £26,000 £28,000 £32,200
25th Percentile £35,000 £37,199 £42,750
Median annual salary (50th Percentile) £54,793 £52,500 £60,000
Median % change year-on-year +4.37% -12.50% -
75th Percentile £73,750 £72,500 £80,627
90th Percentile £96,250 £95,000 £101,250
UK excluding London median annual salary £47,683 £47,500 £52,500
% change year-on-year +0.39% -9.52% +5.00%

Marketing
Job Vacancy Trend

Job postings citing Marketing as a proportion of all IT jobs advertised.
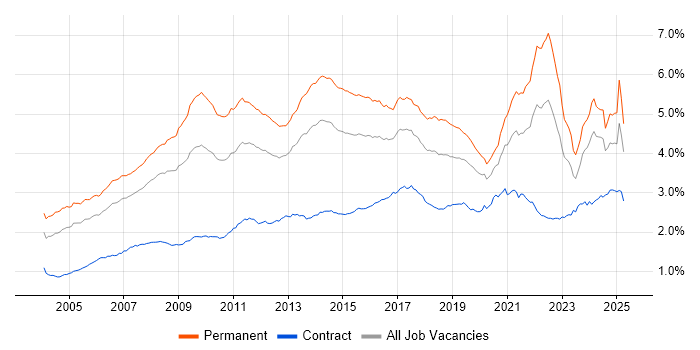
Job vacancy trend for Marketing in the UK

Marketing
Salary Trend

3-month moving average salary quoted in jobs citing Marketing.

Salary trend for Marketing in the UK

Marketing
Salary Histogram

Salary distribution for jobs citing Marketing over the 6 months to 18 July 2025.

Salary histogram for Marketing in the UK

Marketing
Top 18 Job Locations

The table below looks at the demand and provides a guide to the median salaries quoted in IT jobs citing Marketing within the UK over the 6 months to 18 July 2025. The 'Rank Change' column provides an indication of the change in demand within each location based on the same 6 month period last year.

Location Rank Change
on Same Period
Last Year
Matching
Permanent
IT Job Ads
Median Salary
Past 6 Months
Median Salary
% Change
on Same Period
Last Year
Live
Jobs
England +9 3,681 £47,500 +5.56% 5,813
UK excluding London -1 2,678 £40,000 -5.88% 2,354
Work from Home -5 1,248 £49,070 +9.04% 2,571
London +6 1,179 £65,000 +18.18% 3,793
North of England +13 975 £42,500 - 628
Yorkshire +25 703 £43,500 +4.82% 243
South East +5 675 £35,000 -13.58% 763
East of England +18 330 £37,000 -17.78% 204
Midlands -25 292 £35,000 -12.50% 390
North West -71 211 £40,000 -11.11% 338
South West +21 207 £38,000 -12.64% 240
West Midlands -11 174 £40,000 -11.11% 227
Scotland -43 140 £48,750 +8.33% 102
East Midlands -38 116 £29,500 -21.33% 157
North East +53 59 £30,000 - 55
Wales +40 46 £50,000 - 54
Northern Ireland +6 10 £30,000 -14.29% 22
Channel Islands +1 3 £80,000 +18.52% 2

Marketing
Co-occurring Skills and Capabilities by Category

The follow tables expand on the table above by listing co-occurrences grouped by category. The same employment type, locality and period is covered with up to 20 co-occurrences shown in each of the following categories:

Application Platforms
1 189 (4.47%) CMS
2 88 (2.08%) WordPress
3 28 (0.66%) SharePoint
4 25 (0.59%) Apache Spark
5 20 (0.47%) Confluence
6 17 (0.40%) Drupal
7 15 (0.35%) Apache Airflow
8 13 (0.31%) Microsoft Exchange
9 10 (0.24%) Headless CMS
10 9 (0.21%) Apache
10 9 (0.21%) Umbraco
11 8 (0.19%) Camunda
11 8 (0.19%) Oracle Workflow
12 5 (0.12%) Skype for Business
13 4 (0.095%) Apache Pulsar
13 4 (0.095%) Cloud Foundry
13 4 (0.095%) IIS
13 4 (0.095%) Kentico
14 3 (0.071%) Adobe Experience Manager
14 3 (0.071%) EPiServer
Applications
1 556 (13.16%) Microsoft Excel
2 303 (7.17%) Microsoft Office
3 83 (1.96%) Photoshop
4 79 (1.87%) Microsoft PowerPoint
5 66 (1.56%) Adobe Creative Suite
6 41 (0.97%) Adobe Illustrator
7 36 (0.85%) Adobe Premiere
8 32 (0.76%) InDesign
9 25 (0.59%) Chatbot
10 17 (0.40%) Adobe After Effects
10 17 (0.40%) Maya
11 12 (0.28%) Adobe XD
11 12 (0.28%) Spreadsheet
12 10 (0.24%) Microsoft Project
13 9 (0.21%) Final Cut Pro
13 9 (0.21%) MS Visio
14 8 (0.19%) CINEMA 4D
14 8 (0.19%) Sketch
14 8 (0.19%) Trello
15 6 (0.14%) Blender
Business Applications
1 80 (1.89%) Dynamics CRM
2 73 (1.73%) Shopify
3 30 (0.71%) Magento
4 22 (0.52%) Salesforce CRM
5 17 (0.40%) NetSuite
6 15 (0.35%) Payment Gateway
7 12 (0.28%) Academy Revenues and Benefits
7 12 (0.28%) SAP S/4HANA
8 11 (0.26%) Adobe Campaign
9 9 (0.21%) Dynamics GP
10 7 (0.17%) Dynamics AX
11 5 (0.12%) Dynamics NAV
12 4 (0.095%) Remedy ITSM
13 3 (0.071%) Raiser’s Edge
13 3 (0.071%) SAP CX
14 2 (0.047%) Odoo
15 1 (0.024%) CiviCRM
15 1 (0.024%) FastStats PeopleStage
15 1 (0.024%) iTrent
15 1 (0.024%) Workfront
Cloud Services
1 288 (6.81%) Google Analytics
2 275 (6.51%) AWS
3 253 (5.99%) Azure
4 240 (5.68%) SaaS
5 191 (4.52%) Power Platform
6 158 (3.74%) GCP
7 136 (3.22%) Google Ads
8 73 (1.73%) Dynamics 365
9 60 (1.42%) Microsoft 365
10 56 (1.33%) Canva
11 47 (1.11%) Serverless
12 42 (0.99%) Figma
13 39 (0.92%) PaaS
14 38 (0.90%) Salesforce Sales Cloud
15 37 (0.88%) AWS Lambda
16 33 (0.78%) Google Sheets
16 33 (0.78%) iPaaS
17 31 (0.73%) Azure DevOps
18 30 (0.71%) Google Tag Manager
19 29 (0.69%) GitHub
Communications & Networking
1 41 (0.97%) Network Security
2 18 (0.43%) Firewall
2 18 (0.43%) Intranet
3 16 (0.38%) DNS
3 16 (0.38%) VPN
4 14 (0.33%) LAN
4 14 (0.33%) WAN
4 14 (0.33%) Wi-Fi
5 13 (0.31%) Wireless
6 12 (0.28%) 5G
6 12 (0.28%) Broadband
6 12 (0.28%) SMS
6 12 (0.28%) WPA
7 9 (0.21%) VoIP
8 8 (0.19%) Internet
8 8 (0.19%) VLAN
9 7 (0.17%) Ethernet
9 7 (0.17%) HTTP
9 7 (0.17%) PSTN
10 6 (0.14%) Unified Communications
Database & Business Intelligence
1 137 (3.24%) Power BI
2 89 (2.11%) Tableau
3 74 (1.75%) Big Data
4 65 (1.54%) Data Warehouse
5 55 (1.30%) Relational Database
6 49 (1.16%) MySQL
7 40 (0.95%) Looker
8 39 (0.92%) NoSQL
8 39 (0.92%) PostgreSQL
9 36 (0.85%) BigQuery
10 35 (0.83%) Metadata
11 29 (0.69%) MongoDB
12 27 (0.64%) SQL Server
13 26 (0.62%) Data Lake
14 15 (0.35%) RDBMS
14 15 (0.35%) Tick Data
15 14 (0.33%) Electronic Patient Records
15 14 (0.33%) Power Query
16 13 (0.31%) Amazon RDS
17 11 (0.26%) DynamoDB
Development Applications
1 72 (1.70%) Git
2 64 (1.51%) JIRA
3 41 (0.97%) Jenkins
4 14 (0.33%) GitLab
5 12 (0.28%) JUnit
5 12 (0.28%) Selenium
5 12 (0.28%) Spinnaker
6 11 (0.26%) Vite
7 9 (0.21%) webpack
8 8 (0.19%) Cypress.io
8 8 (0.19%) Visual Studio
9 7 (0.17%) ER Studio
9 7 (0.17%) Locust
10 6 (0.14%) Maven
11 5 (0.12%) Bazaar
11 5 (0.12%) Gradle
12 4 (0.095%) Axure RP
12 4 (0.095%) Terragrunt
12 4 (0.095%) WaveMaker
12 4 (0.095%) YouTrack
General
1 2,262 (53.53%) Social Skills
2 1,541 (36.46%) Finance
3 835 (19.76%) Manufacturing
4 804 (19.03%) Analytical Skills
5 799 (18.91%) Electronics
6 504 (11.93%) Law
7 487 (11.52%) Public Sector
8 448 (10.60%) Presentation Skills
9 431 (10.20%) Inclusion and Diversity
10 397 (9.39%) Advertising
11 318 (7.52%) Retail
12 294 (6.96%) Legal
13 240 (5.68%) Organisational Skills
14 213 (5.04%) Telecoms
15 86 (2.04%) Games
16 70 (1.66%) Banking
16 70 (1.66%) Brand Awareness
17 57 (1.35%) Influencing Skills
18 47 (1.11%) Publishing
19 43 (1.02%) German Language
Job Titles
1 440 (10.41%) Development Manager
2 422 (9.99%) Senior
3 410 (9.70%) Business Manager
4 382 (9.04%) Business Development Manager
5 299 (7.08%) Lead
6 227 (5.37%) Product Manager
7 203 (4.80%) Analyst
8 196 (4.64%) Software Engineer
9 195 (4.61%) Developer
10 173 (4.09%) Senior Manager
11 157 (3.72%) Account Manager
12 140 (3.31%) Technical Manager
13 136 (3.22%) Help Desk Manager
14 132 (3.12%) Architect
15 131 (3.10%) Customer Executive
16 128 (3.03%) Coordinator
17 123 (2.91%) Marketing Manager
18 106 (2.51%) Consultant
19 103 (2.44%) Products Support Manager
20 101 (2.39%) Support Manager
Libraries, Frameworks & Software Standards
1 148 (3.50%) HTML
2 125 (2.96%) CSS
3 102 (2.41%) REST
4 99 (2.34%) React
5 65 (1.54%) RESTful
6 64 (1.51%) Spring
7 55 (1.30%) Node.js
8 44 (1.04%) Lightning Web Components
9 42 (0.99%) Kafka
10 41 (0.97%) Spring Boot
11 39 (0.92%) AngularJS
12 35 (0.83%) SOAP
13 34 (0.80%) .NET
14 28 (0.66%) Flask
15 27 (0.64%) Middleware
15 27 (0.64%) Vue
16 24 (0.57%) XML
17 23 (0.54%) JSON
18 22 (0.52%) Django
19 21 (0.50%) OAuth
Miscellaneous
1 389 (9.20%) Social Media
2 219 (5.18%) Self-Motivation
3 147 (3.48%) Marketing Technology
4 146 (3.45%) Digital Media
5 119 (2.82%) Algorithms
5 119 (2.82%) Product Ownership
6 110 (2.60%) Analytical Mindset
7 107 (2.53%) Onboarding
8 104 (2.46%) Cloud Native
8 104 (2.46%) Management Information System
9 103 (2.44%) FMCG
10 84 (1.99%) Blog
11 68 (1.61%) Driving Licence
12 49 (1.16%) Enterprise Software
13 44 (1.04%) Graphic Design
14 37 (0.88%) Greenfield Project
14 37 (0.88%) Video Editing
15 36 (0.85%) Mobile App
16 32 (0.76%) Data Centre
17 30 (0.71%) Data Structures
Operating Systems
1 52 (1.23%) Windows
2 30 (0.71%) Linux
3 16 (0.38%) Windows Server
4 15 (0.35%) Unix
5 12 (0.28%) Windows Vista
6 11 (0.26%) Android
7 9 (0.21%) Apple iOS
8 5 (0.12%) Mac OS X
9 4 (0.095%) Red Hat Enterprise Linux
9 4 (0.095%) Ubuntu
10 2 (0.047%) Mac OS
11 1 (0.024%) Robot Operating System
11 1 (0.024%) Solaris
11 1 (0.024%) Windows 10
11 1 (0.024%) Windows Server 2016
Processes & Methodologies
1 883 (20.89%) CRM
2 796 (18.84%) Analytics
3 794 (18.79%) Business Development
4 791 (18.72%) Digital Marketing
5 676 (16.00%) Continuous Improvement
6 614 (14.53%) Problem-Solving
7 610 (14.43%) Decision-Making
8 598 (14.15%) Agile
9 552 (13.06%) Collaborative Working
10 536 (12.68%) Marketing Strategy
11 486 (11.50%) Artificial Intelligence
12 456 (10.79%) Project Management
13 422 (9.99%) Line Management
14 418 (9.89%) Collaborative Culture
15 389 (9.20%) E-Commerce
16 378 (8.94%) B2B
17 358 (8.47%) Supply Chain Management
18 350 (8.28%) SEO
19 344 (8.14%) Data Entry
20 334 (7.90%) Business Intelligence
Programming Languages
1 331 (7.83%) Python
2 286 (6.77%) SQL
3 158 (3.74%) Java
4 146 (3.45%) JavaScript
5 60 (1.42%) TypeScript
6 46 (1.09%) C#
7 42 (0.99%) Apex Code
8 27 (0.64%) C++
9 26 (0.62%) R
10 22 (0.52%) PHP
11 20 (0.47%) C
11 20 (0.47%) Go
12 15 (0.35%) Kotlin
12 15 (0.35%) PowerShell
13 12 (0.28%) Shell Script
14 11 (0.26%) PL/SQL
15 9 (0.21%) Data Analysis Expressions
16 8 (0.19%) VBA
17 7 (0.17%) Bash
18 6 (0.14%) Rust
Qualifications
1 1,249 (29.56%) Degree
2 125 (2.96%) Security Cleared
3 90 (2.13%) Master's Degree
4 78 (1.85%) Computer Science Degree
5 69 (1.63%) DBS Check
6 67 (1.59%) PMI Certification
7 63 (1.49%) SC Cleared
8 53 (1.25%) CISSP
9 44 (1.04%) DV Cleared
10 41 (0.97%) PMP
11 29 (0.69%) Microsoft Certification
12 26 (0.62%) AWS Certification
13 19 (0.45%) Azure Certification
13 19 (0.45%) CompTIA Security+
14 18 (0.43%) CEH
15 16 (0.38%) ACCA
16 14 (0.33%) AWS Certified Cloud Practitioner
16 14 (0.33%) MBA
17 13 (0.31%) CIMA
18 12 (0.28%) HND
Quality Assurance & Compliance
1 168 (3.98%) QA
2 126 (2.98%) GDPR
3 116 (2.74%) Accessibility
4 92 (2.18%) Data Quality
5 42 (0.99%) ISO/IEC 27001
6 41 (0.97%) SLA
7 36 (0.85%) Actionable Recommendations
8 31 (0.73%) Cyber Essentials
9 30 (0.71%) PCI DSS
10 26 (0.62%) Cyber Essentials PLUS
11 24 (0.57%) NIST
12 16 (0.38%) ITGC
13 14 (0.33%) PMO
14 10 (0.24%) California Consumer Privacy Act
14 10 (0.24%) WCAG
15 6 (0.14%) 21 CFR Part 11
15 6 (0.14%) PERC
16 5 (0.12%) ISO 9001
16 5 (0.12%) SOC 2
17 4 (0.095%) Good Clinical Practice
System Software
1 120 (2.84%) Docker
2 18 (0.43%) Active Directory
3 10 (0.24%) Firmware
4 7 (0.17%) ProxySG
4 7 (0.17%) VMware Infrastructure
5 6 (0.14%) Embedded Firmware
6 5 (0.12%) HDFS
7 4 (0.095%) Hyper-V
7 4 (0.095%) Virtual Machines
8 2 (0.047%) VMware ESXi
9 1 (0.024%) Varnish
9 1 (0.024%) vSphere
Systems Management
1 133 (3.15%) Kubernetes
2 67 (1.59%) Terraform
3 30 (0.71%) Ansible
4 19 (0.45%) Grafana
5 13 (0.31%) Prometheus
5 13 (0.31%) Single Sign-On
6 11 (0.26%) Argo
7 9 (0.21%) Microsoft Intune
8 5 (0.12%) Automic
8 5 (0.12%) Jamf Pro
8 5 (0.12%) Puppet
9 4 (0.095%) Matomo
9 4 (0.095%) Netcool
9 4 (0.095%) Netcool/OMNIbus
9 4 (0.095%) Salt
9 4 (0.095%) Systems Management Server (SMS)
9 4 (0.095%) Tivoli
10 3 (0.071%) CASB
10 3 (0.071%) EMC NetWorker
11 2 (0.047%) vCenter Server
Vendors
1 531 (12.57%) SAP
2 472 (11.17%) Google
3 406 (9.61%) Microsoft
4 395 (9.35%) Salesforce
5 195 (4.61%) Adobe
6 100 (2.37%) Facebook
7 94 (2.22%) YouTube
8 75 (1.77%) HubSpot
9 69 (1.63%) Cisco
10 68 (1.61%) Dell
11 66 (1.56%) Oracle
11 66 (1.56%) Salesforce Marketing Cloud
12 63 (1.49%) Instagram
13 51 (1.21%) TikTok
14 49 (1.16%) Databricks
15 43 (1.02%) Intel
16 39 (0.92%) Ahrefs
17 31 (0.73%) Screaming Frog
18 29 (0.69%) Splunk
19 25 (0.59%) ServiceNow