National Health Service (NHS)
UK

The table below looks at the prevalence of the term NHS in permanent job vacancies. Included is a benchmarking guide to the salaries offered in vacancies that have cited NHS over the 6 months to 29 November 2023 with a comparison to the same period over the previous 2 years.

6 months to
29 Nov 2023
Same period 2022 Same period 2021
Rank 334 467 473
Rank change year-on-year +133 +6 -1
Permanent jobs citing NHS 468 854 866
As % of all permanent jobs advertised in the UK 0.86% 0.68% 0.67%
As % of the Miscellaneous category 2.33% 1.55% 1.52%
Number of salaries quoted 406 612 581
10th Percentile £31,750 £33,075 £31,774
25th Percentile - £42,500 £41,250
Median annual salary (50th Percentile) £39,085 £55,000 £55,000
Median % change year-on-year -28.94% - -
75th Percentile £55,000 £72,500 £73,750
90th Percentile £66,250 £80,000 £87,500
UK excluding London median annual salary £41,000 £52,500 £50,000
% change year-on-year -21.90% +5.00% -9.09%

All Generic Skills
UK

NHS is in the General and Transferable Skills category. The following table is for comparison with the above and provides summary statistics for all permanent job vacancies with a requirement for generic IT skills.

Permanent vacancies with a requirement for generic IT skills 20,064 55,164 57,045
As % of all permanent jobs advertised in the UK 37.08% 43.84% 44.20%
Number of salaries quoted 14,694 30,402 33,575
10th Percentile £33,500 £34,996 £33,618
25th Percentile £45,000 £46,250 £45,000
Median annual salary (50th Percentile) £62,500 £63,500 £60,000
Median % change year-on-year -1.57% +5.83% -
75th Percentile £84,056 £85,000 £82,500
90th Percentile £107,500 £105,000 £100,000
UK excluding London median annual salary £55,000 £55,000 £50,000
% change year-on-year - +10.00% -

NHS
Job Vacancy Trend

Job postings citing NHS as a proportion of all IT jobs advertised.
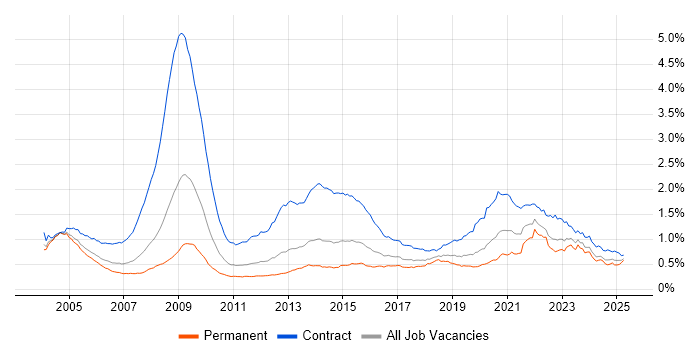
Job vacancy trend for NHS in the UK

NHS
Salary Trend

3-month moving average salary quoted in jobs citing NHS.

Salary trend for NHS in the UK

NHS
Salary Histogram

Salary distribution for jobs citing NHS over the 6 months to 29 November 2023.

Salary histogram for NHS in the UK

NHS
Top 17 Job Locations

The table below looks at the demand and provides a guide to the median salaries quoted in IT jobs citing NHS within the UK over the 6 months to 29 November 2023. The 'Rank Change' column provides an indication of the change in demand within each location based on the same 6 month period last year.

Location Rank Change
on Same Period
Last Year
Matching
Permanent
IT Job Ads
Median Salary
Past 6 Months
Median Salary
% Change
on Same Period
Last Year
Live
Jobs
England +141 422 £39,085 -28.94% 396
UK excluding London +74 280 £41,000 -21.90% 300
London +170 143 £39,085 -38.45% 115
Work from Home +47 143 £50,500 -3.81% 166
South West +62 70 £42,500 -4.85% 36
South East +118 59 £39,085 -34.86% 87
North of England +31 53 £50,000 -4.76% 77
East of England +122 48 £39,085 -8.04% 34
Midlands +93 38 £57,500 +11.65% 51
Yorkshire +55 30 £50,000 -9.09% 30
West Midlands +87 23 £57,500 +21.05% 21
North West +43 15 £44,500 -15.24% 39
East Midlands +50 14 £51,340 -14.43% 29
North East +39 8 £39,005 -12.67% 13
Wales +16 8 £42,000 +0.10% 13
Scotland +44 4 £100,000 +90.48% 9
Channel Islands - 2 - -

NHS
Co-occurring Skills and Capabilities by Category

The follow tables expand on the table above by listing co-occurrences grouped by category. The same employment type, locality and period is covered with up to 20 co-occurrences shown in each of the following categories:

Application Platforms
1 16 (3.42%) SharePoint
2 3 (0.64%) Apache
2 3 (0.64%) IIS
2 3 (0.64%) OpenStack
3 1 (0.21%) Moodle
3 1 (0.21%) Totara
Applications
1 46 (9.83%) Microsoft Office
2 21 (4.49%) Microsoft Excel
3 13 (2.78%) Microsoft PowerPoint
4 12 (2.56%) MS Visio
5 6 (1.28%) Microsoft Project
6 3 (0.64%) Stata
7 2 (0.43%) Spreadsheet
Business Applications
1 11 (2.35%) Dynamics CRM
2 4 (0.85%) Cerner Millennium
2 4 (0.85%) Ringtail
3 2 (0.43%) Orchard Housing
Cloud Services
1 43 (9.19%) AWS
2 36 (7.69%) Azure
3 31 (6.62%) Power Platform
4 25 (5.34%) Microsoft 365
5 10 (2.14%) SaaS
6 9 (1.92%) Dynamics 365
7 8 (1.71%) Cloud Computing
7 8 (1.71%) IaaS
8 2 (0.43%) Snowflake
9 1 (0.21%) Amazon ECS
9 1 (0.21%) AWS Elastic Beanstalk
9 1 (0.21%) Azure Stack
9 1 (0.21%) Azure Synapse Analytics
9 1 (0.21%) Google Ads
9 1 (0.21%) Google Tag Manager
9 1 (0.21%) PaaS
Communications & Networking
1 32 (6.84%) WAN
2 27 (5.77%) Firewall
3 24 (5.13%) LAN
4 23 (4.91%) TCP/IP
5 20 (4.27%) DNS
6 17 (3.63%) DHCP
7 13 (2.78%) VLAN
7 13 (2.78%) VPN
8 5 (1.07%) Cisco Firepower
8 5 (1.07%) Cisco Nexus
9 4 (0.85%) Cisco ASA
9 4 (0.85%) Internet
9 4 (0.85%) Intrusion Detection
9 4 (0.85%) Wireless
9 4 (0.85%) WLAN
10 3 (0.64%) SAN
10 3 (0.64%) VXLAN
11 2 (0.43%) Wi-Fi
12 1 (0.21%) Intranet
12 1 (0.21%) VoIP
Database & Business Intelligence
1 20 (4.27%) Power BI
1 20 (4.27%) SQL Server
2 17 (3.63%) Electronic Patient Records
3 9 (1.92%) Data Warehouse
4 7 (1.50%) MySQL
4 7 (1.50%) SQL Server Reporting Services
5 6 (1.28%) SQL Server Analysis Services
5 6 (1.28%) Tableau
6 5 (1.07%) Microsoft Analysis Services
6 5 (1.07%) MS Access
6 5 (1.07%) OLAP
7 3 (0.64%) BusinessObjects
8 2 (0.43%) Data Lake
8 2 (0.43%) SQL Server Integration Services
9 1 (0.21%) QlikView
9 1 (0.21%) Star Schema
Development Applications
1 10 (2.14%) JIRA
2 4 (0.85%) Git
3 1 (0.21%) Subversion
3 1 (0.21%) Visual Studio
General
1 207 (44.23%) Finance
2 112 (23.93%) Social Skills
3 69 (14.74%) Public Sector
4 68 (14.53%) Analytical Skills
5 37 (7.91%) Local Government
6 28 (5.98%) Retail
7 19 (4.06%) Health Technology
8 12 (2.56%) Inclusion and Diversity
9 11 (2.35%) Marketing
10 8 (1.71%) Organisational Skills
10 8 (1.71%) Telecoms
11 7 (1.50%) Electronics
11 7 (1.50%) Manufacturing
11 7 (1.50%) Presentation Skills
12 6 (1.28%) Tech for Good
13 4 (0.85%) Legal
14 3 (0.64%) Billing
14 3 (0.64%) Digital Health
14 3 (0.64%) Digital Healthcare
14 3 (0.64%) Influencing Skills
Job Titles
1 151 (32.26%) Development Manager
2 141 (30.13%) Business Manager
3 134 (28.63%) Business Development Manager
4 51 (10.90%) Senior
5 38 (8.12%) Developer
6 31 (6.62%) Analyst
7 21 (4.49%) Service Manager
8 20 (4.27%) Project Manager
9 19 (4.06%) Audit Manager
9 19 (4.06%) Quality Manager
10 17 (3.63%) Lead
10 17 (3.63%) Senior Manager
11 16 (3.42%) 3rd Line Engineer
11 16 (3.42%) Audit Support Manager
11 16 (3.42%) Software Engineer
11 16 (3.42%) Support Manager
12 15 (3.21%) .NET Developer
12 15 (3.21%) Delivery Manager
12 15 (3.21%) Service Delivery Manager
13 10 (2.14%) Support Engineer
Libraries, Frameworks & Software Standards
1 19 (4.06%) .NET
2 12 (2.56%) .NET Framework
3 11 (2.35%) CSS
3 11 (2.35%) HTML
4 10 (2.14%) React
5 8 (1.71%) FHIR
6 6 (1.28%) AngularJS
6 6 (1.28%) ASP.NET
7 5 (1.07%) jQuery
7 5 (1.07%) Vue
8 4 (0.85%) Blazor
8 4 (0.85%) MFC
9 3 (0.64%) LDAP
9 3 (0.64%) Node.js
9 3 (0.64%) XML
10 2 (0.43%) .NET Core
10 2 (0.43%) Dojo
10 2 (0.43%) Kafka
10 2 (0.43%) Laravel
10 2 (0.43%) Twitter Bootstrap
Miscellaneous
1 24 (5.13%) Management Information System
2 20 (4.27%) Self-Motivation
3 10 (2.14%) Clustering
4 8 (1.71%) Data Centre
4 8 (1.71%) Freedom of Information
5 7 (1.50%) Data Protection Act
6 6 (1.28%) PKI
7 5 (1.07%) PMI
7 5 (1.07%) SystemC
8 4 (0.85%) Driving Licence
8 4 (0.85%) Housing Association
8 4 (0.85%) Product Ownership
9 3 (0.64%) Cyber Threat
9 3 (0.64%) IoT
9 3 (0.64%) PACS
9 3 (0.64%) Replication
10 2 (0.43%) e-Health
10 2 (0.43%) Enterprise Software
10 2 (0.43%) LIMS
10 2 (0.43%) Social Media
Operating Systems
1 35 (7.48%) Windows
2 18 (3.85%) Windows Server
3 4 (0.85%) Windows 10
4 3 (0.64%) Linux
5 2 (0.43%) Android
5 2 (0.43%) Apple iOS
6 1 (0.21%) Windows Server 2003
6 1 (0.21%) Windows Server 2008
6 1 (0.21%) Windows Vista
Processes & Methodologies
1 170 (36.32%) Service Delivery
2 157 (33.55%) Business Development
3 143 (30.56%) Financial Modelling
4 57 (12.18%) Problem-Solving
5 43 (9.19%) ITIL
6 36 (7.69%) Project Management
7 34 (7.26%) Agile
8 33 (7.05%) Customer Service
9 30 (6.41%) Business Intelligence
10 27 (5.77%) Decision-Making
11 25 (5.34%) Analytics
12 24 (5.13%) Cybersecurity
13 20 (4.27%) Business Strategy
14 18 (3.85%) Continuous Improvement
14 18 (3.85%) Software Engineering
14 18 (3.85%) Stakeholder Management
15 17 (3.63%) PRINCE2
15 17 (3.63%) Service Management
16 16 (3.42%) Business Case
16 16 (3.42%) Validation
Programming Languages
1 29 (6.20%) SQL
2 24 (5.13%) JavaScript
3 17 (3.63%) C#
3 17 (3.63%) Java
4 9 (1.92%) Python
5 5 (1.07%) R
6 4 (0.85%) C++
6 4 (0.85%) T-SQL
7 3 (0.64%) PHP
7 3 (0.64%) TypeScript
8 2 (0.43%) Bash
8 2 (0.43%) PowerShell
8 2 (0.43%) Ruby
9 1 (0.21%) Data Analysis Expressions
9 1 (0.21%) Go
9 1 (0.21%) Kotlin
9 1 (0.21%) MATLAB
Qualifications
1 161 (34.40%) DBS Check
2 69 (14.74%) Degree
3 19 (4.06%) ACCA
4 7 (1.50%) Master's Degree
5 6 (1.28%) CCNA
5 6 (1.28%) Cisco Certification
5 6 (1.28%) ITIL Foundation Certificate
5 6 (1.28%) Security Cleared
6 5 (1.07%) PMI Certification
6 5 (1.07%) SC Cleared
7 4 (0.85%) CCNP
8 3 (0.64%) CISM
8 3 (0.64%) CISSP
9 2 (0.43%) CISA
9 2 (0.43%) Computer Science Degree
9 2 (0.43%) CRISC
9 2 (0.43%) ISACA
9 2 (0.43%) PRINCE2 Certification
10 1 (0.21%) AAT
10 1 (0.21%) Azure Certification
Quality Assurance & Compliance
1 13 (2.78%) GDPR
1 13 (2.78%) QA
2 11 (2.35%) Cyber Essentials
3 10 (2.14%) HL7
3 10 (2.14%) PMO
4 7 (1.50%) Data Quality
4 7 (1.50%) NIST
5 5 (1.07%) GRC
5 5 (1.07%) ISO/IEC 27001
6 4 (0.85%) Accessibility
6 4 (0.85%) Cyber Essentials PLUS
6 4 (0.85%) HMG Security Policy Framework
7 3 (0.64%) DICOM
7 3 (0.64%) GAAP
7 3 (0.64%) IFRS
7 3 (0.64%) ISO 9001
7 3 (0.64%) ISO/IEC 17025
7 3 (0.64%) NCSC
7 3 (0.64%) SLA
8 2 (0.43%) COBIT
System Software
1 24 (5.13%) Active Directory
2 10 (2.14%) Terminal Services
2 10 (2.14%) VMware Infrastructure
3 4 (0.85%) Docker
4 3 (0.64%) Ceph
4 3 (0.64%) KVM
5 1 (0.21%) Hyper-V
5 1 (0.21%) VMware ESXi
Systems Management
1 13 (2.78%) FortiGate
2 12 (2.56%) Microsoft Intune
3 10 (2.14%) Active Directory Federation Services
3 10 (2.14%) Microsoft Clustering
4 4 (0.85%) Kubernetes
5 3 (0.64%) Single Sign-On
6 2 (0.43%) AirWatch
6 2 (0.43%) SCCM
6 2 (0.43%) Terraform
7 1 (0.21%) Ansible
Vendors
1 81 (17.31%) Microsoft
2 19 (4.06%) CA
3 17 (3.63%) VMware
4 12 (2.56%) Cisco
5 10 (2.14%) Citrix
5 10 (2.14%) SonicWALL
6 9 (1.92%) Cerner
7 7 (1.50%) SAP
8 4 (0.85%) Aruba
8 4 (0.85%) MEDITECH
8 4 (0.85%) Nuix
9 3 (0.64%) Barracuda Networks
9 3 (0.64%) Dell
9 3 (0.64%) Nimble Storage
9 3 (0.64%) Red Hat
9 3 (0.64%) Sophos
9 3 (0.64%) Veeam
10 2 (0.43%) Apple
10 2 (0.43%) Symantec
10 2 (0.43%) Toshiba