Autodesk AutoCAD
UK

The following table provides summary statistics for permanent job vacancies with a requirement for AutoCAD skills. Included is a benchmarking guide to the salaries offered in vacancies that have cited AutoCAD over the 6 months to 26 April 2024 with a comparison to the same period in the previous 2 years.

6 months to
26 Apr 2024
Same period 2023 Same period 2022
Rank 625 915 1128
Rank change year-on-year +290 +213 -324
Permanent jobs citing AutoCAD 277 78 84
As % of all permanent jobs advertised in the UK 0.28% 0.074% 0.055%
As % of the Applications category 2.84% 0.84% 0.64%
Number of salaries quoted 162 43 58
10th Percentile £24,438 £32,000 £27,000
25th Percentile £31,000 £32,500 £32,625
Median annual salary (50th Percentile) £45,000 £35,000 £41,250
Median % change year-on-year +28.57% -15.15% +27.91%
75th Percentile £56,000 £42,875 £59,688
90th Percentile £65,250 £67,500 £60,000
UK excluding London median annual salary £45,000 £35,000 £43,000
% change year-on-year +28.57% -18.60% +7.50%

All Software Application Skills
UK

AutoCAD is in the Software Applications category. The following table is for comparison with the above and provides summary statistics for all permanent job vacancies with a requirement for software application skills.

Permanent vacancies with a requirement for software application skills 9,752 9,237 13,042
As % of all permanent jobs advertised in the UK 9.93% 8.81% 8.46%
Number of salaries quoted 6,123 5,038 7,126
10th Percentile £24,500 £25,750 £25,750
25th Percentile £27,750 £31,250 £31,250
Median annual salary (50th Percentile) £37,500 £44,873 £45,000
Median % change year-on-year -16.43% -0.28% +5.88%
75th Percentile £53,250 £60,000 £60,000
90th Percentile £67,500 £77,500 £75,000
UK excluding London median annual salary £35,000 £37,500 £39,000
% change year-on-year -6.67% -3.85% -2.50%

AutoCAD
Job Vacancy Trend

Job postings citing AutoCAD as a proportion of all IT jobs advertised.
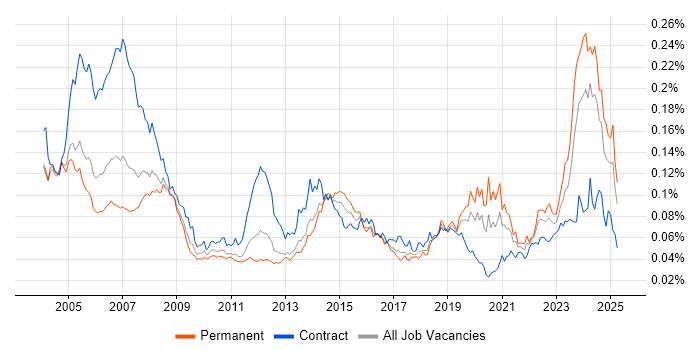
Job vacancy trend for AutoCAD in the UK

AutoCAD
Salary Trend

3-month moving average salary quoted in jobs citing AutoCAD.

Salary trend for AutoCAD in the UK

AutoCAD
Salary Histogram

Salary distribution for jobs citing AutoCAD over the 6 months to 26 April 2024.

Salary histogram for AutoCAD in the UK

AutoCAD
Top 15 Job Locations

The table below looks at the demand and provides a guide to the median salaries quoted in IT jobs citing AutoCAD within the UK over the 6 months to 26 April 2024. The 'Rank Change' column provides an indication of the change in demand within each location based on the same 6 month period last year.

Location Rank Change
on Same Period
Last Year
Matching
Permanent
IT Job Ads
Median Salary
Past 6 Months
Median Salary
% Change
on Same Period
Last Year
Live
Jobs
England +297 255 £45,000 +28.57% 415
UK excluding London +179 232 £45,000 +28.57% 382
South East +77 63 £45,000 +28.57% 85
Midlands +55 49 £40,000 - 91
Work from Home +98 47 £45,000 +28.57% 100
East of England +45 43 £45,000 +28.57% 40
North of England +83 42 £40,000 -13.04% 98
London +155 37 £63,500 +41.11% 66
West Midlands - 27 £50,000 - 55
East Midlands +4 22 £40,000 - 36
South West -3 22 £34,000 - 46
Yorkshire +114 21 £45,000 -2.17% 26
North West - 21 £32,500 - 56
Scotland -47 14 £48,000 - 28
Wales +11 4 - - 9

AutoCAD
Co-occurring Skills and Capabilities by Category

The follow tables expand on the table above by listing co-occurrences grouped by category. The same employment type, locality and period is covered with up to 20 co-occurrences shown in each of the following categories:

Application Platforms
1 14 (5.05%) ArcGIS
2 6 (2.17%) SharePoint
3 3 (1.08%) Smallworld
4 1 (0.36%) Apache
4 1 (0.36%) IIS
4 1 (0.36%) Microsoft Exchange
4 1 (0.36%) WebSphere
Applications
1 61 (22.02%) Revit
2 49 (17.69%) Microsoft Office
3 36 (13.00%) Microsoft Excel
4 18 (6.50%) MS Visio
5 11 (3.97%) Microsoft Project
6 10 (3.61%) Autodesk Inventor
6 10 (3.61%) SOLIDWORKS
7 7 (2.53%) Microsoft PowerPoint
8 6 (2.17%) 3ds Max
8 6 (2.17%) Photoshop
8 6 (2.17%) Solid Edge
9 4 (1.44%) EPLAN
9 4 (1.44%) SketchUp
10 3 (1.08%) InDesign
11 2 (0.72%) ALPHACAM
11 2 (0.72%) Fusion 360
12 1 (0.36%) Adobe Creative Suite
12 1 (0.36%) Blender
12 1 (0.36%) MicroStation
12 1 (0.36%) PTC Creo
Business Applications
1 10 (3.61%) NEC Housing
2 3 (1.08%) SAP CRM
2 3 (1.08%) SAP PM
Cloud Services
1 10 (3.61%) Adobe Creative Cloud
2 5 (1.81%) Power Platform
3 1 (0.36%) AWS
3 1 (0.36%) Azure
3 1 (0.36%) Azure DevOps
3 1 (0.36%) Entra ID
3 1 (0.36%) GCP
3 1 (0.36%) IaaS
3 1 (0.36%) Microsoft 365
3 1 (0.36%) PaaS
Communications & Networking
1 6 (2.17%) Wireless
2 4 (1.44%) Structured Cabling
2 4 (1.44%) TETRA
3 3 (1.08%) LAN
3 3 (1.08%) WLAN
4 1 (0.36%) Network Security
4 1 (0.36%) Unified Communications
Database & Business Intelligence
1 5 (1.81%) Power BI
2 4 (1.44%) GIS
3 3 (1.08%) Geospatial Data
3 3 (1.08%) Spatial Data
4 2 (0.72%) Electronic Patient Records
5 1 (0.36%) SAP HANA
5 1 (0.36%) SQL Server
Development Applications
1 1 (0.36%) Chocolatey
1 1 (0.36%) Git
1 1 (0.36%) Jenkins
General
1 98 (35.38%) Social Skills
2 80 (28.88%) Legal
3 73 (26.35%) Inclusion and Diversity
4 55 (19.86%) Local Government
5 35 (12.64%) Manufacturing
6 34 (12.27%) Analytical Skills
7 33 (11.91%) Finance
8 20 (7.22%) Organisational Skills
8 20 (7.22%) Presentation Skills
9 18 (6.50%) Retail
10 14 (5.05%) Games
11 12 (4.33%) Marketing
12 11 (3.97%) Public Sector
13 10 (3.61%) Telecoms
14 4 (1.44%) Electronics
15 3 (1.08%) Aerospace
15 3 (1.08%) Automotive
16 2 (0.72%) Advertising
16 2 (0.72%) Pharmaceutical
17 1 (0.36%) Back Office
Job Titles
1 49 (17.69%) Coordinator
1 49 (17.69%) Technical Coordinator
2 41 (14.80%) Senior
3 38 (13.72%) Project Manager
4 18 (6.50%) Programmer
5 17 (6.14%) CAD Technician
5 17 (6.14%) Design Engineer
5 17 (6.14%) Systems Engineer
5 17 (6.14%) Technical Manager
6 16 (5.78%) Systems Programmer
7 14 (5.05%) Senior Manager
8 12 (4.33%) Senior Project Manager
8 12 (4.33%) Technical Assistant
9 11 (3.97%) Software Engineer
10 10 (3.61%) Head of IT
11 8 (2.89%) Consultant
12 7 (2.53%) Hardware Engineer
12 7 (2.53%) Information Manager
12 7 (2.53%) Infrastructure Engineer
12 7 (2.53%) Trainee
Libraries, Frameworks & Software Standards
1 14 (5.05%) V-Ray
2 10 (3.61%) Unreal Engine
3 1 (0.36%) Elastic Stack
3 1 (0.36%) XML
3 1 (0.36%) YAML
Miscellaneous
1 53 (19.13%) Housing Association
2 20 (7.22%) Renewable Energy
3 14 (5.05%) Self-Motivation
3 14 (5.05%) Virtual Reality
4 13 (4.69%) Video Conferencing
5 11 (3.97%) Augmented Reality
5 11 (3.97%) CCTV
5 11 (3.97%) Management Information System
6 10 (3.61%) Driving Licence
6 10 (3.61%) e-Learning
6 10 (3.61%) HoloLens
6 10 (3.61%) HTC Vive
6 10 (3.61%) Oculus
6 10 (3.61%) Operational Technology
7 7 (2.53%) Robotics
8 6 (2.17%) FMCG
9 5 (1.81%) Data Centre
9 5 (1.81%) Onboarding
9 5 (1.81%) PMI
10 4 (1.44%) Photovoltaics
Operating Systems
1 32 (11.55%) Windows
2 3 (1.08%) Android
2 3 (1.08%) Apple iOS
3 1 (0.36%) Windows Server
3 1 (0.36%) Windows Server 2012
Processes & Methodologies
1 78 (28.16%) Time Management
2 76 (27.44%) Agile
3 71 (25.63%) CAD
4 57 (20.58%) Project Management
5 45 (16.25%) Problem-Solving
6 42 (15.16%) Continuous Improvement
7 33 (11.91%) Project Delivery
8 27 (9.75%) Mathematics
9 23 (8.30%) Mentoring
10 22 (7.94%) Creative Thinking
11 13 (4.69%) Risk Management
11 13 (4.69%) Software Testing
12 12 (4.33%) Budgeting
12 12 (4.33%) Software Engineering
13 11 (3.97%) IT Strategy
13 11 (3.97%) Project Planning
13 11 (3.97%) Technology Strategy
14 10 (3.61%) Cost Control
14 10 (3.61%) Cybersecurity
15 9 (3.25%) 3D Modelling
Programming Languages
1 16 (5.78%) R
2 1 (0.36%) Bash
2 1 (0.36%) MATLAB
2 1 (0.36%) PowerShell
Qualifications
1 97 (35.02%) HND
2 88 (31.77%) Degree
3 82 (29.60%) HNC
4 10 (3.61%) Security Cleared
5 9 (3.25%) SC Cleared
6 6 (2.17%) PMI Certification
7 5 (1.81%) DV Cleared
7 5 (1.81%) Master's Degree
8 4 (1.44%) DBS Check
8 4 (1.44%) RIBA
9 3 (1.08%) Chartered Engineer
10 2 (0.72%) BICSI Certification
10 2 (0.72%) BICSI RCDD
11 1 (0.36%) AWS Certification
11 1 (0.36%) Azure Certification
11 1 (0.36%) Computer Science Degree
11 1 (0.36%) MCSA
11 1 (0.36%) MCSE
11 1 (0.36%) Microsoft Certification
11 1 (0.36%) PMP
Quality Assurance & Compliance
1 24 (8.66%) GDPR
2 11 (3.97%) NEBOSH
3 7 (2.53%) QA
4 5 (1.81%) Accessibility
5 4 (1.44%) ISO 14001
5 4 (1.44%) ISO 9001
6 3 (1.08%) Data Quality
7 2 (0.72%) COSHH
System Software
1 4 (1.44%) Active Directory
Systems Management
1 1 (0.36%) Active Directory Federation Services
1 1 (0.36%) Ansible
1 1 (0.36%) SCCM
1 1 (0.36%) SCOM
1 1 (0.36%) Terraform
Vendors
1 57 (20.58%) Microsoft
2 35 (12.64%) SAP
3 27 (9.75%) Autodesk
4 17 (6.14%) Adobe
5 11 (3.97%) Siemens
6 10 (3.61%) NEC
7 4 (1.44%) Allen-Bradley
7 4 (1.44%) EMC
8 3 (1.08%) Epicor
9 1 (0.36%) Bloomberg
9 1 (0.36%) BT
9 1 (0.36%) IBM
9 1 (0.36%) MathWorks
9 1 (0.36%) Oracle
9 1 (0.36%) PTC
9 1 (0.36%) Red Hat
9 1 (0.36%) TOWER Software
9 1 (0.36%) Vectorworks