Strategic Thinking
UK

The following table provides summary statistics for permanent job vacancies with a requirement for Strategic Thinking skills. Included is a benchmarking guide to the salaries offered in vacancies that have cited Strategic Thinking over the 6 months to 30 November 2023 with a comparison to the same period in the previous 2 years.

6 months to
30 Nov 2023
Same period 2022 Same period 2021
Rank 370 356 429
Rank change year-on-year -14 +73 +58
Permanent jobs citing Strategic Thinking 413 1,226 1,000
As % of all permanent jobs advertised in the UK 0.77% 0.97% 0.77%
As % of the Processes & Methodologies category 0.82% 1.01% 0.81%
Number of salaries quoted 301 520 460
10th Percentile £37,500 £40,925 £39,424
25th Percentile £55,000 £53,688 £50,000
Median annual salary (50th Percentile) £70,000 £69,250 £60,000
Median % change year-on-year +1.08% +15.42% -13.67%
75th Percentile £84,000 £87,292 £85,000
90th Percentile £102,500 £102,750 £100,000
UK excluding London median annual salary £64,000 £62,500 £55,000
% change year-on-year +2.40% +13.64% -4.35%

All Process and Methodology Skills
UK

Strategic Thinking is in the Processes and Methodologies category. The following table is for comparison with the above and provides summary statistics for all permanent job vacancies with a requirement for process or methodology skills.

Permanent vacancies with a requirement for process or methodology skills 50,664 120,987 123,563
As % of all permanent jobs advertised in the UK 94.08% 95.74% 95.44%
Number of salaries quoted 36,731 73,454 82,144
10th Percentile £32,500 £34,347 £32,500
25th Percentile £43,750 £45,000 £42,500
Median annual salary (50th Percentile) £60,000 £60,000 £59,500
Median % change year-on-year - +0.84% +8.18%
75th Percentile £80,000 £81,250 £77,500
90th Percentile £98,750 £100,000 £95,000
UK excluding London median annual salary £52,500 £53,000 £50,000
% change year-on-year -0.94% +6.00% +4.17%

Strategic Thinking
Job Vacancy Trend

Job postings citing Strategic Thinking as a proportion of all IT jobs advertised.
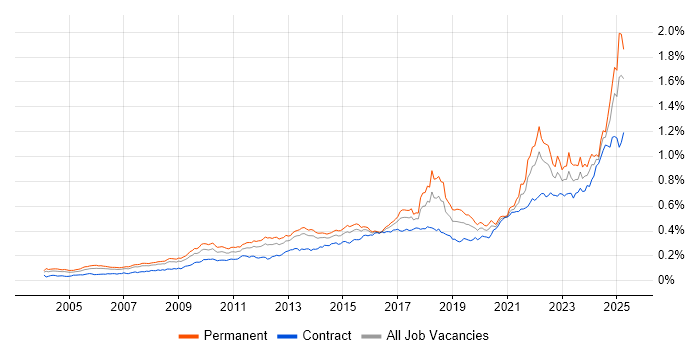
Job vacancy trend for Strategic Thinking in the UK

Strategic Thinking
Salary Trend

3-month moving average salary quoted in jobs citing Strategic Thinking.

Salary trend for Strategic Thinking in the UK

Strategic Thinking
Salary Histogram

Salary distribution for jobs citing Strategic Thinking over the 6 months to 30 November 2023.

Salary histogram for Strategic Thinking in the UK

Strategic Thinking
Top 17 Job Locations

The table below looks at the demand and provides a guide to the median salaries quoted in IT jobs citing Strategic Thinking within the UK over the 6 months to 30 November 2023. The 'Rank Change' column provides an indication of the change in demand within each location based on the same 6 month period last year.

Location Rank Change
on Same Period
Last Year
Matching
Permanent
IT Job Ads
Median Salary
Past 6 Months
Median Salary
% Change
on Same Period
Last Year
Live
Jobs
England -49 334 £70,576 +0.82% 430
UK excluding London +16 242 £64,000 +2.40% 225
Work from Home +15 173 £65,000 -8.13% 184
London -5 139 £81,500 +12.03% 229
North of England +67 69 £65,000 -7.14% 52
South East +108 53 £70,000 +7.69% 73
Midlands +29 37 £62,000 +12.73% 29
North West +54 36 £60,000 -17.24% 31
West Midlands +60 33 £65,000 +18.18% 17
Yorkshire +53 29 £75,000 +11.11% 17
Wales +31 28 £34,000 -45.51% 4
South West +38 22 £59,778 -8.03% 29
Scotland +37 18 £73,000 +16.80% 13
East of England +56 11 £41,000 -25.45% 23
North East +32 4 £69,045 -30.96% 6
East Midlands +21 4 £48,750 -3.94% 10
Northern Ireland - 4 £69,045 - 6

Strategic Thinking
Co-occurring Skills and Capabilities by Category

The follow tables expand on the table above by listing co-occurrences grouped by category. The same employment type, locality and period is covered with up to 20 co-occurrences shown in each of the following categories:

Application Platforms
1 9 (2.18%) SAS
2 6 (1.45%) SharePoint
3 5 (1.21%) ThingWorx
4 2 (0.48%) Jupyter
4 2 (0.48%) MS Exchange
5 1 (0.24%) CMS
5 1 (0.24%) Confluence
Applications
1 16 (3.87%) Microsoft Excel
2 15 (3.63%) Microsoft Office
3 8 (1.94%) Microsoft PowerPoint
4 5 (1.21%) Autodesk Inventor
4 5 (1.21%) SOLIDWORKS
5 2 (0.48%) Chatbot
5 2 (0.48%) Microsoft Project
6 1 (0.24%) Adobe After Effects
6 1 (0.24%) Adobe Creative Suite
6 1 (0.24%) Adobe Illustrator
6 1 (0.24%) Adobe Premiere
6 1 (0.24%) Adobe XD
6 1 (0.24%) Final Cut Pro
6 1 (0.24%) InDesign
6 1 (0.24%) MS Visio
6 1 (0.24%) Oracle Smart View
6 1 (0.24%) Photoshop
6 1 (0.24%) Sketch
6 1 (0.24%) UserZoom
Business Applications
1 6 (1.45%) Oracle ERP
1 6 (1.45%) Oracle General Ledger
2 4 (0.97%) SAP S/4HANA
3 3 (0.73%) SAP CO
3 3 (0.73%) SAP FI
3 3 (0.73%) SAP FI/CO
4 1 (0.24%) Dynamics CRM
4 1 (0.24%) HFM
4 1 (0.24%) Hyperion Planning
4 1 (0.24%) Magento
4 1 (0.24%) Oracle Assets
4 1 (0.24%) Oracle Financials
4 1 (0.24%) SAP ERP
Cloud Services
1 68 (16.46%) Azure
2 56 (13.56%) Power Platform
3 42 (10.17%) AWS
4 39 (9.44%) SaaS
5 32 (7.75%) dbt
6 18 (4.36%) Microsoft 365
7 15 (3.63%) GCP
8 14 (3.39%) Entra ID
9 12 (2.91%) Amazon S3
10 10 (2.42%) IaaS
10 10 (2.42%) PaaS
11 5 (1.21%) OneDrive
12 4 (0.97%) Azure AKS
12 4 (0.97%) Cloud Computing
12 4 (0.97%) Google Analytics
13 3 (0.73%) Azure DevOps
13 3 (0.73%) Azure Monitor
13 3 (0.73%) Figma
13 3 (0.73%) Serverless
13 3 (0.73%) WhatsApp
Communications & Networking
1 8 (1.94%) Network Security
2 7 (1.69%) WAN
3 6 (1.45%) LAN
4 5 (1.21%) TCP/IP
5 4 (0.97%) Firewall
5 4 (0.97%) SD-WAN
5 4 (0.97%) WebEx
5 4 (0.97%) Wi-Fi
6 3 (0.73%) Internet
6 3 (0.73%) VPN
7 2 (0.48%) WLAN
7 2 (0.48%) WPA
8 1 (0.24%) DHCP
8 1 (0.24%) DNS
8 1 (0.24%) HSRP
8 1 (0.24%) Intranet
8 1 (0.24%) Multicast
8 1 (0.24%) Remote Desktop
8 1 (0.24%) Spanning Tree
8 1 (0.24%) VLAN
Database & Business Intelligence
1 54 (13.08%) Power BI
2 18 (4.36%) BusinessObjects
3 14 (3.39%) Amazon RDS
4 12 (2.91%) Amazon Athena
4 12 (2.91%) Amazon QuickSight
4 12 (2.91%) Amazon Redshift
4 12 (2.91%) DynamoDB
5 7 (1.69%) Data Mining
5 7 (1.69%) Oracle Reports
5 7 (1.69%) SQL Server
6 6 (1.45%) Tableau
7 4 (0.97%) Azure SQL Database
7 4 (0.97%) Data Hub
7 4 (0.97%) PostgreSQL
8 3 (0.73%) Big Data
8 3 (0.73%) Relational Database
9 2 (0.48%) MongoDB
9 2 (0.48%) Neo4j
9 2 (0.48%) Redis
9 2 (0.48%) Spatial Data
Development Applications
1 10 (2.42%) JIRA
2 2 (0.48%) Liquibase
3 1 (0.24%) Git
3 1 (0.24%) Jenkins
3 1 (0.24%) NUnit
3 1 (0.24%) Octopus Deploy
3 1 (0.24%) Selenium
3 1 (0.24%) SpecFlow
General
1 178 (43.10%) Social Skills
2 128 (30.99%) Finance
3 100 (24.21%) Analytical Skills
4 71 (17.19%) Retail
5 68 (16.46%) Inclusion and Diversity
6 66 (15.98%) Marketing
7 46 (11.14%) Public Sector
8 42 (10.17%) Presentation Skills
9 35 (8.47%) Banking
10 21 (5.08%) Advertising
11 19 (4.60%) Retail Banking
12 16 (3.87%) Influencing Skills
12 16 (3.87%) Legal
13 14 (3.39%) Digital Economy
14 11 (2.66%) Back Office
15 9 (2.18%) Law
15 9 (2.18%) Telecoms
16 5 (1.21%) Front Office
16 5 (1.21%) Pharmaceutical
17 4 (0.97%) Automotive
Job Titles
1 75 (18.16%) Lead
2 59 (14.29%) Senior
3 42 (10.17%) Architect
4 34 (8.23%) Analyst
5 31 (7.51%) Designer
6 25 (6.05%) Solutions Architect
7 22 (5.33%) Senior Manager
8 18 (4.36%) Developer
8 18 (4.36%) Senior Analyst
9 17 (4.12%) Consultant
9 17 (4.12%) Insight Manager
10 15 (3.63%) Business Manager
10 15 (3.63%) Service Designer
11 14 (3.39%) Data Architect
11 14 (3.39%) Development Manager
11 14 (3.39%) IT Manager
11 14 (3.39%) Lead Designer
12 13 (3.15%) Lead Service Designer
13 12 (2.91%) Performance Manager
14 11 (2.66%) Business Development Manager
Libraries, Frameworks & Software Standards
1 9 (2.18%) .NET
1 9 (2.18%) EDI
2 8 (1.94%) SAML
3 6 (1.45%) React
4 5 (1.21%) CSS
4 5 (1.21%) HTML
5 4 (0.97%) AngularJS
5 4 (0.97%) Middleware
5 4 (0.97%) SAP Fiori
6 3 (0.73%) Node.js
6 3 (0.73%) Velocity
7 2 (0.48%) .NET Core
7 2 (0.48%) ASP.NET
7 2 (0.48%) Elastic Stack
7 2 (0.48%) NumPy
7 2 (0.48%) Pandas
8 1 (0.24%) DHTML
8 1 (0.24%) GraphQL
8 1 (0.24%) J2EE
8 1 (0.24%) Lambda Expressions
Miscellaneous
1 25 (6.05%) Self-Motivation
2 19 (4.60%) Public Cloud
3 18 (4.36%) Enterprise Software
4 16 (3.87%) Renewable Energy
5 15 (3.63%) PMI
6 12 (2.91%) Management Information System
6 12 (2.91%) Product Ownership
7 10 (2.42%) Graphic Design
8 9 (2.18%) 3D Graphics
8 9 (2.18%) e-Learning
8 9 (2.18%) Photography
9 7 (1.69%) Analytical Mindset
9 7 (1.69%) Cyberattack
9 7 (1.69%) Reinsurance
10 6 (1.45%) Blog
10 6 (1.45%) IoT
10 6 (1.45%) Private Cloud
11 5 (1.21%) Cloud Native
11 5 (1.21%) Industrial Internet of Things
11 5 (1.21%) Video Conferencing
Operating Systems
1 9 (2.18%) Windows
2 8 (1.94%) Linux
3 3 (0.73%) Windows 10
3 3 (0.73%) Windows Server
4 1 (0.24%) Red Hat Enterprise Linux
4 1 (0.24%) VMS
4 1 (0.24%) Windows Server 2016
4 1 (0.24%) Windows Server 2019
Processes & Methodologies
1 157 (38.01%) Agile
2 110 (26.63%) Problem-Solving
3 78 (18.89%) Analytics
4 77 (18.64%) Roadmaps
5 67 (16.22%) Stakeholder Management
6 66 (15.98%) Continuous Improvement
7 62 (15.01%) User Experience
8 61 (14.77%) Mentoring
9 59 (14.29%) Business Strategy
10 56 (13.56%) Business Intelligence
11 55 (13.32%) Decision-Making
12 50 (12.11%) Project Management
13 46 (11.14%) Service Design
14 38 (9.20%) Data Analytics
15 35 (8.47%) User Research
16 33 (7.99%) Computer Science
16 33 (7.99%) Line Management
16 33 (7.99%) Product Strategy
17 31 (7.51%) Process Improvement
18 30 (7.26%) User Stories
Programming Languages
1 39 (9.44%) SQL
2 31 (7.51%) Python
3 14 (3.39%) C#
4 10 (2.42%) R
5 8 (1.94%) Java
5 8 (1.94%) JavaScript
6 4 (0.97%) PowerShell
6 4 (0.97%) TypeScript
7 3 (0.73%) Bash
7 3 (0.73%) PL/SQL
7 3 (0.73%) VBA
8 2 (0.48%) C++
8 2 (0.48%) Shell Script
9 1 (0.24%) C
9 1 (0.24%) PHP
9 1 (0.24%) T-SQL
9 1 (0.24%) VB.NET
Qualifications
1 95 (23.00%) Degree
2 67 (16.22%) Security Cleared
3 43 (10.41%) SC Cleared
4 19 (4.60%) PMI Certification
5 15 (3.63%) DV Cleared
6 11 (2.66%) Master's Degree
7 10 (2.42%) CRISC
8 9 (2.18%) CISA
8 9 (2.18%) CISSP
9 7 (1.69%) Computer Science Degree
10 5 (1.21%) PMP
11 4 (0.97%) Cisco Certification
11 4 (0.97%) CISM
11 4 (0.97%) IIBA
11 4 (0.97%) MBA
11 4 (0.97%) Numerate Degree
11 4 (0.97%) TOGAF Certification
12 3 (0.73%) CCNA
12 3 (0.73%) CIPD
13 2 (0.48%) APMG
Quality Assurance & Compliance
1 20 (4.84%) ISO/IEC 27001
2 19 (4.60%) NIST
3 16 (3.87%) GRC
4 14 (3.39%) GDPR
4 14 (3.39%) Sarbanes-Oxley
5 13 (3.15%) Data Quality
6 12 (2.91%) Accessibility
7 10 (2.42%) HIPAA
7 10 (2.42%) PMO
8 3 (0.73%) Cyber Essentials
8 3 (0.73%) QA
9 2 (0.48%) PCI DSS
9 2 (0.48%) SLA
10 1 (0.24%) Actionable Recommendations
10 1 (0.24%) California Consumer Privacy Act
10 1 (0.24%) Cyber Essentials PLUS
10 1 (0.24%) Government Security Classifications
10 1 (0.24%) NCSC
System Software
1 20 (4.84%) Active Directory
2 9 (2.18%) Docker
3 5 (1.21%) VMware Infrastructure
4 3 (0.73%) Virtual Desktop
5 2 (0.48%) Hyper-V
6 1 (0.24%) VMware ESXi
6 1 (0.24%) vSphere
Systems Management
1 8 (1.94%) Terraform
2 6 (1.45%) Kubernetes
3 4 (0.97%) Active Directory Federation Services
3 4 (0.97%) Single Sign-On
4 3 (0.73%) Ansible
5 2 (0.48%) EMC NetWorker
5 2 (0.48%) Microsoft Intune
5 2 (0.48%) Progress Chef
5 2 (0.48%) Puppet
6 1 (0.24%) Cisco Prime
6 1 (0.24%) Nagios
6 1 (0.24%) SysTrack
Vendors
1 65 (15.74%) Microsoft
2 25 (6.05%) Salesforce
3 21 (5.08%) SAP
4 11 (2.66%) Oracle
5 9 (2.18%) Cadence
5 9 (2.18%) Google
6 7 (1.69%) Citrix
6 7 (1.69%) Hyperion
6 7 (1.69%) VMware
7 5 (1.21%) PTC
8 4 (0.97%) Alteryx
8 4 (0.97%) Cisco
8 4 (0.97%) CyberArk
8 4 (0.97%) Workday
9 3 (0.73%) Aruba
9 3 (0.73%) Fortinet
9 3 (0.73%) Juniper
9 3 (0.73%) ServiceNow
10 2 (0.48%) Adobe
10 2 (0.48%) Intel