Military Jobs

Military
UK

The table below looks at the prevalence of the term Military in permanent job vacancies. Included is a benchmarking guide to the salaries offered in vacancies that cited Military over the 6 months leading up to 23 October 2024, comparing them to the same period in the previous two years.

6 months to
23 Oct 2024
Same period 2023 Same period 2022
Rank 250 463 477
Rank change year-on-year +213 +14 +262
Permanent jobs citing Military 816 322 959
As % of all permanent jobs advertised in the UK 1.08% 0.54% 0.68%
As % of the General category 1.85% 0.82% 1.00%
Number of salaries quoted 241 216 182
10th Percentile £30,000 £37,000 £32,000
25th Percentile £45,000 £46,250 £38,500
Median annual salary (50th Percentile) £55,000 £60,000 £50,000
Median % change year-on-year -8.33% +20.00% -14.89%
75th Percentile £73,000 £76,250 £61,250
90th Percentile £82,500 £85,000 £88,625
UK excluding London median annual salary £55,000 £60,000 £50,000
% change year-on-year -8.33% +20.00% -4.76%

All General Skills
UK

Military falls under the General Skills category. For comparison with the information above, the following table provides summary statistics for all permanent job vacancies requiring common skills.

Permanent vacancies with a requirement for common skills 44,101 39,349 95,915
As % of all permanent jobs advertised in the UK 58.29% 66.18% 68.25%
Number of salaries quoted 20,105 27,135 50,473
10th Percentile £31,750 £31,250 £32,500
25th Percentile £42,500 £42,500 £44,000
Median annual salary (50th Percentile) £58,033 £60,000 £60,000
Median % change year-on-year -3.28% - +4.35%
75th Percentile £78,750 £80,000 £81,250
90th Percentile £100,000 £100,000 £100,000
UK excluding London median annual salary £50,309 £50,000 £52,500
% change year-on-year +0.62% -4.76% +10.53%

Military
Job Vacancy Trend

Job postings citing Military as a proportion of all IT jobs advertised.
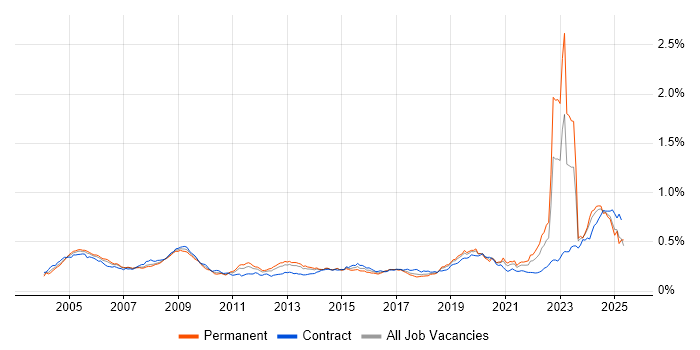
Job vacancy trend for Military in the UK

Military
Salary Trend

3-month moving average salary quoted in jobs citing Military.

Salary trend for Military in the UK

Military
Salary Histogram

Salary distribution for jobs citing Military over the 6 months to 23 October 2024.

Salary histogram for Military in the UK

Military
Top 16 Job Locations

The table below looks at the demand and provides a guide to the median salaries quoted in IT jobs citing Military within the UK over the 6 months to 23 October 2024. The 'Rank Change' column provides an indication of the change in demand within each location based on the same 6 month period last year.

Location Rank Change
on Same Period
Last Year
Matching
Permanent
IT Job Ads
Median Salary
Past 6 Months
Median Salary
% Change
on Same Period
Last Year
Live
Jobs
UK excluding London +169 792 £55,000 -8.33% 332
England +196 787 £55,000 -11.29% 323
South East +125 316 £68,750 +10.00% 80
Midlands +155 239 £56,000 -20.00% 44
West Midlands +108 191 £60,000 -14.29% 21
Work from Home +16 159 £53,000 -21.48% 1,396
South West -29 120 £55,000 -11.65% 54
North of England +16 71 £48,777 +12.78% 54
North West +28 59 £47,500 -26.73% 27
East Midlands - 48 £27,000 - 21
East of England -25 21 £45,000 - 72
London +5 20 £70,000 +14.75% 23
Scotland -2 19 £37,547 -31.73% 32
Yorkshire +21 10 £61,110 +47.25% 21
Wales +41 6 - - 2
North East - 2 - - 6

Military
Co-occurring Skills and Capabilities by Category

The follow tables expand on the table above by listing co-occurrences grouped by category. The same employment type, locality and period is covered with up to 20 co-occurrences shown in each of the following categories:

Application Platforms
1 84 (10.29%) Oracle Application Server
2 19 (2.33%) SharePoint
3 12 (1.47%) Microsoft Exchange
4 8 (0.98%) ArcGIS
5 6 (0.74%) Confluence
6 4 (0.49%) SAS
7 2 (0.25%) Exchange Server 2013
7 2 (0.25%) nginx
8 1 (0.12%) SharePoint Server
Applications
1 291 (35.66%) Microsoft Office
2 275 (33.70%) Microsoft Excel
3 22 (2.70%) Simulink
4 11 (1.35%) Microsoft PowerPoint
4 11 (1.35%) Microsoft Project
5 5 (0.61%) MS Visio
6 1 (0.12%) Adobe Illustrator
6 1 (0.12%) FrameMaker
6 1 (0.12%) InDesign
6 1 (0.12%) Photoshop
6 1 (0.12%) Spreadsheet
Business Applications
1 84 (10.29%) Oracle EBS
2 12 (1.47%) Maximo
3 9 (1.10%) Sparx Enterprise Architect
4 1 (0.12%) Dynamics CRM
4 1 (0.12%) Teamcenter
Cloud Services
1 11 (1.35%) Microsoft 365
2 10 (1.23%) SaaS
3 8 (0.98%) Power Platform
4 5 (0.61%) Azure
5 4 (0.49%) AWS
5 4 (0.49%) Azure Synapse Analytics
5 4 (0.49%) Snowflake
6 1 (0.12%) Adobe Creative Cloud
6 1 (0.12%) Cloud Computing
6 1 (0.12%) Figma
6 1 (0.12%) IaaS
6 1 (0.12%) PaaS
Communications & Networking
1 34 (4.17%) Internet
2 22 (2.70%) TCP/IP
3 15 (1.84%) Firewall
4 10 (1.23%) RFID
5 8 (0.98%) Network Security
6 7 (0.86%) DHCP
6 7 (0.86%) DNS
6 7 (0.86%) Skype
6 7 (0.86%) Wireless
7 5 (0.61%) NAS
7 5 (0.61%) RS-232
7 5 (0.61%) RS-422
7 5 (0.61%) SAN
7 5 (0.61%) Software-Defined Radio
8 4 (0.49%) VLAN
9 3 (0.37%) Broadband
9 3 (0.37%) LTE
10 2 (0.25%) Ethernet
10 2 (0.25%) LAN
10 2 (0.25%) SDH
Database & Business Intelligence
1 88 (10.78%) Data Warehouse
2 85 (10.42%) Relational Database
3 84 (10.29%) Enterprise Data Warehouse
3 84 (10.29%) RDBMS
4 10 (1.23%) SQL Server
5 4 (0.49%) Power BI
6 2 (0.25%) MongoDB
6 2 (0.25%) PostgreSQL
7 1 (0.12%) Big Data
7 1 (0.12%) NoSQL
7 1 (0.12%) Redis
7 1 (0.12%) SQLite
Development Applications
1 25 (3.06%) Subversion
2 19 (2.33%) Git
3 17 (2.08%) Rational DOORS
4 16 (1.96%) Rational Rhapsody
5 13 (1.59%) Visual Studio
6 11 (1.35%) CMake
7 10 (1.23%) LabVIEW
8 9 (1.10%) JIRA
9 5 (0.61%) CppUnit
9 5 (0.61%) JUnit
9 5 (0.61%) NetBeans
10 2 (0.25%) Rational Statemate
11 1 (0.12%) GitLab
11 1 (0.12%) Vagrant
11 1 (0.12%) Zephyr
General
1 203 (24.88%) Social Skills
2 137 (16.79%) Finance
3 99 (12.13%) Analytical Skills
4 93 (11.40%) Organisational Skills
5 92 (11.27%) Inclusion and Diversity
6 87 (10.66%) Influencing Skills
7 70 (8.58%) Aerospace
8 59 (7.23%) Electronics
9 31 (3.80%) Telecoms
10 17 (2.08%) Avionics
11 16 (1.96%) Manufacturing
12 14 (1.72%) Public Sector
13 12 (1.47%) Billing
13 12 (1.47%) Legal
14 10 (1.23%) Aviation
15 9 (1.10%) Local Government
16 8 (0.98%) Back Office
17 7 (0.86%) Marketing
18 5 (0.61%) Automotive
18 5 (0.61%) Pharmaceutical
Job Titles
1 246 (30.15%) Graduate
2 158 (19.36%) Senior
3 75 (9.19%) DevOps Engineer
4 74 (9.07%) Architect
5 57 (6.99%) Senior DevOps
5 57 (6.99%) Senior DevOps Engineer
6 56 (6.86%) Solutions Architect
7 54 (6.62%) Software Engineer
8 48 (5.88%) Systems Engineer
9 38 (4.66%) Principal Engineer
10 35 (4.29%) Project Manager
11 29 (3.55%) Lead
11 29 (3.55%) Test Engineer
12 24 (2.94%) Senior Software Engineer
13 22 (2.70%) Database Engineer
13 22 (2.70%) Senior Database Engineer
14 21 (2.57%) Analyst
14 21 (2.57%) Principal Software Engineer
14 21 (2.57%) Software Architect
15 20 (2.45%) Support Engineer
Libraries, Frameworks & Software Standards
1 45 (5.51%) Middleware
2 17 (2.08%) SGML
3 13 (1.59%) Boost C++ Libraries
4 12 (1.47%) XML
5 11 (1.35%) MFC
5 11 (1.35%) Qt
5 11 (1.35%) STL
6 8 (0.98%) ADO
7 7 (0.86%) .NET
8 6 (0.74%) HTML
9 5 (0.61%) JavaFX
10 4 (0.49%) .NET Framework
11 3 (0.37%) Elastic Stack
12 2 (0.25%) Unity (Game Engine)
13 1 (0.12%) .NET Core
13 1 (0.12%) AngularJS
13 1 (0.12%) Kafka
13 1 (0.12%) ModSecurity
13 1 (0.12%) Protocol Buffers
Miscellaneous
1 254 (31.13%) Onboarding
2 95 (11.64%) Self-Motivation
3 82 (10.05%) Management Information System
4 17 (2.08%) Data Centre
5 15 (1.84%) Algorithms
6 12 (1.47%) Driving Licence
7 10 (1.23%) Acoustics
7 10 (1.23%) Lidar
8 8 (0.98%) Analogue Electronics
8 8 (0.98%) CCTV
9 7 (0.86%) PKI
10 5 (0.61%) Clustering
10 5 (0.61%) Fat Client
10 5 (0.61%) Fibre Optics
10 5 (0.61%) Thin Client
11 4 (0.49%) Cyber Security Posture
11 4 (0.49%) Cyberattack
11 4 (0.49%) Data Protection Act
11 4 (0.49%) Operational Technology
11 4 (0.49%) SCADA
Operating Systems
1 85 (10.42%) Windows
2 61 (7.48%) Linux
3 42 (5.15%) Windows Server
4 19 (2.33%) VxWorks
5 13 (1.59%) Unix
6 9 (1.10%) Windows Server 2016
7 8 (0.98%) Mac OS X
7 8 (0.98%) Windows Server 2012
8 5 (0.61%) VMS
9 3 (0.37%) Solaris
10 2 (0.25%) Windows 10
11 1 (0.12%) Android
11 1 (0.12%) CentOS
11 1 (0.12%) Red Hat Enterprise Linux
11 1 (0.12%) Ubuntu
11 1 (0.12%) Windows Vista
Processes & Methodologies
1 332 (40.69%) Customer Experience
2 278 (34.07%) Customer Service
3 266 (32.60%) Continuous Improvement
4 262 (32.11%) Process Improvement
5 256 (31.37%) Data Analysis
6 255 (31.25%) Logistics
7 250 (30.64%) Performance Metrics
8 246 (30.15%) Contingency Planning
8 246 (30.15%) Creative Thinking
9 225 (27.57%) Agile
10 152 (18.63%) Software Engineering
11 116 (14.22%) Problem-Solving
12 114 (13.97%) Mentoring
13 99 (12.13%) ITIL
14 93 (11.40%) DevOps
15 90 (11.03%) Data Modelling
15 90 (11.03%) ERP
16 89 (10.91%) Analytics
16 89 (10.91%) Prototyping
16 89 (10.91%) Service Management
Programming Languages
1 49 (6.00%) C++
2 42 (5.15%) MATLAB
3 35 (4.29%) Python
4 30 (3.68%) Java
5 29 (3.55%) C
6 22 (2.70%) C#
7 20 (2.45%) SQL
8 11 (1.35%) PowerShell
9 6 (0.74%) JavaScript
10 5 (0.61%) Fortran
10 5 (0.61%) Perl
11 4 (0.49%) R
12 3 (0.37%) Ada
13 2 (0.25%) VBA
14 1 (0.12%) Kotlin
Qualifications
1 395 (48.41%) Degree
2 197 (24.14%) Security Cleared
3 156 (19.12%) SC Cleared
4 86 (10.54%) DBS Check
5 33 (4.04%) DV Cleared
6 20 (2.45%) HNC
6 20 (2.45%) HND
7 15 (1.84%) CISSP
7 15 (1.84%) Computer Science Degree
8 12 (1.47%) CCNA
8 12 (1.47%) CCNP
8 12 (1.47%) Cisco Certification
9 10 (1.23%) GCIA
9 10 (1.23%) GCIH
9 10 (1.23%) PMP
10 9 (1.10%) CISM
10 9 (1.10%) TOGAF Certification
11 8 (0.98%) GREM
12 7 (0.86%) BPSS Clearance
13 6 (0.74%) APMP
Quality Assurance & Compliance
1 18 (2.21%) QA
2 16 (1.96%) NIST
3 11 (1.35%) Cyber Essentials
4 10 (1.23%) Def Stans
4 10 (1.23%) IEC 61508
5 6 (0.74%) ISO/IEC 27001
5 6 (0.74%) SLA
6 5 (0.61%) ISO 9001
6 5 (0.61%) NCSC
6 5 (0.61%) NIST 800
7 3 (0.37%) NEBOSH
8 2 (0.25%) Accessibility
8 2 (0.25%) ISO/IEC 15288
8 2 (0.25%) JSP 440
9 1 (0.12%) Cyber Essentials PLUS
9 1 (0.12%) DO-254
9 1 (0.12%) GRC
9 1 (0.12%) ISO/IEC 17025
System Software
1 19 (2.33%) Active Directory
1 19 (2.33%) VMware Infrastructure
2 18 (2.21%) Hyper-V
3 17 (2.08%) VMware NSX
4 13 (1.59%) Firmware
5 10 (1.23%) vSphere
6 1 (0.12%) Docker
6 1 (0.12%) Virtual Machines
Systems Management
1 12 (1.47%) vCenter Server
2 5 (0.61%) Failover Clustering
2 5 (0.61%) Microsoft Clustering
2 5 (0.61%) Microsoft Data Protection Manager
2 5 (0.61%) SCCM
3 4 (0.49%) Microsoft Intune
4 2 (0.25%) Backup Exec
5 1 (0.12%) Ansible
5 1 (0.12%) Kubernetes
5 1 (0.12%) Podman
5 1 (0.12%) Terraform
Vendors
1 85 (10.42%) Oracle
2 78 (9.56%) Microsoft
3 36 (4.41%) VMware
4 15 (1.84%) Cisco
5 14 (1.72%) Wind River
6 10 (1.23%) Atlassian
6 10 (1.23%) Remedy
7 9 (1.10%) Salesforce
7 9 (1.10%) Sparx
8 8 (0.98%) Dell
8 8 (0.98%) ESRI
8 8 (0.98%) IBM
9 7 (0.86%) BiZZdesign
10 5 (0.61%) SYSPRO
11 4 (0.49%) Cognos
11 4 (0.49%) IFS
11 4 (0.49%) Siemens
12 3 (0.37%) NEC
12 3 (0.37%) Red Hat
12 3 (0.37%) Serena