Business Strategy Jobs

Business Strategy
UK

The table below provides summary statistics for permanent job vacancies requiring Business Strategy skills. It includes a benchmarking guide to the annual salaries offered in vacancies that cited Business Strategy over the 6 months leading up to 11 October 2024, comparing them to the same period in the previous two years.

6 months to
11 Oct 2024
Same period 2023 Same period 2022
Rank 152 177 171
Rank change year-on-year +25 -6 +42
Permanent jobs citing Business Strategy 1,363 1,232 3,397
As % of all permanent jobs advertised in the UK 1.74% 2.03% 2.35%
As % of the Processes & Methodologies category 2.09% 2.15% 2.44%
Number of salaries quoted 580 683 1,683
10th Percentile £42,500 £39,610 £41,347
25th Percentile £53,750 £52,500 £50,000
Median annual salary (50th Percentile) £67,500 £67,500 £70,000
Median % change year-on-year - -3.57% +3.70%
75th Percentile £86,250 £90,625 £92,500
90th Percentile £101,028 £110,000 £114,950
UK excluding London median annual salary £65,000 £60,000 £60,000
% change year-on-year +8.33% - -

All Process and Methodology Skills
UK

Business Strategy falls under the Processes and Methodologies category. For comparison with the information above, the following table provides summary statistics for all permanent job vacancies requiring process or methodology skills.

Permanent vacancies with a requirement for process or methodology skills 65,317 57,192 139,110
As % of all permanent jobs advertised in the UK 83.49% 94.47% 96.16%
Number of salaries quoted 32,274 40,876 77,262
10th Percentile £33,000 £32,500 £33,950
25th Percentile £43,750 £45,000 £45,000
Median annual salary (50th Percentile) £60,000 £60,000 £60,000
Median % change year-on-year - - +4.35%
75th Percentile £77,500 £80,000 £80,000
90th Percentile £96,250 £97,500 £97,500
UK excluding London median annual salary £52,500 £53,760 £52,500
% change year-on-year -2.34% +2.40% +5.00%

Business Strategy
Job Vacancy Trend

Job postings citing Business Strategy as a proportion of all IT jobs advertised.
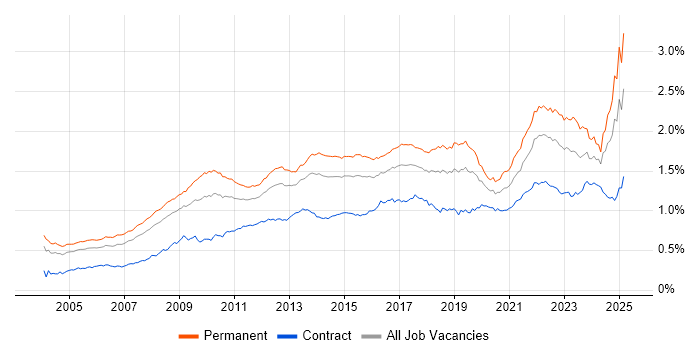
Job vacancy trend for Business Strategy in the UK

Business Strategy
Salary Trend

3-month moving average salary quoted in jobs citing Business Strategy.

Salary trend for Business Strategy in the UK

Business Strategy
Salary Histogram

Salary distribution for jobs citing Business Strategy over the 6 months to 11 October 2024.

Salary histogram for Business Strategy in the UK

Business Strategy
Top 18 Job Locations

The table below looks at the demand and provides a guide to the median salaries quoted in IT jobs citing Business Strategy within the UK over the 6 months to 11 October 2024. The 'Rank Change' column provides an indication of the change in demand within each location based on the same 6 month period last year.

Location Rank Change
on Same Period
Last Year
Matching
Permanent
IT Job Ads
Median Salary
Past 6 Months
Median Salary
% Change
on Same Period
Last Year
Live
Jobs
England +17 1,245 £67,500 -3.57% 478
UK excluding London +38 803 £65,000 +8.33% 243
London -15 509 £80,000 -3.03% 242
Work from Home +80 452 £67,500 -6.90% 720
North of England +65 261 £62,750 +0.40% 69
North West +57 154 £63,277 -5.21% 43
South East -28 142 £67,500 +3.85% 52
Midlands -23 134 £55,000 -8.33% 49
South West +37 114 £65,000 +23.81% 34
East of England -9 76 £68,750 -16.67% 22
West Midlands -26 71 £57,500 -8.00% 36
Scotland +31 65 £70,000 -15.48% 11
Yorkshire +8 63 £67,500 +17.39% 23
East Midlands -20 62 £45,000 -25.00% 13
North East +5 44 £55,000 -48.84% 3
Wales -2 10 £67,500 +98.53% 2
Northern Ireland +22 2 - - 14
Isle of Man - 1 - -

Business Strategy
Co-occurring Skills and Capabilities by Category

The follow tables expand on the table above by listing co-occurrences grouped by category. The same employment type, locality and period is covered with up to 20 co-occurrences shown in each of the following categories:

Application Platforms
1 33 (2.42%) SharePoint
2 25 (1.83%) Microsoft Exchange
3 13 (0.95%) Confluence
4 7 (0.51%) Apache Spark
5 6 (0.44%) IIS
6 5 (0.37%) CMS
7 4 (0.29%) Apache
7 4 (0.29%) SAS
8 3 (0.22%) OpenEdge
9 2 (0.15%) WordPress
10 1 (0.073%) Appian
Applications
1 66 (4.84%) Microsoft Excel
2 49 (3.60%) Microsoft Office
3 29 (2.13%) Microsoft PowerPoint
4 19 (1.39%) MS Visio
5 16 (1.17%) Microsoft Project
6 12 (0.88%) Chatbot
7 8 (0.59%) Simulink
8 6 (0.44%) Spreadsheet
9 3 (0.22%) Adobe XD
9 3 (0.22%) Oracle Smart View
9 3 (0.22%) Sketch
10 2 (0.15%) Trello
11 1 (0.073%) AutoCAD
11 1 (0.073%) Gliffy
11 1 (0.073%) Maya
11 1 (0.073%) Photoshop
11 1 (0.073%) Revit
Business Applications
1 16 (1.17%) Dynamics CRM
2 12 (0.88%) SAP SD
3 11 (0.81%) SAP ERP
4 10 (0.73%) Salesforce CRM
5 8 (0.59%) SAP S/4HANA
5 8 (0.59%) Sparx Enterprise Architect
6 6 (0.44%) SAP WM
7 4 (0.29%) Oracle ERP
7 4 (0.29%) SAP MM
8 3 (0.22%) Magento
8 3 (0.22%) NetSuite
8 3 (0.22%) SAP PP
9 2 (0.15%) Elite 3E
9 2 (0.15%) Infor LN
9 2 (0.15%) Lawson
9 2 (0.15%) Sage X3
9 2 (0.15%) SAP BPC
9 2 (0.15%) TIBCO iProcess
9 2 (0.15%) Unit4 Business World
10 1 (0.073%) SAP IBP
Cloud Services
1 223 (16.36%) Azure
2 205 (15.04%) AWS
3 87 (6.38%) Power Platform
4 53 (3.89%) Azure DevOps
5 50 (3.67%) Dynamics 365
6 49 (3.60%) Microsoft 365
7 39 (2.86%) GCP
8 32 (2.35%) SaaS
9 26 (1.91%) Azure Logic Apps
10 24 (1.76%) Cloud Computing
11 22 (1.61%) Azure Service Bus
11 22 (1.61%) PaaS
12 20 (1.47%) IaaS
13 19 (1.39%) Nutanix
14 18 (1.32%) Amazon S3
15 17 (1.25%) PowerApps
16 16 (1.17%) Azure Cosmos DB
16 16 (1.17%) Power Automate
17 12 (0.88%) Entra ID
17 12 (0.88%) Snowflake
Communications & Networking
1 37 (2.71%) LAN
2 30 (2.20%) DNS
3 29 (2.13%) WAN
4 27 (1.98%) Firewall
5 24 (1.76%) 4G
6 23 (1.69%) VPN
7 22 (1.61%) Wireless
8 21 (1.54%) Internet
9 17 (1.25%) Wi-Fi
10 15 (1.10%) Network Security
10 15 (1.10%) TCP/IP
11 13 (0.95%) DHCP
12 11 (0.81%) SD-WAN
13 8 (0.59%) Ethernet
13 8 (0.59%) RS-422
13 8 (0.59%) VSAN
14 7 (0.51%) Broadband
14 7 (0.51%) MPLS
15 5 (0.37%) RFID
15 5 (0.37%) VoIP
Database & Business Intelligence
1 168 (12.33%) Tableau
2 72 (5.28%) Power BI
3 49 (3.60%) Data Warehouse
4 47 (3.45%) Big Data
5 35 (2.57%) SQL Server
6 26 (1.91%) Data Mining
7 23 (1.69%) Amazon QuickSight
8 17 (1.25%) Amazon Athena
8 17 (1.25%) Amazon Redshift
9 15 (1.10%) Data Lake
10 14 (1.03%) DTS
10 14 (1.03%) Looker
11 12 (0.88%) Amazon RDS
12 10 (0.73%) BigQuery
12 10 (0.73%) MySQL
13 9 (0.66%) GIS
13 9 (0.66%) Power Query
14 8 (0.59%) Elasticsearch
14 8 (0.59%) Hadoop
15 7 (0.51%) BusinessObjects
Development Applications
1 117 (8.58%) Git
2 27 (1.98%) JIRA
3 8 (0.59%) Rational DOORS
4 7 (0.51%) Visual Studio
5 2 (0.15%) Bitbucket
5 2 (0.15%) Jenkins
5 2 (0.15%) Postman
5 2 (0.15%) Vagrant
6 1 (0.073%) LSMW
6 1 (0.073%) Maven
6 1 (0.073%) PowerDesigner
6 1 (0.073%) Visual Studio Code
General
1 619 (45.41%) Social Skills
2 418 (30.67%) Analytical Skills
3 408 (29.93%) Finance
4 190 (13.94%) Retail
5 175 (12.84%) Presentation Skills
6 123 (9.02%) Marketing
7 113 (8.29%) Law
8 94 (6.90%) Legal
9 86 (6.31%) Public Sector
10 77 (5.65%) Manufacturing
11 59 (4.33%) Banking
11 59 (4.33%) Inclusion and Diversity
12 44 (3.23%) Telecoms
13 34 (2.49%) Influencing Skills
14 23 (1.69%) Organisational Skills
15 19 (1.39%) Games
16 15 (1.10%) General Ledger
17 14 (1.03%) Automotive
18 13 (0.95%) Police
19 12 (0.88%) Pharmaceutical
Job Titles
1 332 (24.36%) Senior
2 268 (19.66%) Architect
3 257 (18.86%) Analyst
4 157 (11.52%) Senior Analyst
5 154 (11.30%) Data Analyst
6 124 (9.10%) Business Manager
7 117 (8.58%) Lead
7 117 (8.58%) Senior Data Analyst
8 85 (6.24%) Development Manager
9 83 (6.09%) Business Development Manager
10 73 (5.36%) Senior Manager
11 71 (5.21%) Solutions Architect
12 62 (4.55%) Business Architect
13 52 (3.82%) IT Manager
14 51 (3.74%) Enterprise Architect
15 47 (3.45%) Project Manager
16 46 (3.37%) Consultant
17 44 (3.23%) Senior Architect
18 43 (3.15%) Developer
19 36 (2.64%) Business Analyst
Libraries, Frameworks & Software Standards
1 47 (3.45%) .NET
2 23 (1.69%) Middleware
3 21 (1.54%) HTML
4 20 (1.47%) CSS
5 18 (1.32%) REST
5 18 (1.32%) XML
6 16 (1.17%) ARM Templates
6 16 (1.17%) Web Services
7 14 (1.03%) Kafka
8 12 (0.88%) React
9 10 (0.73%) JSON
10 9 (0.66%) RESTful
10 9 (0.66%) XSLT
11 7 (0.51%) .NET Framework
11 7 (0.51%) GraphQL
12 6 (0.44%) Entity Framework
13 5 (0.37%) RabbitMQ
13 5 (0.37%) XBRL
14 4 (0.29%) Oracle Fusion
15 3 (0.22%) TensorFlow
Miscellaneous
1 82 (6.02%) Management Information System
2 72 (5.28%) Product Ownership
3 48 (3.52%) Onboarding
4 36 (2.64%) Enterprise Software
5 33 (2.42%) Self-Motivation
6 32 (2.35%) Virtual Team
7 29 (2.13%) Data Structures
8 22 (1.61%) Analytical Mindset
9 21 (1.54%) IoT
10 19 (1.39%) Algorithms
10 19 (1.39%) Data Centre
10 19 (1.39%) Hybrid Cloud
11 16 (1.17%) Blockchain
12 14 (1.03%) Clustering
13 11 (0.81%) CCTV
13 11 (0.81%) Legacy Systems
13 11 (0.81%) Social Media
14 10 (0.73%) Enterprise Cloud
14 10 (0.73%) FMCG
15 9 (0.66%) Security Operations Centre
Operating Systems
1 34 (2.49%) Windows
2 17 (1.25%) Windows Server
3 10 (0.73%) Linux
3 10 (0.73%) VMS
4 2 (0.15%) Android
4 2 (0.15%) Apple iOS
4 2 (0.15%) Windows Vista
5 1 (0.073%) Unix
5 1 (0.073%) Windows 10
Processes & Methodologies
1 397 (29.13%) Problem-Solving
2 361 (26.49%) Agile
3 271 (19.88%) Analytics
4 203 (14.89%) Project Management
5 202 (14.82%) Roadmaps
6 197 (14.45%) Data Analysis
7 184 (13.50%) Visualisation
8 160 (11.74%) Decision-Making
9 158 (11.59%) Mentoring
10 152 (11.15%) Mathematics
11 151 (11.08%) Stakeholder Engagement
12 145 (10.64%) Actionable Insight
13 143 (10.49%) Business Intelligence
14 142 (10.42%) Strategic Thinking
15 141 (10.34%) Business Development
16 140 (10.27%) Stakeholder Management
17 129 (9.46%) Statistics
18 127 (9.32%) DevOps
18 127 (9.32%) IT Strategy
19 121 (8.88%) Continuous Improvement
Programming Languages
1 262 (19.22%) SQL
2 174 (12.77%) Python
3 34 (2.49%) C#
4 29 (2.13%) PowerShell
5 28 (2.05%) R
6 26 (1.91%) JavaScript
7 17 (1.25%) Java
8 16 (1.17%) C++
9 13 (0.95%) PL/SQL
10 11 (0.81%) PHP
11 9 (0.66%) VB
12 6 (0.44%) Data Analysis Expressions
12 6 (0.44%) T-SQL
13 5 (0.37%) TypeScript
14 4 (0.29%) C
15 3 (0.22%) Bicep
16 2 (0.15%) Apex Code
16 2 (0.15%) VB6
17 1 (0.073%) VB.NET
17 1 (0.073%) VBA
Qualifications
1 410 (30.08%) Degree
2 110 (8.07%) DBS Check
3 73 (5.36%) Master's Degree
4 60 (4.40%) Security Cleared
5 59 (4.33%) Computer Science Degree
6 31 (2.27%) SC Cleared
7 29 (2.13%) MBA
8 23 (1.69%) Microsoft Certification
9 22 (1.61%) BPSS Clearance
10 20 (1.47%) ACCA
10 20 (1.47%) CIMA
10 20 (1.47%) PMI Certification
11 18 (1.32%) CFA
11 18 (1.32%) PMP
12 16 (1.17%) Azure Certification
12 16 (1.17%) TOGAF Certification
13 13 (0.95%) Cisco Certification
13 13 (0.95%) HNC
14 11 (0.81%) CISSP
15 9 (0.66%) CCNA
Quality Assurance & Compliance
1 42 (3.08%) QA
2 33 (2.42%) SLA
3 22 (1.61%) ISO/IEC 27001
3 22 (1.61%) PMO
4 20 (1.47%) Data Quality
5 14 (1.03%) ISO 22301
5 14 (1.03%) NIST
6 13 (0.95%) GDPR
7 10 (0.73%) Accessibility
7 10 (0.73%) Cyber Essentials
8 8 (0.59%) PCI DSS
9 6 (0.44%) GRC
10 5 (0.37%) COBIT
10 5 (0.37%) Def Stans
10 5 (0.37%) IEC 61508
10 5 (0.37%) NCSC
10 5 (0.37%) Sarbanes-Oxley
11 4 (0.29%) Cyber Essentials PLUS
11 4 (0.29%) ISO 20022
12 3 (0.22%) ITGC
System Software
1 44 (3.23%) Active Directory
2 29 (2.13%) VMware Infrastructure
3 12 (0.88%) VMware ESXi
4 8 (0.59%) vSphere
5 7 (0.51%) Virtual Desktop
6 6 (0.44%) Docker
6 6 (0.44%) Hyper-V
6 6 (0.44%) Virtual Machines
7 2 (0.15%) LXC
Systems Management
1 20 (1.47%) FortiGate
2 14 (1.03%) Ansible
3 13 (0.95%) Kubernetes
4 11 (0.81%) Terraform
5 10 (0.73%) Failover Clustering
6 6 (0.44%) Microsoft Clustering
7 4 (0.29%) IBM BigFix
8 2 (0.15%) Microsoft Intune
8 2 (0.15%) vCenter Server
9 1 (0.073%) CSIRT
9 1 (0.073%) Netcool
Vendors
1 243 (17.83%) Microsoft
2 107 (7.85%) Databricks
3 64 (4.70%) SAP
4 51 (3.74%) Salesforce
5 39 (2.86%) Google
6 33 (2.42%) Oracle
7 31 (2.27%) YouTube
8 29 (2.13%) VMware
9 12 (0.88%) Cisco
10 11 (0.81%) HP
10 11 (0.81%) Intel
10 11 (0.81%) NetApp
11 9 (0.66%) ServiceNow
12 8 (0.59%) Alteryx
12 8 (0.59%) Computacenter
12 8 (0.59%) Sparx
12 8 (0.59%) SYSPRO
13 7 (0.51%) Adobe
13 7 (0.51%) Cadence
14 6 (0.44%) Dell