Programme Management (Program Management)
UK

The following table provides summary statistics for permanent job vacancies with a requirement for Programme Management skills. Included is a benchmarking guide to the salaries offered in vacancies that have cited Programme Management over the 6 months to 28 November 2023 with a comparison to the same period in the previous 2 years.

6 months to
28 Nov 2023
Same period 2022 Same period 2021
Rank 289 298 318
Rank change year-on-year +9 +20 -38
Permanent jobs citing Programme Management 583 1,547 1,441
As % of all permanent jobs advertised in the UK 1.07% 1.23% 1.12%
As % of the Processes & Methodologies category 1.14% 1.29% 1.18%
Number of salaries quoted 407 993 1,046
10th Percentile £36,250 £38,400 £40,000
25th Percentile £45,000 £47,500 £46,750
Median annual salary (50th Percentile) £58,750 £65,000 £65,000
Median % change year-on-year -9.62% - +18.18%
75th Percentile £72,500 £85,000 £85,000
90th Percentile £90,000 £100,000 £101,000
UK excluding London median annual salary £55,000 £56,500 £55,000
% change year-on-year -2.65% +2.73% +4.76%

All Process and Methodology Skills
UK

Programme Management is in the Processes and Methodologies category. The following table is for comparison with the above and provides summary statistics for all permanent job vacancies with a requirement for process or methodology skills.

Permanent vacancies with a requirement for process or methodology skills 51,121 120,104 122,523
As % of all permanent jobs advertised in the UK 94.09% 95.72% 95.43%
Number of salaries quoted 36,956 73,203 81,032
10th Percentile £32,500 £34,313 £32,500
25th Percentile £43,750 £45,000 £42,500
Median annual salary (50th Percentile) £60,000 £60,000 £59,000
Median % change year-on-year - +1.69% +7.27%
75th Percentile £80,000 £81,250 £77,500
90th Percentile £98,750 £100,000 £95,000
UK excluding London median annual salary £52,500 £53,000 £50,000
% change year-on-year -0.94% +6.00% +4.17%

Programme Management
Job Vacancy Trend

Job postings citing Programme Management as a proportion of all IT jobs advertised.
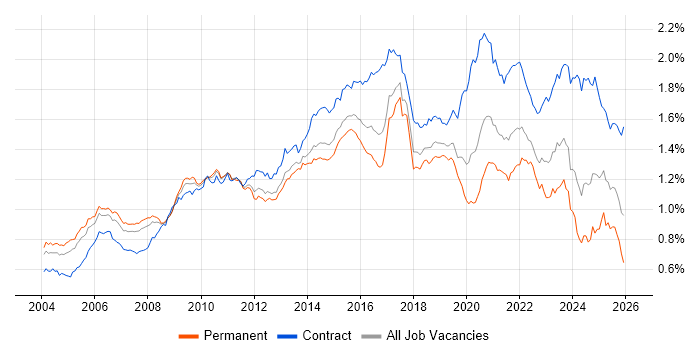
Job vacancy trend for Programme Management in the UK

Programme Management
Salary Trend

3-month moving average salary quoted in jobs citing Programme Management.

Salary trend for Programme Management in the UK

Programme Management
Salary Histogram

Salary distribution for jobs citing Programme Management over the 6 months to 28 November 2023.

Salary histogram for Programme Management in the UK

Programme Management
Top 16 Job Locations

The table below looks at the demand and provides a guide to the median salaries quoted in IT jobs citing Programme Management within the UK over the 6 months to 28 November 2023. The 'Rank Change' column provides an indication of the change in demand within each location based on the same 6 month period last year.

Location Rank Change
on Same Period
Last Year
Matching
Permanent
IT Job Ads
Median Salary
Past 6 Months
Median Salary
% Change
on Same Period
Last Year
Live
Jobs
England -14 495 £60,000 -7.69% 359
UK excluding London +33 365 £55,000 -2.65% 230
Work from Home -17 216 £57,250 -8.40% 179
South West +49 139 £48,155 +1.38% 24
London -28 138 £70,000 -9.68% 159
South East +61 86 £60,000 -14.29% 63
Midlands +38 55 £55,000 +10.00% 37
North of England +40 41 £57,500 -1.71% 43
West Midlands +12 37 £65,000 +30.00% 33
North West +82 30 £57,500 +0.70% 33
Scotland +47 25 £55,000 -23.04% 26
East Midlands +52 15 £47,000 +77.36% 4
Northern Ireland +50 15 £65,000 -19.75% 12
Yorkshire +38 11 £31,250 -46.58% 8
Wales +8 11 £65,500 +21.67% 1
East of England +79 9 £55,000 -8.33% 31

Programme Management
Co-occurring Skills and Capabilities by Category

The follow tables expand on the table above by listing co-occurrences grouped by category. The same employment type, locality and period is covered with up to 20 co-occurrences shown in each of the following categories:

Application Platforms
1 18 (3.09%) SAS
2 16 (2.74%) SharePoint
3 12 (2.06%) Confluence
4 5 (0.86%) MS Exchange
5 3 (0.51%) CMS
6 2 (0.34%) WordPress
7 1 (0.17%) Artix
7 1 (0.17%) IIS
7 1 (0.17%) Skype for Business
7 1 (0.17%) ThingWorx
Applications
1 57 (9.78%) Microsoft Office
2 52 (8.92%) Microsoft Project
3 44 (7.55%) Microsoft Excel
4 24 (4.12%) Microsoft PowerPoint
5 14 (2.40%) MS Visio
6 7 (1.20%) Simulink
7 4 (0.69%) OrCAD
8 2 (0.34%) Open Workbench
8 2 (0.34%) SOLIDWORKS
8 2 (0.34%) Spreadsheet
8 2 (0.34%) TargetLink
9 1 (0.17%) AutoCAD
9 1 (0.17%) CATIA
9 1 (0.17%) SPSS
Business Applications
1 21 (3.60%) Primavera
2 10 (1.72%) SAP S/4HANA
3 3 (0.51%) SAP Oil and Gas
4 2 (0.34%) Cerner Millennium
4 2 (0.34%) Dynamics CRM
5 1 (0.17%) Magento
5 1 (0.17%) NetSuite
5 1 (0.17%) Oracle EBS
5 1 (0.17%) Oracle EBS R12
5 1 (0.17%) Oracle ERP
5 1 (0.17%) Remedy ITSM
5 1 (0.17%) SAP Business One
5 1 (0.17%) SAP ERP
Cloud Services
1 71 (12.18%) Azure
2 41 (7.03%) Power Platform
3 35 (6.00%) AWS
4 20 (3.43%) Microsoft 365
5 15 (2.57%) SaaS
6 9 (1.54%) Cloud Computing
7 7 (1.20%) GCP
8 6 (1.03%) Entra ID
9 5 (0.86%) IaaS
9 5 (0.86%) PaaS
10 4 (0.69%) ChatGPT
10 4 (0.69%) GitHub
11 3 (0.51%) Azure DevOps
12 2 (0.34%) Amazon CloudWatch
12 2 (0.34%) Azure Cognitive Services
12 2 (0.34%) Azure Machine Learning
12 2 (0.34%) Dynamics 365
12 2 (0.34%) Google Workspace
12 2 (0.34%) PowerApps
12 2 (0.34%) Smartsheet
Communications & Networking
1 17 (2.92%) Wireless
2 16 (2.74%) Firewall
3 15 (2.57%) WAN
4 11 (1.89%) LAN
5 10 (1.72%) 5G
6 8 (1.37%) LTE
7 7 (1.20%) 4G
7 7 (1.20%) SD-WAN
8 6 (1.03%) MQTT
8 6 (1.03%) Software-Defined Radio
9 5 (0.86%) 3G
9 5 (0.86%) DNS
9 5 (0.86%) FlexRay
9 5 (0.86%) TCP/IP
10 4 (0.69%) 3GPP
10 4 (0.69%) 5G NR
10 4 (0.69%) DHCP
10 4 (0.69%) HTTP
10 4 (0.69%) Network Security
10 4 (0.69%) VPN
Database & Business Intelligence
1 28 (4.80%) Power BI
2 17 (2.92%) Tableau
3 16 (2.74%) Data Mining
4 15 (2.57%) Amazon QuickSight
5 9 (1.54%) SQL Server
6 6 (1.03%) MySQL
7 4 (0.69%) PostgreSQL
8 3 (0.51%) Data Warehouse
8 3 (0.51%) Electronic Patient Records
8 3 (0.51%) Relational Database
9 2 (0.34%) Microsoft Analysis Services
9 2 (0.34%) SQL Server Analysis Services
9 2 (0.34%) SQL Server Reporting Services
10 1 (0.17%) DTS
10 1 (0.17%) OLAP
10 1 (0.17%) Oracle Reports
10 1 (0.17%) QlikView
10 1 (0.17%) RDBMS
10 1 (0.17%) SQL Server Integration Services
10 1 (0.17%) SQLite
Development Applications
1 28 (4.80%) JIRA
2 17 (2.92%) Git
3 7 (1.20%) Jenkins
3 7 (1.20%) Selenium
4 6 (1.03%) CMake
5 5 (0.86%) LabVIEW
6 4 (0.69%) JMeter
6 4 (0.69%) Subversion
6 4 (0.69%) TeamCity
6 4 (0.69%) Visual Studio
7 3 (0.51%) HP UFT
7 3 (0.51%) JUnit
7 3 (0.51%) Rational DOORS
7 3 (0.51%) SoapUI
7 3 (0.51%) Visual Studio Team System
8 2 (0.34%) Maven
9 1 (0.17%) Cucumber
9 1 (0.17%) Eclipse
9 1 (0.17%) Rational Rhapsody
9 1 (0.17%) WebDriver
General
1 303 (51.97%) Finance
2 231 (39.62%) Public Sector
3 210 (36.02%) Manufacturing
4 209 (35.85%) Social Skills
5 201 (34.48%) Marketing
6 196 (33.62%) Telecoms
7 185 (31.73%) Electronics
8 76 (13.04%) Analytical Skills
9 43 (7.38%) Retail
10 36 (6.17%) Legal
11 30 (5.15%) Presentation Skills
12 19 (3.26%) Influencing Skills
13 18 (3.09%) Aerospace
14 16 (2.74%) Automotive
15 12 (2.06%) Inclusion and Diversity
16 11 (1.89%) Military
16 11 (1.89%) Organisational Skills
17 7 (1.20%) Pharmaceutical
18 6 (1.03%) Local Government
18 6 (1.03%) Police
Job Titles
1 119 (20.41%) Project Manager
2 110 (18.87%) Senior
3 59 (10.12%) Programme Manager
4 52 (8.92%) Lead
5 50 (8.58%) Senior Manager
6 44 (7.55%) IT Manager
7 35 (6.00%) Architect
8 34 (5.83%) Software Engineer
9 32 (5.49%) Analyst
9 32 (5.49%) Senior Project Manager
10 28 (4.80%) IT Project Manager
11 25 (4.29%) Developer
12 24 (4.12%) Business Analyst
12 24 (4.12%) Embedded Engineer
13 23 (3.95%) DV Cleared Project Manager
14 19 (3.26%) Electronics Engineer
14 19 (3.26%) Graduate
14 19 (3.26%) Support Engineer
15 18 (3.09%) Consultant
16 16 (2.74%) Project Engineer
Libraries, Frameworks & Software Standards
1 21 (3.60%) React
2 15 (2.57%) .NET
2 15 (2.57%) AngularJS
3 14 (2.40%) Spring
4 8 (1.37%) .NET Core
4 8 (1.37%) PyTorch
5 7 (1.20%) RESTful
5 7 (1.20%) TensorFlow
6 6 (1.03%) HTML
7 5 (0.86%) EDI
8 4 (0.69%) ASP.NET
8 4 (0.69%) CNTK
8 4 (0.69%) CSS
8 4 (0.69%) Flask
8 4 (0.69%) Laravel
8 4 (0.69%) OpenVINO
8 4 (0.69%) STL
9 3 (0.51%) HTML5 Canvas
9 3 (0.51%) Middleware
9 3 (0.51%) SOAP
Miscellaneous
1 34 (5.83%) Self-Motivation
2 30 (5.15%) Onboarding
3 20 (3.43%) PMI
4 19 (3.26%) Driving Licence
4 19 (3.26%) Management Information System
5 15 (2.57%) Embedded Systems
6 14 (2.40%) FPGA
7 13 (2.23%) Product Ownership
8 11 (1.89%) IoT
9 10 (1.72%) NHS
9 10 (1.72%) VHDL
10 9 (1.54%) Algorithms
10 9 (1.54%) Verilog
11 8 (1.37%) Arduino
11 8 (1.37%) Public Cloud
11 8 (1.37%) Raspberry Pi
12 7 (1.20%) Analytical Mindset
12 7 (1.20%) Data Centre
12 7 (1.20%) Operational Technology
13 4 (0.69%) Analogue Electronics
Operating Systems
1 42 (7.20%) Windows
2 22 (3.77%) Linux
3 8 (1.37%) Android
4 6 (1.03%) Windows Server
5 5 (0.86%) Windows 10
6 2 (0.34%) Apple iOS
6 2 (0.34%) Windows Server 2012
6 2 (0.34%) Windows Server 2016
7 1 (0.17%) Embedded Linux
7 1 (0.17%) FreeRTOS
7 1 (0.17%) Windows 7
Processes & Methodologies
1 241 (41.34%) Project Management
2 225 (38.59%) Business Intelligence
3 202 (34.65%) Agile
4 184 (31.56%) Digital Marketing
5 135 (23.16%) PRINCE2
6 132 (22.64%) Problem-Solving
7 129 (22.13%) Stakeholder Management
8 124 (21.27%) Project Delivery
9 89 (15.27%) Change Management
10 74 (12.69%) Continuous Improvement
11 71 (12.18%) Business Case
11 71 (12.18%) Software Engineering
12 65 (11.15%) Computer Science
13 64 (10.98%) Waterfall
14 60 (10.29%) Scrum
15 59 (10.12%) Risk Management
16 52 (8.92%) Business Analysis
17 51 (8.75%) Mentoring
18 47 (8.06%) SDLC
19 45 (7.72%) Service Delivery
Programming Languages
1 71 (12.18%) Python
2 49 (8.40%) C
3 36 (6.17%) SQL
4 35 (6.00%) C#
5 31 (5.32%) C++
5 31 (5.32%) MATLAB
6 30 (5.15%) Java
7 24 (4.12%) JavaScript
8 16 (2.74%) R
9 10 (1.72%) Embedded C
10 8 (1.37%) PHP
11 5 (0.86%) Bash
11 5 (0.86%) PowerShell
12 4 (0.69%) TypeScript
13 3 (0.51%) Assembly Language
13 3 (0.51%) Embedded C++
13 3 (0.51%) Kusto Query Language
14 1 (0.17%) COBOL
14 1 (0.17%) VB
14 1 (0.17%) VBA
Qualifications
1 163 (27.96%) Degree
2 109 (18.70%) Security Cleared
3 55 (9.43%) PMI Certification
4 53 (9.09%) DV Cleared
5 51 (8.75%) PMP
6 49 (8.40%) SC Cleared
7 38 (6.52%) Computer Science Degree
8 33 (5.66%) BPSS Clearance
9 25 (4.29%) DBS Check
10 15 (2.57%) Master's Degree
11 7 (1.20%) HND
11 7 (1.20%) PRINCE2 Certification
12 6 (1.03%) HNC
12 6 (1.03%) PhD
13 4 (0.69%) ITIL Certification
13 4 (0.69%) PgMP
14 3 (0.51%) Azure Certification
14 3 (0.51%) TOGAF Certification
15 2 (0.34%) APMP
15 2 (0.34%) CSPO
Quality Assurance & Compliance
1 88 (15.09%) QA
2 83 (14.24%) PMO
3 11 (1.89%) ISO/IEC 27001
4 6 (1.03%) Cyber Essentials
4 6 (1.03%) ISO 26262
5 5 (0.86%) MISRA
5 5 (0.86%) NIST
5 5 (0.86%) P3O
5 5 (0.86%) SLA
6 4 (0.69%) Def Stans
7 3 (0.51%) Data Quality
8 2 (0.34%) AUTOSAR
8 2 (0.34%) Cyber Essentials PLUS
8 2 (0.34%) DO-160
8 2 (0.34%) DO-254
8 2 (0.34%) ISO 9001
9 1 (0.17%) GAAP
9 1 (0.17%) HL7
9 1 (0.17%) PCI DSS
9 1 (0.17%) Sarbanes-Oxley
System Software
1 21 (3.60%) Firmware
2 12 (2.06%) Active Directory
3 11 (1.89%) Embedded Firmware
4 8 (1.37%) VMware Infrastructure
5 6 (1.03%) Hyper-V
6 2 (0.34%) Docker
7 1 (0.17%) NFS
7 1 (0.17%) Virtual Desktop
7 1 (0.17%) XenDesktop
Systems Management
1 4 (0.69%) Terraform
2 3 (0.51%) Functional Safety
2 3 (0.51%) Grafana
2 3 (0.51%) Microsoft Intune
3 2 (0.34%) Kubernetes
4 1 (0.17%) Active Directory Federation Services
4 1 (0.17%) Nmap
4 1 (0.17%) Prometheus
4 1 (0.17%) Tivoli
Vendors
1 209 (35.85%) SAP
2 113 (19.38%) Microsoft
3 14 (2.40%) Google
4 13 (2.23%) ServiceNow
5 11 (1.89%) Citrix
6 9 (1.54%) Salesforce
6 9 (1.54%) Sun
6 9 (1.54%) VMware
7 8 (1.37%) EMC
8 5 (0.86%) Apple
8 5 (0.86%) Cadence
8 5 (0.86%) Oracle
8 5 (0.86%) Xilinx
9 4 (0.69%) Cisco
9 4 (0.69%) NEC
9 4 (0.69%) NetApp
10 3 (0.51%) Aruba
10 3 (0.51%) IBM
10 3 (0.51%) NVIDIA
10 3 (0.51%) Qualys