Architect
UK

The median Architect salary in the UK is £85,000 per year according to job vacancies posted during the 6 months to 2 December 2023.

The first table below provides salary benchmarking and summary statistics including a comparison to same period in the previous 2 years.

6 months to
2 Dec 2023
Same period 2022 Same period 2021
Rank 20 51 51
Rank change year-on-year +31 0 -6
Permanent jobs requiring an Architect 4,836 7,569 7,846
As % of all permanent jobs advertised in the UK 9.06% 6.04% 6.07%
As % of the Job Titles category 9.50% 6.33% 6.38%
Number of salaries quoted 2,368 4,949 5,291
10th Percentile £62,000 £61,250 £60,000
25th Percentile £70,000 £72,500 £70,000
Median annual salary (50th Percentile) £85,000 £85,000 £82,500
Median % change year-on-year - +3.03% +6.45%
75th Percentile £97,500 £100,000 £97,500
90th Percentile £112,500 £115,000 £110,250
UK excluding London median annual salary £77,500 £80,000 £75,000
% change year-on-year -3.13% +6.67% +7.14%

All Permanent IT Job Vacancies
UK

The following table is for comparison with the above and includes summary statistics for all permanent IT job vacancies. Most job vacancies include a discernible job title that can be normalized. As such, the figures in the second row provide an indication of the number of permanent jobs in our overall sample.

Permanent vacancies in the UK with a recognized job title 50,923 119,491 123,020
% of permanent jobs with a recognized job title 95.43% 95.34% 95.11%
Number of salaries quoted 37,248 74,881 84,496
10th Percentile £31,250 £32,750 £32,005
25th Percentile £42,500 £45,000 £42,500
Median annual salary (50th Percentile) £60,000 £60,000 £57,500
Median % change year-on-year - +4.35% +4.55%
75th Percentile £80,000 £81,250 £77,500
90th Percentile £97,500 £98,750 £95,000
UK excluding London median annual salary £52,500 £52,500 £50,000
% change year-on-year - +5.00% +5.26%

Architect
Job Vacancy Trend

Job postings that featured Architect in the job title as a proportion of all IT jobs advertised.
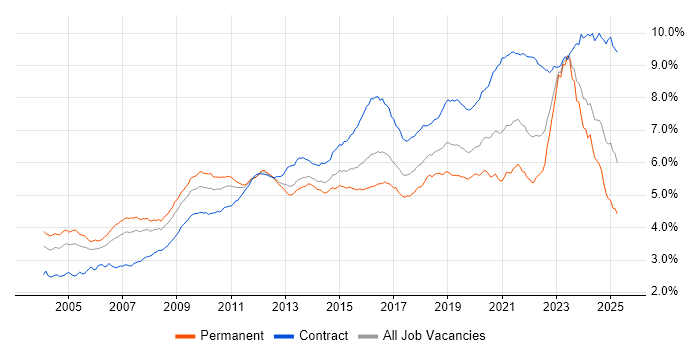
Job vacancy trend for Architect in the UK

Architect
Salary Trend

3-month moving average salary quoted in jobs citing Architect.

Salary trend for Architect in the UK

Architect
Salary Histogram

Salary distribution for jobs citing Architect over the 6 months to 2 December 2023.

Salary histogram for Architect in the UK

Architect
Top 18 Job Locations

The table below looks at the demand and provides a guide to the median salaries quoted in IT jobs citing Architect within the UK over the 6 months to 2 December 2023. The 'Rank Change' column provides an indication of the change in demand within each location based on the same 6 month period last year.

Location Rank Change
on Same Period
Last Year
Matching
Permanent
IT Job Ads
Median Salary
Past 6 Months
Median Salary
% Change
on Same Period
Last Year
Live
Jobs
England +30 3,857 £85,000 - 1,269
UK excluding London +41 2,931 £77,500 -3.13% 735
Work from Home +35 2,370 £82,500 -2.94% 675
London +15 1,491 £90,000 -2.70% 565
North of England +48 868 £79,632 +2.75% 181
South West +40 507 £71,538 -4.62% 106
North West +58 466 £79,632 +2.75% 95
South East +24 456 £83,750 +4.69% 211
Yorkshire +37 376 £79,632 +6.18% 65
Scotland +39 373 £70,576 -8.93% 40
Midlands +19 343 £80,375 +3.71% 117
West Midlands -6 171 £80,000 +3.23% 81
East Midlands +58 170 £82,500 +10.00% 35
Wales +57 167 £66,000 -4.96% 14
East of England +26 130 £80,000 -5.88% 73
Northern Ireland +80 123 £68,750 -31.25% 8
North East +23 37 £85,000 +9.68% 21
Channel Islands - 1 £100,000 -

Architect Skill Set
Top 30 Co-occurring Skills and Capabilities

For the 6 months to 2 December 2023, Architect job roles required the following skills and capabilities in order of popularity. The figures indicate the absolute number co-occurrences and as a proportion of all permanent job ads featuring Architect in the job title.

1 2,176 (45.00%) Agile
2 1,846 (38.17%) Finance
3 1,835 (37.94%) Azure
4 1,469 (30.38%) Social Skills
5 1,467 (30.33%) Actionable Insight
6 1,296 (26.80%) Roadmaps
7 1,006 (20.80%) Enterprise Architecture
8 976 (20.18%) Security Cleared
9 941 (19.46%) Microsoft
10 916 (18.94%) TOGAF
11 871 (18.01%) AWS
12 762 (15.76%) Presales
13 753 (15.57%) DevOps
14 689 (14.25%) SaaS
15 674 (13.94%) PaaS
16 666 (13.77%) Banking
17 648 (13.40%) Microservices
18 625 (12.92%) SC Cleared
19 621 (12.84%) IaaS
20 602 (12.45%) Analytics
21 601 (12.43%) Problem-Solving
22 598 (12.37%) Cybersecurity
23 596 (12.32%) IT Strategy
24 568 (11.75%) Power Platform
25 519 (10.73%) Technology Strategy
26 518 (10.71%) Thought Leadership
27 517 (10.69%) Mentoring
28 483 (9.99%) Strategic Roadmap
29 480 (9.93%) GCP
30 478 (9.88%) Degree

Architect Skill Set
Co-occurring Skills and Capabilities by Category

The follow tables expand on the table above by listing co-occurrences grouped by category. The same employment type, locality and period is covered with up to 20 co-occurrences shown in each of the following categories:

Application Platforms
1 62 (1.28%) Apache Spark
2 50 (1.03%) SharePoint
3 40 (0.83%) CMS
4 34 (0.70%) Apache
5 27 (0.56%) Confluence
6 19 (0.39%) Tomcat
7 18 (0.37%) Anypoint
7 18 (0.37%) Jetty
8 12 (0.25%) Adobe Experience Manager
9 9 (0.19%) Oracle SOA Suite
10 8 (0.17%) IIS
10 8 (0.17%) Kentico
11 7 (0.14%) OpenStack
12 6 (0.12%) MS Exchange
12 6 (0.12%) nginx
13 4 (0.083%) Drupal
14 2 (0.041%) Apache Airflow
14 2 (0.041%) Appian
14 2 (0.041%) Oracle Workflow
14 2 (0.041%) WordPress
Applications
1 14 (0.29%) Microsoft Office
2 10 (0.21%) MS Visio
3 4 (0.083%) Chatbot
3 4 (0.083%) Microsoft PowerPoint
4 3 (0.062%) Microsoft Excel
4 3 (0.062%) Simulink
5 2 (0.041%) Adobe Illustrator
5 2 (0.041%) CANalyzer
5 2 (0.041%) Photoshop
6 1 (0.021%) AutoCAD
6 1 (0.021%) SketchUp
Business Applications
1 242 (5.00%) Dynamics CRM
2 92 (1.90%) SAP S/4HANA
3 22 (0.45%) SAP ERP
4 21 (0.43%) Remedy ITSM
5 18 (0.37%) Elite 3E
5 18 (0.37%) SAP CO
5 18 (0.37%) Sparx Enterprise Architect
6 17 (0.35%) SAP FI
7 15 (0.31%) SAP FI/CO
8 14 (0.29%) Oracle EBS
9 8 (0.17%) Endur
9 8 (0.17%) Magento
9 8 (0.17%) SAP SCM
10 7 (0.14%) SAP SD
11 6 (0.12%) SAP EWM
11 6 (0.12%) SAP MM
12 5 (0.10%) Oracle ERP
12 5 (0.10%) SAP MDG
12 5 (0.10%) SAP PP
12 5 (0.10%) SAP QM
Cloud Services
1 1,835 (37.94%) Azure
2 871 (18.01%) AWS
3 689 (14.25%) SaaS
4 674 (13.94%) PaaS
5 621 (12.84%) IaaS
6 568 (11.75%) Power Platform
7 480 (9.93%) GCP
8 455 (9.41%) Dynamics 365
9 352 (7.28%) Serverless
10 295 (6.10%) Azure DevOps
11 237 (4.90%) Azure Functions
12 190 (3.93%) Microsoft 365
13 56 (1.16%) Cloud Computing
14 54 (1.12%) Azure Data Factory
14 54 (1.12%) Entra ID
15 48 (0.99%) GitHub
15 48 (0.99%) OpenShift
16 42 (0.87%) AWS CloudFormation
16 42 (0.87%) Snowflake
17 41 (0.85%) Azure Synapse Analytics
Communications & Networking
1 133 (2.75%) Firewall
2 103 (2.13%) SAN
3 102 (2.11%) WAN
4 93 (1.92%) LAN
5 90 (1.86%) VPN
6 60 (1.24%) Network Security
7 56 (1.16%) Internet
8 52 (1.08%) OSPF
8 52 (1.08%) SD-WAN
8 52 (1.08%) Wireless
9 51 (1.05%) BGP
10 49 (1.01%) DNS
11 48 (0.99%) VSAT
12 47 (0.97%) MPLS
13 44 (0.91%) VLAN
14 38 (0.79%) TCP/IP
15 36 (0.74%) DHCP
16 25 (0.52%) Cisco Firepower
17 24 (0.50%) HTTP
18 23 (0.48%) NGFW
Database & Business Intelligence
1 280 (5.79%) Data Warehouse
2 246 (5.09%) Data Lake
3 184 (3.80%) NoSQL
4 173 (3.58%) SQL Server
5 146 (3.02%) Big Data
6 106 (2.19%) Power BI
7 83 (1.72%) Relational Database
8 70 (1.45%) MySQL
9 52 (1.08%) Hadoop
10 47 (0.97%) Azure SQL Database
11 40 (0.83%) Metadata
12 38 (0.79%) BigQuery
12 38 (0.79%) PostgreSQL
13 34 (0.70%) Amazon RDS
14 30 (0.62%) Tableau
15 29 (0.60%) DynamoDB
15 29 (0.60%) MongoDB
16 26 (0.54%) Data Mining
16 26 (0.54%) Elasticsearch
17 25 (0.52%) Amazon Redshift
Development Applications
1 94 (1.94%) Jenkins
2 56 (1.16%) JIRA
3 39 (0.81%) Git
4 27 (0.56%) GitLab
5 17 (0.35%) ERwin
6 13 (0.27%) CircleCI
7 11 (0.23%) Selenium
8 9 (0.19%) Atlassian Bamboo
8 9 (0.19%) Sonatype Nexus
9 8 (0.17%) Bitbucket
9 8 (0.17%) Visual Studio
10 6 (0.12%) ER Studio
10 6 (0.12%) Maven
11 5 (0.10%) Artifactory
11 5 (0.10%) Oracle Forms
12 4 (0.083%) Cucumber
12 4 (0.083%) SonarQube
13 3 (0.062%) Subversion
14 2 (0.041%) PowerDesigner
14 2 (0.041%) Rational DOORS
General
1 1,846 (38.17%) Finance
2 1,469 (30.38%) Social Skills
3 666 (13.77%) Banking
4 290 (6.00%) Retail
5 261 (5.40%) Analytical Skills
6 230 (4.76%) Presentation Skills
7 229 (4.74%) Games
7 229 (4.74%) Inclusion and Diversity
8 161 (3.33%) Public Sector
9 149 (3.08%) Telecoms
10 123 (2.54%) Marketing
11 83 (1.72%) Legal
12 81 (1.67%) Influencing Skills
13 76 (1.57%) Law
14 69 (1.43%) Organisational Skills
15 52 (1.08%) Manufacturing
16 41 (0.85%) Publishing
17 34 (0.70%) Aerospace
18 32 (0.66%) Retail Banking
19 24 (0.50%) Local Government
Libraries, Frameworks & Software Standards
1 229 (4.74%) Middleware
2 205 (4.24%) .NET
3 175 (3.62%) Kafka
4 159 (3.29%) REST
5 136 (2.81%) OpenID
6 132 (2.73%) JSON
7 112 (2.32%) Spring
8 94 (1.94%) HTML
8 94 (1.94%) Web Services
9 78 (1.61%) React
10 65 (1.34%) SOAP
11 63 (1.30%) XML
12 55 (1.14%) Node.js
13 52 (1.08%) YAML
14 49 (1.01%) Spring Boot
15 45 (0.93%) JWT
15 45 (0.93%) RabbitMQ
16 41 (0.85%) RESTful
17 40 (0.83%) CSS
18 38 (0.79%) ARM Templates
Miscellaneous
1 391 (8.09%) Public Cloud
2 256 (5.29%) Cloud Native
3 163 (3.37%) Data Centre
4 132 (2.73%) Private Cloud
5 127 (2.63%) Blockchain
6 126 (2.61%) Product Ownership
7 121 (2.50%) Mainframe
8 103 (2.13%) Enterprise Software
9 97 (2.01%) Management Information System
10 93 (1.92%) Virtual Team
11 90 (1.86%) Data Structures
12 88 (1.82%) Hybrid Cloud
13 59 (1.22%) Legacy Systems
14 48 (0.99%) Cyberattack
15 45 (0.93%) Distributed Systems
16 36 (0.74%) IoT
17 34 (0.70%) Greenfield Project
17 34 (0.70%) PKI
17 34 (0.70%) Robotics
18 33 (0.68%) Self-Motivation
Operating Systems
1 272 (5.62%) Linux
2 230 (4.76%) Windows
3 116 (2.40%) Unix
4 48 (0.99%) Android
5 39 (0.81%) Windows Server
6 33 (0.68%) Ubuntu
7 29 (0.60%) Apple iOS
8 18 (0.37%) Red Hat Enterprise Linux
8 18 (0.37%) VMS
9 14 (0.29%) SUSE
9 14 (0.29%) Windows Server 2012
10 13 (0.27%) HPUX
10 13 (0.27%) Solaris
11 7 (0.14%) Mac OS
12 2 (0.041%) Windows 10
13 1 (0.021%) AIX
13 1 (0.021%) CentOS
13 1 (0.021%) Windows Server 2003
Processes & Methodologies
1 2,176 (45.00%) Agile
2 1,467 (30.33%) Actionable Insight
3 1,296 (26.80%) Roadmaps
4 1,006 (20.80%) Enterprise Architecture
5 916 (18.94%) TOGAF
6 762 (15.76%) Presales
7 753 (15.57%) DevOps
8 648 (13.40%) Microservices
9 602 (12.45%) Analytics
10 601 (12.43%) Problem-Solving
11 598 (12.37%) Cybersecurity
12 596 (12.32%) IT Strategy
13 519 (10.73%) Technology Strategy
14 518 (10.71%) Thought Leadership
15 517 (10.69%) Mentoring
16 483 (9.99%) Strategic Roadmap
17 474 (9.80%) Containerisation
18 413 (8.54%) Business Case
19 388 (8.02%) Stakeholder Management
20 365 (7.55%) Technical Architecture
Programming Languages
1 319 (6.60%) Java
2 289 (5.98%) SQL
3 241 (4.98%) Python
4 215 (4.45%) C#
5 155 (3.21%) JavaScript
6 108 (2.23%) PowerShell
7 50 (1.03%) PL/SQL
8 41 (0.85%) C++
9 38 (0.79%) C
10 30 (0.62%) TypeScript
11 26 (0.54%) Perl
12 24 (0.50%) Bash
13 17 (0.35%) Kotlin
14 16 (0.33%) Bicep
15 15 (0.31%) PHP
16 13 (0.27%) Go
17 11 (0.23%) T-SQL
18 9 (0.19%) VB
19 8 (0.17%) BrightScript
19 8 (0.17%) Kusto Query Language
Qualifications
1 976 (20.18%) Security Cleared
2 625 (12.92%) SC Cleared
3 478 (9.88%) Degree
4 273 (5.65%) TOGAF Certification
5 184 (3.80%) Computer Science Degree
6 148 (3.06%) Azure Certification
7 114 (2.36%) AWS Certification
8 110 (2.27%) DV Cleared
9 81 (1.67%) CISSP
10 77 (1.59%) Master's Degree
11 65 (1.34%) Microsoft Certification
12 63 (1.30%) Cisco Certification
13 50 (1.03%) AWS Certified Solutions Architect
14 41 (0.85%) CCNP
15 40 (0.83%) CISM
16 36 (0.74%) BPSS Clearance
17 27 (0.56%) ISSAP
18 25 (0.52%) MCSE
19 23 (0.48%) CCIE
20 22 (0.45%) CCNA
Quality Assurance & Compliance
1 85 (1.76%) QA
2 75 (1.55%) Data Quality
3 57 (1.18%) ISO/IEC 27001
4 39 (0.81%) NIST
5 28 (0.58%) SEPA
6 27 (0.56%) GDPR
7 26 (0.54%) GRC
8 24 (0.50%) NCSC
9 19 (0.39%) Cyber Essentials
10 15 (0.31%) Accessibility
10 15 (0.31%) ISO 20022
11 13 (0.27%) PMO
12 12 (0.25%) Cyber Essentials PLUS
12 12 (0.25%) PCI DSS
13 10 (0.21%) HL7
14 8 (0.17%) COBIT
14 8 (0.17%) NIST 800
14 8 (0.17%) SOC 2
15 6 (0.12%) DICOM
15 6 (0.12%) ISO 9000
System Software
1 214 (4.43%) Virtual Machines
2 170 (3.52%) Docker
3 114 (2.36%) Active Directory
4 95 (1.96%) VMware Infrastructure
5 40 (0.83%) vSphere
6 36 (0.74%) Virtual Desktop
7 33 (0.68%) VMware ESXi
8 20 (0.41%) Hyper-V
9 15 (0.31%) Firmware
10 14 (0.29%) vCloud
11 13 (0.27%) Embedded Firmware
12 11 (0.23%) VMware NSX
13 3 (0.062%) Forefront TMG
13 3 (0.062%) ISA Server
13 3 (0.062%) KVM
14 2 (0.041%) Squid
15 1 (0.021%) Apache ZooKeeper
15 1 (0.021%) OpenAM
15 1 (0.021%) Oracle RAC
15 1 (0.021%) VirtualBox
Systems Management
1 282 (5.83%) Terraform
2 226 (4.67%) Kubernetes
3 148 (3.06%) Ansible
4 33 (0.68%) FortiGate
5 21 (0.43%) Puppet
6 18 (0.37%) SCCM
7 16 (0.33%) Grafana
8 15 (0.31%) Microsoft Intune
9 14 (0.29%) Prometheus
10 13 (0.27%) Kibana
11 9 (0.19%) Single Sign-On
11 9 (0.19%) SolarWinds Orion
12 8 (0.17%) Active Directory Federation Services
13 7 (0.14%) Progress Chef
14 6 (0.12%) Cisco CUCM
14 6 (0.12%) Nagios
14 6 (0.12%) vCenter Server
14 6 (0.12%) WebSphere Cast Iron
15 5 (0.10%) Argo
15 5 (0.10%) SysTrack
Vendors
1 941 (19.46%) Microsoft
2 214 (4.43%) Oracle
3 193 (3.99%) SAP
4 145 (3.00%) Cisco
5 144 (2.98%) Google
6 114 (2.36%) VMware
7 112 (2.32%) Salesforce
8 91 (1.88%) Citrix
9 90 (1.86%) Databricks
10 83 (1.72%) ServiceNow
11 54 (1.12%) HP
12 51 (1.05%) MuleSoft
13 47 (0.97%) Informatica
14 45 (0.93%) Palo Alto
15 39 (0.81%) Meraki
16 36 (0.74%) Juniper
17 33 (0.68%) F5
18 32 (0.66%) Fortinet
19 29 (0.60%) Aruba
19 29 (0.60%) IBM