Translating Business Requirements Jobs

Translate Business Requirements
UK

The table below provides summary statistics for permanent job vacancies requiring Translating Business Requirements skills. It includes a benchmarking guide to the annual salaries offered in vacancies that cited Translating Business Requirements over the 6 months leading up to 8 December 2024, comparing them to the same period in the previous two years.

6 months to
8 Dec 2024
Same period 2023 Same period 2022
Rank 331 381 429
Rank change year-on-year +50 +48 -21
Permanent jobs citing Translating Business Requirements 569 398 904
As % of all permanent jobs advertised in the UK 0.82% 0.75% 0.74%
As % of the Processes & Methodologies category 0.93% 0.80% 0.77%
Number of salaries quoted 328 323 575
10th Percentile £42,750 £42,500 £40,834
25th Percentile £51,250 £53,750 £47,500
Median annual salary (50th Percentile) £65,000 £70,000 £60,000
Median % change year-on-year -7.14% +16.67% -4.00%
75th Percentile £82,500 £85,000 £81,250
90th Percentile £97,500 £95,000 £97,290
UK excluding London median annual salary £55,000 £67,500 £57,500
% change year-on-year -18.52% +17.39% +4.55%

All Process and Methodology Skills
UK

Translating Business Requirements falls under the Processes and Methodologies category. For comparison with the information above, the following table provides summary statistics for all permanent job vacancies requiring process or methodology skills.

Permanent vacancies with a requirement for process or methodology skills 61,487 49,863 117,613
As % of all permanent jobs advertised in the UK 88.65% 94.11% 95.75%
Number of salaries quoted 28,400 36,022 72,003
10th Percentile £35,000 £32,500 £34,700
25th Percentile £45,000 £43,750 £45,000
Median annual salary (50th Percentile) £60,000 £60,000 £61,000
Median % change year-on-year - -1.64% +1.67%
75th Percentile £78,750 £80,000 £82,500
90th Percentile £97,500 £99,680 £100,000
UK excluding London median annual salary £54,714 £52,500 £53,500
% change year-on-year +4.22% -1.87% +7.00%

Translating Business Requirements
Job Vacancy Trend

Job postings citing Translating Business Requirements as a proportion of all IT jobs advertised.
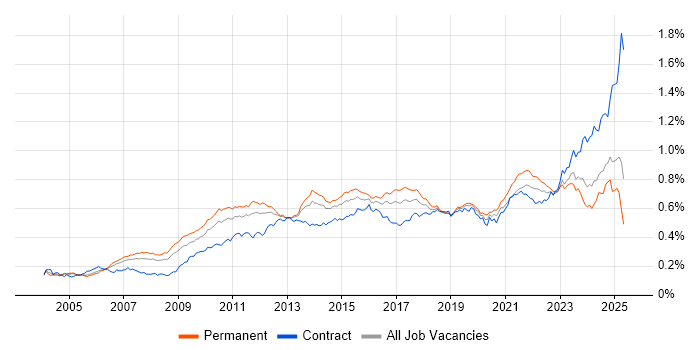
Job vacancy trend for Translating Business Requirements in the UK

Translating Business Requirements
Salary Trend

3-month moving average salary quoted in jobs citing Translating Business Requirements.

Salary trend for Translating Business Requirements in the UK

Translating Business Requirements
Salary Histogram

Salary distribution for jobs citing Translating Business Requirements over the 6 months to 8 December 2024.

Salary histogram for Translating Business Requirements in the UK

Translating Business Requirements
Top 16 Job Locations

The table below looks at the demand and provides a guide to the median salaries quoted in IT jobs citing Translating Business Requirements within the UK over the 6 months to 8 December 2024. The 'Rank Change' column provides an indication of the change in demand within each location based on the same 6 month period last year.

Location Rank Change
on Same Period
Last Year
Matching
Permanent
IT Job Ads
Median Salary
Past 6 Months
Median Salary
% Change
on Same Period
Last Year
Live
Jobs
England +56 511 £65,000 -6.40% 213
UK excluding London -10 287 £55,000 -18.52% 100
London +73 243 £75,000 -3.23% 109
Work from Home +40 236 £70,000 - 145
North of England +16 105 £52,500 -25.00% 27
North West -9 65 £52,500 -25.00% 14
South East -21 56 £65,000 +8.33% 22
Midlands -55 55 £60,000 -7.69% 24
West Midlands -46 42 £56,250 -13.46% 13
Scotland -16 29 £75,780 +1.04% 7
Yorkshire +19 25 £70,000 -14.41% 7
East of England -48 25 £72,500 -3.33% 10
South West +6 17 £41,000 -48.75% 6
North East - 16 £53,750 - 6
East Midlands -32 13 £67,500 +22.73% 11
Wales +25 3 £55,000 -8.24% 2

Translating Business Requirements
Co-occurring Skills and Capabilities by Category

The follow tables expand on the table above by listing co-occurrences grouped by category. The same employment type, locality and period is covered with up to 20 co-occurrences shown in each of the following categories:

Application Platforms
1 44 (7.73%) Confluence
2 13 (2.28%) SharePoint
3 9 (1.58%) Apache Airflow
4 7 (1.23%) Microsoft Exchange
5 5 (0.88%) Apache Spark
5 5 (0.88%) IIS
6 4 (0.70%) Adobe Experience Manager
6 4 (0.70%) Apache
7 3 (0.53%) OpenEdge
8 2 (0.35%) CMS
8 2 (0.35%) Luigi
9 1 (0.18%) Oracle SOA Suite
9 1 (0.18%) WildFly
Applications
1 17 (2.99%) Microsoft Excel
2 7 (1.23%) Microsoft Office
2 7 (1.23%) Microsoft PowerPoint
3 4 (0.70%) Trello
4 3 (0.53%) Chatbot
5 2 (0.35%) Microsoft Project
5 2 (0.35%) MS Visio
Business Applications
1 19 (3.34%) SAP S/4HANA
2 14 (2.46%) Dynamics CRM
3 12 (2.11%) Oracle Assets
3 12 (2.11%) Oracle Cash Management
3 12 (2.11%) Oracle General Ledger
3 12 (2.11%) Oracle Payables
3 12 (2.11%) Oracle Receivables
4 8 (1.41%) IBM Planning Analytics
5 7 (1.23%) Odoo
6 6 (1.05%) SAP SD
7 5 (0.88%) Dynamics AX
8 4 (0.70%) Oracle EBS
8 4 (0.70%) Oracle ERP
9 3 (0.53%) Salesforce CRM
9 3 (0.53%) SAP HR
9 3 (0.53%) SAP QM
10 2 (0.35%) Dynamics GP
10 2 (0.35%) SAP Payroll
10 2 (0.35%) SAP PM
10 2 (0.35%) Sprinklr
Cloud Services
1 147 (25.83%) Azure
2 125 (21.97%) Power Platform
3 82 (14.41%) AWS
4 47 (8.26%) Dynamics 365
5 44 (7.73%) GCP
6 41 (7.21%) PowerApps
7 37 (6.50%) Power Automate
8 23 (4.04%) Azure Data Factory
9 20 (3.51%) SaaS
10 18 (3.16%) Azure Synapse Analytics
11 16 (2.81%) Azure DevOps
11 16 (2.81%) Snowflake
12 13 (2.28%) GitHub
12 13 (2.28%) SuccessFactors
13 12 (2.11%) Cloud Computing
13 12 (2.11%) Copilot Studio
14 10 (1.76%) Microsoft 365
14 10 (1.76%) WhatsApp
15 8 (1.41%) dbt
15 8 (1.41%) Serverless
Communications & Networking
1 34 (5.98%) Broadband
1 34 (5.98%) Wireshark
2 9 (1.58%) SMS
3 8 (1.41%) Firewall
4 7 (1.23%) LAN
4 7 (1.23%) WAN
5 6 (1.05%) Internet
6 5 (0.88%) Network Security
7 4 (0.70%) Intrusion Detection
7 4 (0.70%) SD-WAN
7 4 (0.70%) VPN
7 4 (0.70%) Wi-Fi
8 3 (0.53%) WebEx
9 2 (0.35%) VoIP
10 1 (0.18%) 802.11
10 1 (0.18%) HTTP
10 1 (0.18%) SAN
10 1 (0.18%) Unified Communications
10 1 (0.18%) VLAN
10 1 (0.18%) Wireless
Database & Business Intelligence
1 83 (14.59%) Power BI
2 46 (8.08%) Tableau
3 36 (6.33%) Data Warehouse
4 23 (4.04%) SQL Server
5 20 (3.51%) Big Data
6 17 (2.99%) Data Lake
6 17 (2.99%) Relational Database
7 16 (2.81%) MySQL
8 15 (2.64%) NoSQL
9 12 (2.11%) BigQuery
9 12 (2.11%) SQL Server Integration Services
10 10 (1.76%) Data Mining
11 9 (1.58%) PostgreSQL
12 8 (1.41%) GIS
13 7 (1.23%) BusinessObjects
13 7 (1.23%) Looker
13 7 (1.23%) MongoDB
14 6 (1.05%) Snowflake Schema
15 5 (0.88%) Amazon Redshift
15 5 (0.88%) SQL Server Analysis Services
Development Applications
1 34 (5.98%) Fiddler
1 34 (5.98%) Git
2 29 (5.10%) JIRA
3 11 (1.93%) webpack
4 8 (1.41%) Bitbucket
4 8 (1.41%) Jenkins
5 4 (0.70%) Babel
5 4 (0.70%) Terragrunt
6 3 (0.53%) GitLab
6 3 (0.53%) Maven
6 3 (0.53%) MLflow
6 3 (0.53%) Mocha
6 3 (0.53%) Oracle APEX
6 3 (0.53%) Sonatype Nexus
7 2 (0.35%) fastlane
7 2 (0.35%) JUnit
7 2 (0.35%) SonarQube
8 1 (0.18%) CircleCI
8 1 (0.18%) Eclipse
8 1 (0.18%) Spinnaker
General
1 294 (51.67%) Social Skills
2 207 (36.38%) Analytical Skills
3 118 (20.74%) Finance
4 68 (11.95%) Marketing
5 55 (9.67%) Law
6 43 (7.56%) Banking
7 42 (7.38%) Inclusion and Diversity
8 35 (6.15%) Advertising
9 29 (5.10%) Presentation Skills
10 28 (4.92%) Manufacturing
11 26 (4.57%) Public Sector
12 23 (4.04%) Retail
13 17 (2.99%) Pharmaceutical
14 10 (1.76%) Organisational Skills
15 8 (1.41%) Billing
15 8 (1.41%) Legal
16 6 (1.05%) Documentation Skills
16 6 (1.05%) Influencing Skills
17 4 (0.70%) Automotive
17 4 (0.70%) Investment Banking
Job Titles
1 112 (19.68%) Senior
2 106 (18.63%) Analyst
3 104 (18.28%) Architect
4 89 (15.64%) Developer
5 59 (10.37%) Business Analyst
6 47 (8.26%) Consultant
7 45 (7.91%) Solutions Architect
8 39 (6.85%) Lead
9 34 (5.98%) Service Delivery Executive
10 25 (4.39%) Data Engineer
11 24 (4.22%) Senior Analyst
11 24 (4.22%) Senior Developer
11 24 (4.22%) Technical Analyst
12 23 (4.04%) Technical Business Analyst
13 21 (3.69%) Data Analyst
13 21 (3.69%) Data Architect
14 19 (3.34%) Project Analyst
14 19 (3.34%) Software Engineer
15 18 (3.16%) Development Analyst
15 18 (3.16%) Software Development Analyst
Libraries, Frameworks & Software Standards
1 79 (13.88%) HTML
2 70 (12.30%) CSS
3 39 (6.85%) .NET
3 39 (6.85%) React
3 39 (6.85%) XML
4 35 (6.15%) CSS3
5 18 (3.16%) REST
6 17 (2.99%) Oracle Fusion
6 17 (2.99%) Web Services
7 14 (2.46%) Redux
8 13 (2.28%) Spring Boot
8 13 (2.28%) Vue
9 12 (2.11%) AngularJS
9 12 (2.11%) Node.js
9 12 (2.11%) RESTful
10 11 (1.93%) Spring
11 10 (1.76%) ASP.NET
11 10 (1.76%) Middleware
11 10 (1.76%) RabbitMQ
12 9 (1.58%) JSON
Miscellaneous
1 39 (6.85%) Product Ownership
2 37 (6.50%) Mobile App
3 34 (5.98%) Social Media
4 24 (4.22%) Management Information System
5 21 (3.69%) Legacy Systems
6 12 (2.11%) Analytical Mindset
6 12 (2.11%) FMCG
7 11 (1.93%) Data Centre
8 10 (1.76%) Self-Motivation
9 9 (1.58%) Cloud Native
10 8 (1.41%) Onboarding
10 8 (1.41%) Public Cloud
10 8 (1.41%) Reinsurance
11 7 (1.23%) Biopharmaceutical
11 7 (1.23%) Life Science
12 5 (0.88%) Enterprise Software
13 4 (0.70%) Distributed Systems
13 4 (0.70%) Hackathon
13 4 (0.70%) Reference Data
13 4 (0.70%) Smart Energy
Operating Systems
1 16 (2.81%) Linux
2 2 (0.35%) Android
2 2 (0.35%) Unix
2 2 (0.35%) Windows
3 1 (0.18%) Red Hat Enterprise Linux
3 1 (0.18%) Windows Server
Processes & Methodologies
1 252 (44.29%) Problem-Solving
2 162 (28.47%) Agile
3 98 (17.22%) Analytics
4 95 (16.70%) Project Management
5 78 (13.71%) Roadmaps
6 76 (13.36%) Business Intelligence
7 74 (13.01%) Data Modelling
8 69 (12.13%) Computer Science
9 65 (11.42%) Mentoring
10 64 (11.25%) Decision-Making
11 63 (11.07%) DevOps
12 61 (10.72%) Continuous Improvement
13 60 (10.54%) ETL
14 56 (9.84%) Stakeholder Management
15 55 (9.67%) CRM
16 54 (9.49%) Microservices
17 47 (8.26%) Service Delivery
17 47 (8.26%) Software Engineering
18 46 (8.08%) Data Analytics
18 46 (8.08%) ERP
Programming Languages
1 131 (23.02%) SQL
2 91 (15.99%) JavaScript
3 48 (8.44%) C#
4 47 (8.26%) Python
5 35 (6.15%) R
6 30 (5.27%) TypeScript
7 24 (4.22%) Java
8 14 (2.46%) PowerShell
9 12 (2.11%) Go
10 11 (1.93%) T-SQL
11 9 (1.58%) PHP
12 5 (0.88%) Apex Code
12 5 (0.88%) PL/SQL
13 4 (0.70%) ABAP
13 4 (0.70%) Data Analysis Expressions
14 2 (0.35%) C-shell
14 2 (0.35%) Korn
14 2 (0.35%) Kotlin
14 2 (0.35%) Ruby
14 2 (0.35%) Shell Script
Qualifications
1 124 (21.79%) Degree
2 63 (11.07%) Computer Science Degree
3 40 (7.03%) Security Cleared
4 21 (3.69%) SC Cleared
5 20 (3.51%) Microsoft Certification
6 17 (2.99%) Master's Degree
7 12 (2.11%) DBS Check
8 11 (1.93%) AWS Certification
9 9 (1.58%) ACCA
9 9 (1.58%) CBAP
10 8 (1.41%) CIMA
10 8 (1.41%) PMI Certification
10 8 (1.41%) TOGAF Certification
11 7 (1.23%) BPSS Clearance
11 7 (1.23%) PMP
12 6 (1.05%) SAP Certification
13 5 (0.88%) HND
14 4 (0.70%) Azure Certification
14 4 (0.70%) Cisco Certification
15 2 (0.35%) APMG
Quality Assurance & Compliance
1 44 (7.73%) Data Quality
2 40 (7.03%) QA
3 28 (4.92%) Accessibility
4 9 (1.58%) GDPR
5 3 (0.53%) PCI DSS
6 2 (0.35%) Cyber Essentials
6 2 (0.35%) Cyber Essentials PLUS
6 2 (0.35%) ISO/IEC 27001
7 1 (0.18%) California Consumer Privacy Act
7 1 (0.18%) HIPAA
7 1 (0.18%) NIST
7 1 (0.18%) PMO
7 1 (0.18%) Sarbanes-Oxley
System Software
1 17 (2.99%) Docker
2 8 (1.41%) Active Directory
3 3 (0.53%) VMware Infrastructure
4 2 (0.35%) Hyper-V
5 1 (0.18%) Microsoft App-V
5 1 (0.18%) vSphere
Systems Management
1 26 (4.57%) Kubernetes
2 21 (3.69%) Terraform
3 4 (0.70%) FortiGate
4 2 (0.35%) Ansible
4 2 (0.35%) Istio
5 1 (0.18%) EMC TimeFinder
Vendors
1 118 (20.74%) Microsoft
2 49 (8.61%) Google
3 48 (8.44%) SAP
4 31 (5.45%) Oracle
4 31 (5.45%) Salesforce
5 23 (4.04%) Databricks
6 13 (2.28%) UiPath
7 10 (1.76%) Cisco
7 10 (1.76%) IBM
7 10 (1.76%) MuleSoft
8 8 (1.41%) Cognos
9 5 (0.88%) Adobe
10 4 (0.70%) GoldenSource
10 4 (0.70%) MicroStrategy
10 4 (0.70%) Zoho
11 3 (0.53%) Capita
11 3 (0.53%) Informatica
11 3 (0.53%) Meraki
11 3 (0.53%) QAD
11 3 (0.53%) VMware