Baseline Personnel Security Standard (BPSS) Clearance
UK

The following table provides summary statistics for permanent job vacancies with a requirement for BPSS Clearance qualifications. Included is a benchmarking guide to the salaries offered over the 6 months to 10 December 2023 with a comparison to the same period in the previous 2 years.

6 months to
10 Dec 2023
Same period 2022 Same period 2021
Rank 346 737 790
Rank change year-on-year +391 +53 -155
Permanent jobs citing BPSS Clearance 452 349 287
As % of all permanent jobs advertised in the UK 0.86% 0.29% 0.23%
As % of the Qualifications category 2.65% 0.97% 0.92%
Number of salaries quoted 326 175 168
10th Percentile £29,993 £23,750 £21,250
25th Percentile £32,526 £30,000 £31,000
Median annual salary (50th Percentile) £57,000 £60,000 £55,000
Median % change year-on-year -5.00% +9.09% +12.82%
75th Percentile £72,500 £75,000 £71,563
90th Percentile £77,500 £84,500 £83,750
UK excluding London median annual salary £45,000 £50,000 £38,500
% change year-on-year -10.00% +29.87% -21.03%

All Academic and Professional Certifications
UK

BPSS Clearance is in the Academic Qualifications and Professional Certifications category. The following table is for comparison with the above and provides summary statistics for all permanent job vacancies with a requirement for academic qualifications or professional certifications.

Permanent vacancies requiring academic qualifications or professional certifications 17,067 35,981 31,364
As % of all permanent jobs advertised in the UK 32.65% 29.44% 24.68%
Number of salaries quoted 10,705 16,977 17,903
10th Percentile £31,000 £31,250 £31,250
25th Percentile £41,670 £41,250 £41,250
Median annual salary (50th Percentile) £57,500 £57,500 £55,000
Median % change year-on-year - +4.55% -
75th Percentile £75,000 £76,250 £73,750
90th Percentile £92,500 £93,750 £90,000
UK excluding London median annual salary £52,500 £50,000 £50,000
% change year-on-year +5.00% - +2.04%

BPSS Clearance
Job Vacancy Trend

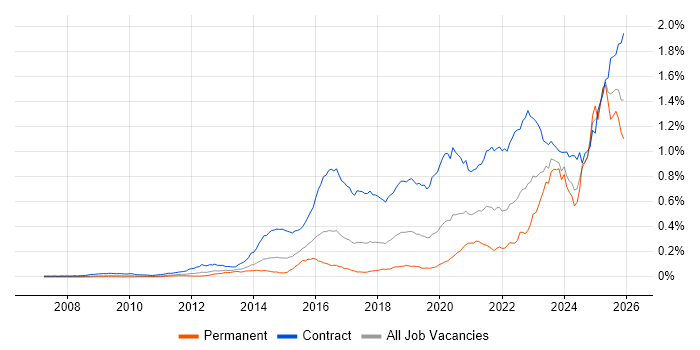
Job postings citing BPSS Clearance as a proportion of all IT jobs advertised.

Job vacancy trend for BPSS Clearance in the UK

BPSS Clearance
Salary Trend

3-month moving average salary quoted in jobs citing BPSS Clearance.

Salary trend for BPSS Clearance in the UK

BPSS Clearance
Salary Histogram

Salary distribution for jobs citing BPSS Clearance over the 6 months to 10 December 2023.

Salary histogram for BPSS Clearance in the UK

BPSS Clearance
Top 17 Job Locations

The table below looks at the demand and provides a guide to the median salaries quoted in IT jobs citing BPSS Clearance within the UK over the 6 months to 10 December 2023. The 'Rank Change' column provides an indication of the change in demand within each location based on the same 6 month period last year.

Location Rank Change
on Same Period
Last Year
Matching
Permanent
IT Job Ads
Median Salary
Past 6 Months
Median Salary
% Change
on Same Period
Last Year
Live
Jobs
England +366 329 £47,500 -10.98% 174
UK excluding London +300 259 £45,000 -10.00% 138
Work from Home +307 207 £55,000 -10.20% 98
South West +175 128 £40,750 -22.38% 41
London +250 51 £72,500 +31.82% 41
South East +155 41 £63,856 +11.41% 37
Midlands +150 28 £36,250 -19.44% 17
North of England +140 27 £58,750 +46.88% 27
Wales +35 20 £46,170 +88.45% 1
West Midlands +136 16 £32,500 -50.00% 8
North West +113 13 £62,500 +108.33% 22
East Midlands +62 12 £50,000 +104.08% 9
East of England +79 11 £26,500 +6.85% 11
North East +49 11 £60,000 - 1
Yorkshire +82 4 £57,500 - 4
Northern Ireland - 4 £29,993 - 2
Scotland +36 3 £50,000 -9.09% 7

BPSS Clearance
Co-occurring Skills and Capabilities by Category

The follow tables expand on the table above by listing co-occurrences grouped by category. The same employment type, locality and period is covered with up to 20 co-occurrences shown in each of the following categories:

Application Platforms
1 41 (9.07%) Confluence
2 22 (4.87%) SharePoint
3 1 (0.22%) OpenStack
Applications
1 15 (3.32%) Microsoft Excel
2 14 (3.10%) Microsoft PowerPoint
3 11 (2.43%) Microsoft Project
4 8 (1.77%) Microsoft Office
5 4 (0.88%) Trello
6 3 (0.66%) OrCAD
7 2 (0.44%) CATIA
8 1 (0.22%) Spreadsheet
Business Applications
1 11 (2.43%) Maximo
1 11 (2.43%) Sparx Enterprise Architect
2 10 (2.21%) SAP S/4HANA
3 5 (1.11%) SAP MM
3 5 (1.11%) SAP Payroll
3 5 (1.11%) SAP PM
4 3 (0.66%) SAP CRM
4 3 (0.66%) SAP CX
4 3 (0.66%) SAP GTS
4 3 (0.66%) SAP SD
4 3 (0.66%) SAP WM
4 3 (0.66%) Workday HCM
5 2 (0.44%) Dynamics CRM
5 2 (0.44%) SAP CO
5 2 (0.44%) SAP FI
5 2 (0.44%) SAP FI/CO
5 2 (0.44%) SAP GRC
6 1 (0.22%) SAP ERP
6 1 (0.22%) SAP PSCD
6 1 (0.22%) SAP SCM
Cloud Services
1 115 (25.44%) Azure
2 64 (14.16%) AWS
2 64 (14.16%) Azure DevOps
3 55 (12.17%) Microsoft 365
4 30 (6.64%) SuccessFactors
5 29 (6.42%) Serverless
6 26 (5.75%) Power Platform
7 23 (5.09%) GitHub
8 18 (3.98%) PaaS
9 15 (3.32%) GCP
10 14 (3.10%) IaaS
11 12 (2.65%) GitHub Actions
12 11 (2.43%) Azure Monitor
13 10 (2.21%) Azure AKS
13 10 (2.21%) OCI
14 7 (1.55%) Amazon EKS
14 7 (1.55%) PowerApps
15 6 (1.33%) AWS Lambda
16 5 (1.11%) Azure Synapse Analytics
17 4 (0.88%) Azure Cosmos DB
Communications & Networking
1 24 (5.31%) Firewall
2 19 (4.20%) VPN
3 18 (3.98%) Wireless
4 16 (3.54%) DHCP
4 16 (3.54%) DNS
5 12 (2.65%) Modbus
5 12 (2.65%) VLAN
6 11 (2.43%) LAN
7 6 (1.33%) Remote Desktop
8 4 (0.88%) HTTP
9 3 (0.66%) Wi-Fi
10 2 (0.44%) Intranet
10 2 (0.44%) Intrusion Detection
10 2 (0.44%) Network Security
10 2 (0.44%) OpenFlow
10 2 (0.44%) Software-Defined Networking
10 2 (0.44%) TCP/IP
10 2 (0.44%) Wireshark
11 1 (0.22%) Radio Access Network
11 1 (0.22%) SAN
Database & Business Intelligence
1 21 (4.65%) SQL Server
2 19 (4.20%) NoSQL
3 13 (2.88%) Data Warehouse
4 12 (2.65%) Relational Database
5 11 (2.43%) GIS
6 8 (1.77%) MongoDB
7 7 (1.55%) MySQL
7 7 (1.55%) Oracle Reports
7 7 (1.55%) Power BI
8 6 (1.33%) PostgreSQL
9 5 (1.11%) Big Data
10 4 (0.88%) Amazon RDS
10 4 (0.88%) BusinessObjects XI
10 4 (0.88%) Neo4j
10 4 (0.88%) Oracle BI Publisher
10 4 (0.88%) PowerCenter
10 4 (0.88%) SQL Server Reporting Services
11 3 (0.66%) SAP BW
11 3 (0.66%) SQL Server Integration Services
12 2 (0.44%) Snowflake Schema
Development Applications
1 61 (13.50%) Git
2 52 (11.50%) JIRA
3 32 (7.08%) Jenkins
4 31 (6.86%) Visual Studio
5 29 (6.42%) Bitbucket
5 29 (6.42%) GitLab
6 11 (2.43%) Maven
6 11 (2.43%) Octopus Deploy
6 11 (2.43%) Team Foundation Server
6 11 (2.43%) TeamCity
7 7 (1.55%) Selenium
8 6 (1.33%) CircleCI
8 6 (1.33%) Cucumber
8 6 (1.33%) git-flow
8 6 (1.33%) JUnit
8 6 (1.33%) SonarQube
9 5 (1.11%) Sonatype Nexus
10 4 (0.88%) Artifactory
10 4 (0.88%) Oracle Forms
10 4 (0.88%) Postman
General
1 173 (38.27%) Social Skills
2 143 (31.64%) Public Sector
3 116 (25.66%) Inclusion and Diversity
4 68 (15.04%) Finance
5 65 (14.38%) Presentation Skills
6 31 (6.86%) Games
7 28 (6.19%) Manufacturing
8 21 (4.65%) Analytical Skills
9 20 (4.42%) Aviation
10 17 (3.76%) Aerospace
11 16 (3.54%) Influencing Skills
12 13 (2.88%) Marketing
13 12 (2.65%) Retail
14 11 (2.43%) Electronics
14 11 (2.43%) Local Government
15 8 (1.77%) Back Office
15 8 (1.77%) Telecoms
16 6 (1.33%) French Language
17 5 (1.11%) Avionics
18 4 (0.88%) Billing
Job Titles
1 75 (16.59%) Developer
2 73 (16.15%) Consultant
3 62 (13.72%) Senior
4 38 (8.41%) Lead
5 36 (7.96%) Architect
5 36 (7.96%) Support Engineer
6 34 (7.52%) DevOps Engineer
7 31 (6.86%) Project Manager
8 30 (6.64%) IT Engineer
9 29 (6.42%) 3D Developer
9 29 (6.42%) Games Developer
9 29 (6.42%) Unity 3D Developer
10 28 (6.19%) Analyst
11 26 (5.75%) IT Support
11 26 (5.75%) IT Support Engineer
12 24 (5.31%) Senior Consultant
13 22 (4.87%) Security Consultant
14 21 (4.65%) Cybersecurity Consultant
15 20 (4.42%) Solutions Architect
16 17 (3.76%) Software Engineer
Libraries, Frameworks & Software Standards
1 46 (10.18%) .NET
2 29 (6.42%) Unity (Game Engine)
3 25 (5.53%) Node.js
4 21 (4.65%) EDI
4 21 (4.65%) HTML
5 20 (4.42%) REST
6 18 (3.98%) CSS
7 17 (3.76%) Spring Boot
8 16 (3.54%) Spring
9 15 (3.32%) AngularJS
9 15 (3.32%) Velocity
10 11 (2.43%) React
11 10 (2.21%) HTML5
12 8 (1.77%) CSS3
12 8 (1.77%) Elastic Stack
13 7 (1.55%) .NET Core
13 7 (1.55%) Jest
13 7 (1.55%) RESTful
13 7 (1.55%) Web Services
13 7 (1.55%) YAML
Miscellaneous
1 87 (19.25%) Onboarding
2 44 (9.73%) Driving Licence
3 29 (6.42%) Virtual Reality
4 25 (5.53%) Management Information System
5 20 (4.42%) Cyberattack
6 18 (3.98%) Data Centre
7 13 (2.88%) Product Ownership
7 13 (2.88%) Self-Motivation
8 12 (2.65%) CAN bus
8 12 (2.65%) Mobile App
8 12 (2.65%) Operational Technology
8 12 (2.65%) SCADA
9 11 (2.43%) Blog
10 10 (2.21%) Virtual Team
11 9 (1.99%) Grid Computing
12 8 (1.77%) Embedded Systems
12 8 (1.77%) iPhone
12 8 (1.77%) Low-Code
13 7 (1.55%) Algorithms
13 7 (1.55%) Legacy Code
Operating Systems
1 40 (8.85%) Windows
2 21 (4.65%) Windows Server
3 14 (3.10%) Linux
4 13 (2.88%) Windows Server 2016
4 13 (2.88%) Windows Server 2019
5 11 (2.43%) VMS
6 10 (2.21%) Windows Server 2012
7 6 (1.33%) Unix
7 6 (1.33%) Windows 7
8 4 (0.88%) Windows 2000
8 4 (0.88%) Windows Server 2003
9 3 (0.66%) Android
9 3 (0.66%) Windows 10
10 2 (0.44%) Red Hat Enterprise Linux
11 1 (0.22%) CentOS
11 1 (0.22%) Mac OS
11 1 (0.22%) Ubuntu
Processes & Methodologies
1 138 (30.53%) Agile
2 96 (21.24%) Software Engineering
3 85 (18.81%) DevOps
4 79 (17.48%) Problem-Solving
5 73 (16.15%) Scrum
6 66 (14.60%) Roadmaps
7 64 (14.16%) Customer Service
8 59 (13.05%) CI/CD
8 59 (13.05%) Coaching
9 58 (12.83%) Project Management
10 55 (12.17%) People Management
11 53 (11.73%) Project Delivery
11 53 (11.73%) Stakeholder Management
12 50 (11.06%) ITIL
13 47 (10.40%) Business Development
14 46 (10.18%) Digital Engineering
15 44 (9.73%) Mentoring
16 42 (9.29%) UML
17 40 (8.85%) Cybersecurity
18 39 (8.63%) Continuous Integration
Programming Languages
1 58 (12.83%) C#
2 52 (11.50%) JavaScript
3 50 (11.06%) Java
4 37 (8.19%) Python
5 31 (6.86%) SQL
6 29 (6.42%) PowerShell
7 19 (4.20%) Bash
8 17 (3.76%) Go
9 16 (3.54%) TypeScript
10 14 (3.10%) Ruby
11 9 (1.99%) C
12 8 (1.77%) Bicep
12 8 (1.77%) PHP
12 8 (1.77%) Shell Script
13 7 (1.55%) T-SQL
14 5 (1.11%) C++
14 5 (1.11%) R
15 4 (0.88%) Assembly Language
15 4 (0.88%) Cypher
16 3 (0.66%) Julia
Qualifications
1 258 (57.08%) Security Cleared
2 161 (35.62%) SC Cleared
3 100 (22.12%) Degree
4 67 (14.82%) DBS Check
5 20 (4.42%) CISSP
5 20 (4.42%) DV Cleared
6 14 (3.10%) AWS Certification
7 13 (2.88%) Azure Certification
8 11 (2.43%) CISM
8 11 (2.43%) OSCP
8 11 (2.43%) TOGAF Certification
9 9 (1.99%) CESG Certified Professional
9 9 (1.99%) CISA
9 9 (1.99%) Computer Science Degree
9 9 (1.99%) CRISC
9 9 (1.99%) Master's Degree
10 7 (1.55%) Microsoft Certification
11 6 (1.33%) CCNA
11 6 (1.33%) Cisco Certification
11 6 (1.33%) PhD
Quality Assurance & Compliance
1 38 (8.41%) QA
2 33 (7.30%) ISO/IEC 15288
3 23 (5.09%) NIST
4 21 (4.65%) Accessibility
4 21 (4.65%) NIST 800
5 11 (2.43%) GRC
6 9 (1.99%) NCSC
7 6 (1.33%) COBIT
7 6 (1.33%) Disclosure Scotland
7 6 (1.33%) IEC 61508
7 6 (1.33%) ISO/IEC 20000
8 4 (0.88%) ARP4754
8 4 (0.88%) ARP4761
9 3 (0.66%) PMO
10 2 (0.44%) Data Quality
10 2 (0.44%) ISO/IEC 27001
10 2 (0.44%) P3O
10 2 (0.44%) PCI DSS
10 2 (0.44%) SLA
11 1 (0.22%) DO-178B
System Software
1 53 (11.73%) Active Directory
2 34 (7.52%) Docker
3 17 (3.76%) Hyper-V
4 11 (2.43%) Virtual Machines
5 5 (1.11%) VMware Infrastructure
5 5 (1.11%) vSphere
6 4 (0.88%) Firmware
6 4 (0.88%) Oracle RAC
6 4 (0.88%) VMware ESXi
7 2 (0.44%) KVM
Systems Management
1 32 (7.08%) Kubernetes
2 31 (6.86%) Terraform
3 19 (4.20%) Ansible
4 13 (2.88%) Microsoft Intune
5 6 (1.33%) McAfee ePO
6 4 (0.88%) Microsoft Clustering
6 4 (0.88%) Prometheus
6 4 (0.88%) Puppet
6 4 (0.88%) vCenter Server
7 3 (0.66%) Progress Chef
8 2 (0.44%) Istio
8 2 (0.44%) Packer
9 1 (0.22%) Grafana
9 1 (0.22%) Rancher
Vendors
1 118 (26.11%) Microsoft
2 55 (12.17%) SAP
3 23 (5.09%) VMware
4 21 (4.65%) ServiceNow
5 20 (4.42%) Qualtrics
6 18 (3.98%) Sun
7 15 (3.32%) Oracle
8 12 (2.65%) McAfee
9 11 (2.43%) IBM
9 11 (2.43%) Sparx
10 10 (2.21%) Cisco
11 9 (1.99%) Google
12 6 (1.33%) Meraki
12 6 (1.33%) Salesforce
13 4 (0.88%) Apple
13 4 (0.88%) Citrix
13 4 (0.88%) HP
13 4 (0.88%) Informatica
13 4 (0.88%) Symantec
13 4 (0.88%) Veritas