Solution Architect
UK

The median Solution Architect salary in the UK is £85,000 per year according to job vacancies posted during the 6 months to 7 December 2023.

The first table below provides salary benchmarking and summary statistics including a comparison to same period in the previous 2 years.

6 months to
7 Dec 2023
Same period 2022 Same period 2021
Rank 75 157 180
Rank change year-on-year +82 +23 -5
Permanent jobs requiring a Solutions Architect 2,089 2,879 2,753
As % of all permanent jobs advertised in the UK 3.94% 2.34% 2.15%
As % of the Job Titles category 4.13% 2.46% 2.26%
Number of salaries quoted 938 1,879 1,867
10th Percentile £63,631 £61,250 £61,250
25th Percentile £68,718 £71,500 £70,000
Median annual salary (50th Percentile) £85,000 £85,000 £82,500
Median % change year-on-year - +3.03% +10.00%
75th Percentile £95,000 £97,500 £96,250
90th Percentile £110,000 £110,000 £109,080
UK excluding London median annual salary £75,000 £80,000 £75,000
% change year-on-year -6.25% +6.67% +7.14%

All Permanent IT Job Vacancies
UK

The following table is for comparison with the above and includes summary statistics for all permanent IT job vacancies. Most job vacancies include a discernible job title that can be normalized. As such, the figures in the second row provide an indication of the number of permanent jobs in our overall sample.

Permanent vacancies in the UK with a recognized job title 50,561 117,203 121,950
% of permanent jobs with a recognized job title 95.43% 95.41% 95.16%
Number of salaries quoted 36,942 73,752 84,378
10th Percentile £31,250 £32,798 £32,125
25th Percentile £42,500 £45,000 £42,500
Median annual salary (50th Percentile) £60,000 £60,000 £57,500
Median % change year-on-year - +4.35% +4.55%
75th Percentile £80,000 £81,250 £77,500
90th Percentile £97,500 £98,750 £95,000
UK excluding London median annual salary £52,500 £52,500 £50,000
% change year-on-year - +5.00% +5.26%

Solutions Architect
Job Vacancy Trend

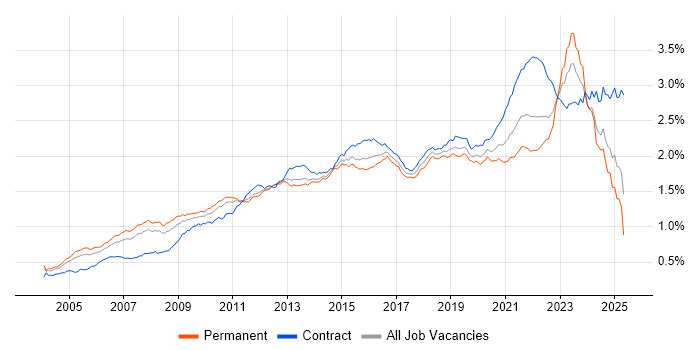
Job postings that featured Solutions Architect in the job title as a proportion of all IT jobs advertised.

Job vacancy trend for Solutions Architect in the UK

Solutions Architect
Salary Trend

3-month moving average salary quoted in jobs citing Solutions Architect.

Salary trend for Solutions Architect in the UK

Solutions Architect
Salary Histogram

Salary distribution for jobs citing Solutions Architect over the 6 months to 7 December 2023.

Salary histogram for Solutions Architect in the UK

Solutions Architect
Top 17 Job Locations

The table below looks at the demand and provides a guide to the median salaries quoted in IT jobs citing Solutions Architect within the UK over the 6 months to 7 December 2023. The 'Rank Change' column provides an indication of the change in demand within each location based on the same 6 month period last year.

Location Rank Change
on Same Period
Last Year
Matching
Permanent
IT Job Ads
Median Salary
Past 6 Months
Median Salary
% Change
on Same Period
Last Year
Live
Jobs
England +85 1,610 £85,000 - 461
UK excluding London +112 1,299 £75,000 -6.25% 272
Work from Home +91 1,100 £80,500 -5.29% 245
London +56 590 £90,000 - 217
North of England +105 401 £75,000 -3.23% 72
South West +116 221 £70,576 -1.64% 25
North West +131 216 £80,000 +6.67% 38
South East +63 193 £82,500 +1.85% 101
Scotland +45 190 £70,576 -0.95% 14
Yorkshire +76 174 £73,750 -4.84% 30
Midlands +27 133 £85,000 +11.93% 47
East Midlands +86 89 £85,000 +6.25% 17
Northern Ireland +92 70 £85,000 -19.05% 4
Wales +61 66 £80,000 +33.33% 4
West Midlands -25 42 £80,000 +6.67% 28
East of England +44 31 £53,500 -38.86% 11
North East +40 13 £78,750 +5.00% 4

Solutions Architect Skill Set
Top 30 Co-occurring Skills and Capabilities

For the 6 months to 7 December 2023, Solutions Architect job roles required the following skills and capabilities in order of popularity. The figures indicate the absolute number co-occurrences and as a proportion of all permanent job ads featuring Solutions Architect in the job title.

1 1,032 (49.40%) Agile
2 739 (35.38%) Azure
3 703 (33.65%) Actionable Insight
4 638 (30.54%) Social Skills
5 602 (28.82%) Finance
6 577 (27.62%) TOGAF
7 491 (23.50%) Enterprise Architecture
8 445 (21.30%) DevOps
9 444 (21.25%) Presales
10 416 (19.91%) Security Cleared
10 416 (19.91%) AWS
11 407 (19.48%) IT Strategy
12 401 (19.20%) Microsoft
13 388 (18.57%) Problem-Solving
14 367 (17.57%) Microservices
15 363 (17.38%) SC Cleared
16 357 (17.09%) Analytics
17 356 (17.04%) Business Case
18 338 (16.18%) Thought Leadership
19 318 (15.22%) Technology Strategy
20 312 (14.94%) Roadmaps
21 269 (12.88%) Data Analytics
22 259 (12.40%) Mentoring
22 259 (12.40%) Software Engineering
23 258 (12.35%) Degree
24 257 (12.30%) Digital Transformation Programme
25 251 (12.02%) Contract Negotiation
26 243 (11.63%) Commercial Awareness
27 234 (11.20%) GCP
28 233 (11.15%) Customer Engagement

Solutions Architect Skill Set
Co-occurring Skills and Capabilities by Category

The follow tables expand on the table above by listing co-occurrences grouped by category. The same employment type, locality and period is covered with up to 20 co-occurrences shown in each of the following categories:

Application Platforms
1 24 (1.15%) SharePoint
2 13 (0.62%) CMS
3 12 (0.57%) Anypoint
3 12 (0.57%) Tomcat
4 11 (0.53%) Jetty
5 8 (0.38%) Kentico
6 6 (0.29%) Confluence
7 5 (0.24%) IIS
8 4 (0.19%) Apache
8 4 (0.19%) Apache Spark
9 2 (0.096%) MS Exchange
10 1 (0.048%) ArcGIS
10 1 (0.048%) Cloud Foundry
10 1 (0.048%) Drupal
10 1 (0.048%) EPiServer
10 1 (0.048%) Ethereum
10 1 (0.048%) OpenEdge
10 1 (0.048%) Oracle SOA Suite
10 1 (0.048%) Sitecore CMS
10 1 (0.048%) Umbraco
Applications
1 4 (0.19%) MS Visio
2 3 (0.14%) Microsoft Office
3 1 (0.048%) Microsoft Excel
3 1 (0.048%) Microsoft PowerPoint
Business Applications
1 75 (3.59%) SAP S/4HANA
2 19 (0.91%) Sparx Enterprise Architect
3 18 (0.86%) SAP ERP
4 17 (0.81%) Elite 3E
4 17 (0.81%) Remedy ITSM
5 14 (0.67%) SAP CO
6 13 (0.62%) Dynamics CRM
7 10 (0.48%) SAP FI
8 9 (0.43%) SAP FI/CO
9 7 (0.34%) SAP MM
9 7 (0.34%) SAP SCM
10 6 (0.29%) SAP EWM
10 6 (0.29%) SAP PP
10 6 (0.29%) SAP SD
11 5 (0.24%) SAP QM
12 4 (0.19%) Cerner Millennium
12 4 (0.19%) SAP PM
13 3 (0.14%) Dynamics NAV
13 3 (0.14%) SAP HR
13 3 (0.14%) SAP WM
Cloud Services
1 739 (35.38%) Azure
2 416 (19.91%) AWS
3 234 (11.20%) GCP
4 226 (10.82%) Power Platform
5 200 (9.57%) Azure DevOps
6 175 (8.38%) Dynamics 365
7 126 (6.03%) SaaS
8 112 (5.36%) PaaS
9 81 (3.88%) IaaS
10 75 (3.59%) Microsoft 365
11 60 (2.87%) Serverless
12 37 (1.77%) OpenShift
13 34 (1.63%) Azure Data Factory
14 28 (1.34%) Azure Synapse Analytics
15 27 (1.29%) Cloud Computing
16 23 (1.10%) AWS CloudFormation
16 23 (1.10%) Azure Cosmos DB
17 20 (0.96%) SuccessFactors
18 16 (0.77%) GitHub
19 13 (0.62%) Azure Logic Apps
Communications & Networking
1 30 (1.44%) DNS
2 22 (1.05%) TCP/IP
3 19 (0.91%) DHCP
4 17 (0.81%) Internet
5 16 (0.77%) VPN
6 14 (0.67%) VLAN
7 13 (0.62%) Firewall
8 12 (0.57%) OSPF
9 10 (0.48%) HTTP
10 9 (0.43%) Network Security
11 8 (0.38%) IPv4
12 6 (0.29%) BGP
13 5 (0.24%) LAN
13 5 (0.24%) WAN
14 4 (0.19%) Wireless
15 3 (0.14%) Broadband
15 3 (0.14%) DMZ
15 3 (0.14%) DSL
15 3 (0.14%) SD-WAN
15 3 (0.14%) SSL
Database & Business Intelligence
1 103 (4.93%) Data Warehouse
2 86 (4.12%) SQL Server
3 56 (2.68%) Big Data
4 45 (2.15%) Power BI
5 40 (1.91%) NoSQL
6 39 (1.87%) MySQL
7 36 (1.72%) Azure SQL Database
8 35 (1.68%) Data Lake
9 28 (1.34%) Relational Database
10 22 (1.05%) DynamoDB
11 21 (1.01%) Amazon RDS
12 15 (0.72%) Amazon QuickSight
12 15 (0.72%) BusinessObjects
13 14 (0.67%) Hadoop
13 14 (0.67%) PostgreSQL
14 12 (0.57%) Amazon Redshift
15 11 (0.53%) Amazon Athena
16 10 (0.48%) Redis
17 7 (0.34%) MongoDB
17 7 (0.34%) Tableau
Development Applications
1 18 (0.86%) Jenkins
2 7 (0.34%) Atlassian Bamboo
2 7 (0.34%) JIRA
3 6 (0.29%) Bitbucket
4 5 (0.24%) Artifactory
4 5 (0.24%) Git
5 4 (0.19%) Maven
6 3 (0.14%) SonarQube
7 2 (0.096%) GitLab
7 2 (0.096%) Selenium
8 1 (0.048%) CircleCI
8 1 (0.048%) Cucumber
8 1 (0.048%) GoCD
8 1 (0.048%) JUnit
8 1 (0.048%) Octopus Deploy
8 1 (0.048%) Subversion
8 1 (0.048%) TeamCity
8 1 (0.048%) TestNG
8 1 (0.048%) Travis CI
8 1 (0.048%) Visual Studio
General
1 638 (30.54%) Social Skills
2 602 (28.82%) Finance
3 197 (9.43%) Banking
4 145 (6.94%) Retail
5 115 (5.51%) Telecoms
6 111 (5.31%) Analytical Skills
7 73 (3.49%) Legal
8 68 (3.26%) Inclusion and Diversity
9 66 (3.16%) Public Sector
10 61 (2.92%) Presentation Skills
11 49 (2.35%) Influencing Skills
12 30 (1.44%) Law
13 26 (1.24%) Manufacturing
13 26 (1.24%) Publishing
14 25 (1.20%) Marketing
15 21 (1.01%) Retail Banking
16 10 (0.48%) Swedish Language
17 8 (0.38%) Advertising
17 8 (0.38%) Danish Language
17 8 (0.38%) Financial Institution
Libraries, Frameworks & Software Standards
1 184 (8.81%) Middleware
2 99 (4.74%) Spring
3 95 (4.55%) .NET
4 83 (3.97%) REST
5 68 (3.26%) Kafka
6 49 (2.35%) JSON
7 47 (2.25%) HTML
7 47 (2.25%) Spring Boot
8 45 (2.15%) React
9 44 (2.11%) SOAP
10 34 (1.63%) XML
11 29 (1.39%) Hibernate
11 29 (1.39%) JDBC
11 29 (1.39%) Struts
12 28 (1.34%) OpenID
13 22 (1.05%) OAuth
14 21 (1.01%) Web Services
15 20 (0.96%) Next.js
16 19 (0.91%) EDI
17 17 (0.81%) ASP.NET
Miscellaneous
1 146 (6.99%) Cloud Native
2 90 (4.31%) Public Cloud
3 83 (3.97%) Product Ownership
4 74 (3.54%) Data Structures
5 71 (3.40%) Enterprise Software
6 56 (2.68%) Hybrid Cloud
7 34 (1.63%) Management Information System
8 31 (1.48%) Robotics
9 27 (1.29%) Legacy Systems
10 26 (1.24%) Data Centre
11 25 (1.20%) Blockchain
12 22 (1.05%) Distributed Systems
13 16 (0.77%) Mobile Banking
13 16 (0.77%) Reinsurance
14 15 (0.72%) Greenfield Project
14 15 (0.72%) SWIFT Messaging Network
15 14 (0.67%) Mobile App
15 14 (0.67%) Self-Motivation
16 13 (0.62%) Cyberattack
16 13 (0.62%) IoT
Operating Systems
1 59 (2.82%) Linux
2 49 (2.35%) Windows
3 18 (0.86%) Android
4 17 (0.81%) Apple iOS
5 12 (0.57%) Unix
6 5 (0.24%) Windows Server
7 1 (0.048%) HPUX
Processes & Methodologies
1 1,032 (49.40%) Agile
2 703 (33.65%) Actionable Insight
3 577 (27.62%) TOGAF
4 491 (23.50%) Enterprise Architecture
5 445 (21.30%) DevOps
6 444 (21.25%) Presales
7 407 (19.48%) IT Strategy
8 388 (18.57%) Problem-Solving
9 367 (17.57%) Microservices
10 357 (17.09%) Analytics
11 356 (17.04%) Business Case
12 338 (16.18%) Thought Leadership
13 318 (15.22%) Technology Strategy
14 312 (14.94%) Roadmaps
15 269 (12.88%) Data Analytics
16 259 (12.40%) Mentoring
16 259 (12.40%) Software Engineering
17 257 (12.30%) Digital Transformation Programme
18 251 (12.02%) Contract Negotiation
19 243 (11.63%) Commercial Awareness
Programming Languages
1 173 (8.28%) Java
2 140 (6.70%) SQL
3 101 (4.83%) Python
4 67 (3.21%) JavaScript
5 65 (3.11%) C#
6 30 (1.44%) PL/SQL
7 18 (0.86%) Perl
7 18 (0.86%) TypeScript
8 15 (0.72%) PowerShell
9 12 (0.57%) Bicep
10 11 (0.53%) Bash
11 7 (0.34%) Kotlin
12 4 (0.19%) C++
13 3 (0.14%) Go
13 3 (0.14%) R
13 3 (0.14%) Scala
14 2 (0.096%) Apex Code
14 2 (0.096%) Ruby
14 2 (0.096%) Shell Script
14 2 (0.096%) Swift
Qualifications
1 416 (19.91%) Security Cleared
2 363 (17.38%) SC Cleared
3 258 (12.35%) Degree
4 224 (10.72%) TOGAF Certification
5 122 (5.84%) Computer Science Degree
6 48 (2.30%) Azure Certification
7 40 (1.91%) DV Cleared
8 38 (1.82%) AWS Certification
9 25 (1.20%) AWS Certified Solutions Architect
10 23 (1.10%) Master's Degree
11 20 (0.96%) BPSS Clearance
12 17 (0.81%) CISMP
13 16 (0.77%) Microsoft Certification
14 8 (0.38%) OCP
14 8 (0.38%) Oracle Certification
15 6 (0.29%) CISSP
16 5 (0.24%) ISSAP
16 5 (0.24%) ITIL Certification
17 4 (0.19%) CCA
17 4 (0.19%) Cisco Certification
Quality Assurance & Compliance
1 45 (2.15%) QA
2 28 (1.34%) SEPA
3 21 (1.01%) GRC
4 20 (0.96%) Data Quality
5 15 (0.72%) ISO 20022
6 10 (0.48%) HL7
7 9 (0.43%) PMO
8 6 (0.29%) DICOM
9 5 (0.24%) Accessibility
10 4 (0.19%) Cyber Essentials
10 4 (0.19%) Sarbanes-Oxley
11 3 (0.14%) ISO/IEC 27001
11 3 (0.14%) SLA
12 2 (0.096%) COBIT
12 2 (0.096%) Cyber Essentials PLUS
12 2 (0.096%) GAMP
12 2 (0.096%) GDPR
13 1 (0.048%) NCSC
13 1 (0.048%) NIST
System Software
1 113 (5.41%) Docker
2 13 (0.62%) Active Directory
3 8 (0.38%) VMware Infrastructure
4 5 (0.24%) VMware ESXi
5 4 (0.19%) Hyper-V
5 4 (0.19%) Virtual Machines
6 1 (0.048%) OpenAM
6 1 (0.048%) Oracle RAC
6 1 (0.048%) RACF
6 1 (0.048%) VirtualBox
Systems Management
1 87 (4.16%) Kubernetes
2 64 (3.06%) Terraform
3 17 (0.81%) Ansible
4 12 (0.57%) Puppet
5 6 (0.29%) WebSphere Cast Iron
6 5 (0.24%) Progress Chef
7 4 (0.19%) Microsoft Intune
8 3 (0.14%) Nagios
8 3 (0.14%) vCenter Server
9 2 (0.096%) Active Directory Federation Services
9 2 (0.096%) Norton AntiVirus
9 2 (0.096%) Oracle Identity Management
9 2 (0.096%) ZABBIX
10 1 (0.048%) Grafana
10 1 (0.048%) Kibana
10 1 (0.048%) logstash
10 1 (0.048%) Oracle RMAN
10 1 (0.048%) SCCM
10 1 (0.048%) Single Sign-On
10 1 (0.048%) WMI
Vendors
1 401 (19.20%) Microsoft
2 138 (6.61%) SAP
3 79 (3.78%) Oracle
4 54 (2.58%) Salesforce
5 52 (2.49%) Google
6 28 (1.34%) Databricks
7 21 (1.01%) ServiceNow
8 20 (0.96%) Informatica
9 19 (0.91%) HP
9 19 (0.91%) Sparx
10 18 (0.86%) Dell
10 18 (0.86%) Remedy
11 17 (0.81%) BMC
11 17 (0.81%) MuleSoft
12 12 (0.57%) VMware
13 10 (0.48%) Cisco
14 9 (0.43%) Adobe
14 9 (0.43%) Confluent
14 9 (0.43%) IBM
14 9 (0.43%) Sitecore