Microsoft Access
UK

The following table provides summary statistics for permanent job vacancies with a requirement for MS Access skills. Included is a benchmarking guide to the salaries offered in vacancies that have cited MS Access over the 6 months to 27 April 2024 with a comparison to the same period in the previous 2 years.

6 months to
27 Apr 2024
Same period 2023 Same period 2022
Rank 764 920 1061
Rank change year-on-year +156 +141 -250
Permanent jobs citing MS Access 132 50 171
As % of all permanent jobs advertised in the UK 0.13% 0.048% 0.11%
As % of the Database & Business Intelligence category 0.73% 0.22% 0.40%
Number of salaries quoted 113 35 92
10th Percentile £24,800 £30,000 £24,750
25th Percentile £28,250 £32,577 £27,500
Median annual salary (50th Percentile) £35,000 £44,666 £40,000
Median % change year-on-year -21.64% +11.66% +6.67%
75th Percentile £45,000 £57,250 £50,000
90th Percentile £52,500 £68,250 £61,250
UK excluding London median annual salary £35,000 £37,000 £36,250
% change year-on-year -5.41% +2.07% +3.57%

All Database and Business Intelligence Skills
UK

MS Access is in the Databases and Business Intelligence category. The following table is for comparison with the above and provides summary statistics for all permanent job vacancies with a requirement for database or business intelligence skills.

Permanent vacancies with a requirement for database or business intelligence skills 18,076 22,599 42,565
As % of all permanent jobs advertised in the UK 18.44% 21.59% 27.62%
Number of salaries quoted 12,541 13,991 21,425
10th Percentile £35,000 £37,500 £36,250
25th Percentile £42,725 £47,500 £45,000
Median annual salary (50th Percentile) £57,500 £65,000 £60,000
Median % change year-on-year -11.54% +8.33% +9.09%
75th Percentile £76,250 £83,750 £78,750
90th Percentile £95,000 £103,750 £95,000
UK excluding London median annual salary £52,500 £55,000 £52,000
% change year-on-year -4.55% +5.77% +6.12%

MS Access
Job Vacancy Trend

Job postings citing MS Access as a proportion of all IT jobs advertised.
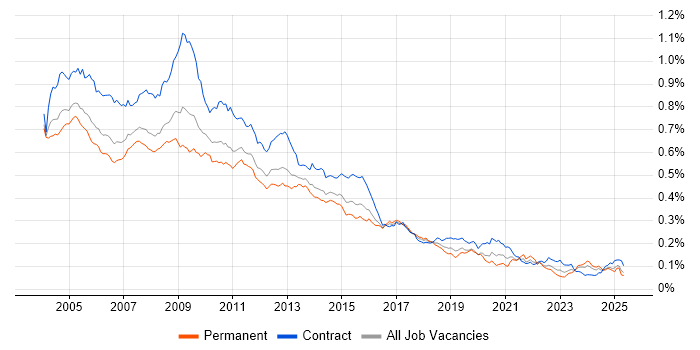
Job vacancy trend for MS Access in the UK

MS Access
Salary Trend

3-month moving average salary quoted in jobs citing MS Access.

Salary trend for MS Access in the UK

MS Access
Salary Histogram

Salary distribution for jobs citing MS Access over the 6 months to 27 April 2024.

Salary histogram for MS Access in the UK

MS Access
Top 14 Job Locations

The table below looks at the demand and provides a guide to the median salaries quoted in IT jobs citing MS Access within the UK over the 6 months to 27 April 2024. The 'Rank Change' column provides an indication of the change in demand within each location based on the same 6 month period last year.

Location Rank Change
on Same Period
Last Year
Matching
Permanent
IT Job Ads
Median Salary
Past 6 Months
Median Salary
% Change
on Same Period
Last Year
Live
Jobs
England +201 126 £35,000 -21.64% 22
UK excluding London +102 106 £35,000 -5.41% 20
East of England +65 54 £32,500 -13.33% 1
Work from Home +104 34 £35,000 -21.64% 11
London +135 24 £60,000 +30.20% 5
North of England +71 24 £35,000 -28.57% 3
North West +28 19 £35,000 -30.00%
South East +46 17 £37,500 -26.83% 2
Yorkshire +96 4 £43,250 +15.33% 2
West Midlands +25 4 £37,575 +21.21% 4
Midlands +6 4 £37,575 +19.69% 4
Scotland - 4 £28,750 - 5
South West -1 3 £25,500 -31.08% 4
North East - 1 £25,000 - 2

MS Access
Co-occurring Skills and Capabilities by Category

The follow tables expand on the table above by listing co-occurrences grouped by category. The same employment type, locality and period is covered with up to 20 co-occurrences shown in each of the following categories:

Application Platforms
1 9 (6.82%) SharePoint
2 6 (4.55%) Oracle Workflow
3 4 (3.03%) CMS
4 2 (1.52%) Drupal
5 1 (0.76%) Microsoft Exchange
Applications
1 60 (45.45%) Microsoft Excel
2 7 (5.30%) Microsoft Office
3 6 (4.55%) Spreadsheet
4 3 (2.27%) Microsoft PowerPoint
5 2 (1.52%) FileZilla
6 1 (0.76%) MS Visio
Business Applications
1 12 (9.09%) Oracle Applications
2 9 (6.82%) Shopify
3 4 (3.03%) Lawson
4 2 (1.52%) Sage 200
4 2 (1.52%) Sage 50
4 2 (1.52%) Visualfiles
5 1 (0.76%) Workday HCM
Cloud Services
1 42 (31.82%) Power Platform
2 10 (7.58%) AWS
3 9 (6.82%) Power Automate
4 6 (4.55%) GitHub
5 5 (3.79%) Azure
6 4 (3.03%) Google Analytics
7 3 (2.27%) GCP
8 2 (1.52%) WhatsApp
9 1 (0.76%) Azure Data Factory
9 1 (0.76%) Azure Synapse Analytics
9 1 (0.76%) Microsoft 365
Communications & Networking
1 7 (5.30%) Intranet
2 2 (1.52%) FTP
2 2 (1.52%) WinSCP
3 1 (0.76%) Radio Access Network
Database & Business Intelligence
1 59 (44.70%) SQL Server
2 42 (31.82%) Power BI
3 17 (12.88%) SQL Server Reporting Services
4 12 (9.09%) Relational Database
4 12 (9.09%) SQL Server Analysis Services
5 11 (8.33%) SQL Server Integration Services
6 9 (6.82%) Geospatial Data
6 9 (6.82%) GIS
6 9 (6.82%) Tableau
7 8 (6.06%) Oracle Reports
8 7 (5.30%) MySQL
9 6 (4.55%) Amazon QuickSight
10 5 (3.79%) Data Mining
11 4 (3.03%) Data Warehouse
11 4 (3.03%) Essbase
12 2 (1.52%) Power Query
13 1 (0.76%) Azure SQL Database
13 1 (0.76%) Data Lake
13 1 (0.76%) Oracle Database
13 1 (0.76%) QlikView
Development Applications
1 32 (24.24%) Visual Studio
2 15 (11.36%) Oracle Forms
3 9 (6.82%) JIRA
4 5 (3.79%) Git
4 5 (3.79%) InstallShield
5 3 (2.27%) SQL Server Management Studio (SSMS)
6 1 (0.76%) Team Foundation Server
General
1 39 (29.55%) Social Skills
2 34 (25.76%) Analytical Skills
3 26 (19.70%) Finance
4 14 (10.61%) Manufacturing
5 13 (9.85%) Legal
6 12 (9.09%) Inclusion and Diversity
7 11 (8.33%) Back Office
7 11 (8.33%) Retail
8 6 (4.55%) Public Sector
8 6 (4.55%) Publishing
9 5 (3.79%) Presentation Skills
10 4 (3.03%) Local Government
10 4 (3.03%) Marketing
11 3 (2.27%) Environmental Health
12 2 (1.52%) Automotive
13 1 (0.76%) Organisational Skills
Job Titles
1 49 (37.12%) Developer
2 32 (24.24%) Analyst
3 19 (14.39%) Senior
4 13 (9.85%) Senior Analyst
5 11 (8.33%) Financial Analyst
5 11 (8.33%) Junior
5 11 (8.33%) Junior Developer
5 11 (8.33%) Junior SQL Developer
5 11 (8.33%) Senior Financial Analyst
5 11 (8.33%) SQL Developer
6 10 (7.58%) Data Analyst
7 9 (6.82%) Application Support Team Leader
7 9 (6.82%) Applications Developer
7 9 (6.82%) Applications Support
7 9 (6.82%) Lead
7 9 (6.82%) Support Team Leader
7 9 (6.82%) Team Leader
8 8 (6.06%) IT Assistant
9 7 (5.30%) ERP Developer
9 7 (5.30%) Systems Analyst
Libraries, Frameworks & Software Standards
1 42 (31.82%) .NET
2 30 (22.73%) Web Services
3 21 (15.91%) JSON
4 19 (14.39%) XML
5 13 (9.85%) ASP.NET Web API
6 11 (8.33%) .NET Framework
6 11 (8.33%) ASP.NET
6 11 (8.33%) HTML
7 10 (7.58%) REST
7 10 (7.58%) SOAP
8 3 (2.27%) AngularJS
8 3 (2.27%) Pandas
8 3 (2.27%) pytest
8 3 (2.27%) React
9 2 (1.52%) .NET Core
9 2 (1.52%) CSS
9 2 (1.52%) ODBC
9 2 (1.52%) RESTful
10 1 (0.76%) EDI
Miscellaneous
1 17 (12.88%) Management Information System
2 9 (6.82%) Driving Licence
2 9 (6.82%) EPoS
3 6 (4.55%) Pricing Data
4 5 (3.79%) Life Science
4 5 (3.79%) Onboarding
4 5 (3.79%) Self-Motivation
5 4 (3.03%) Reinsurance
6 2 (1.52%) iSeries
6 2 (1.52%) Legacy Applications
6 2 (1.52%) Mobile App
6 2 (1.52%) NHS
6 2 (1.52%) Smartphone
7 1 (0.76%) Analytical Mindset
7 1 (0.76%) Market Risk
7 1 (0.76%) Product Ownership
Operating Systems
1 15 (11.36%) Windows
2 3 (2.27%) Android
3 2 (1.52%) Windows 10
3 2 (1.52%) Windows 7
3 2 (1.52%) Windows Server 2008
3 2 (1.52%) Windows Server 2012
4 1 (0.76%) Apple iOS
Processes & Methodologies
1 46 (34.85%) Problem-Solving
2 43 (32.58%) Business Intelligence
3 32 (24.24%) ERP
4 28 (21.21%) Migration
5 25 (18.94%) Computer Science
6 19 (14.39%) API Integration
7 18 (13.64%) Data Modelling
8 15 (11.36%) Line Management
8 15 (11.36%) Order Management
9 14 (10.61%) Decision-Making
10 13 (9.85%) Analytics
11 12 (9.09%) Data Analysis
11 12 (9.09%) User Experience
12 11 (8.33%) Data Migration
12 11 (8.33%) E-Commerce
12 11 (8.33%) Front End Development
13 9 (6.82%) B2B
14 8 (6.06%) Agile
14 8 (6.06%) Data Mapping
14 8 (6.06%) SDLC
Programming Languages
1 94 (71.21%) SQL
2 23 (17.42%) C#
3 21 (15.91%) T-SQL
4 19 (14.39%) VB
4 19 (14.39%) VB.NET
5 16 (12.12%) VBA
6 6 (4.55%) Python
7 5 (3.79%) JavaScript
8 1 (0.76%) Data Analysis Expressions
Qualifications
1 47 (35.61%) Degree
2 17 (12.88%) Computer Science Degree
3 2 (1.52%) Master's Degree
3 2 (1.52%) Microsoft Certification
4 1 (0.76%) DBS Check
4 1 (0.76%) HND
4 1 (0.76%) Numerate Degree
4 1 (0.76%) NVQ Level 3
Quality Assurance & Compliance
1 8 (6.06%) Data Quality
2 5 (3.79%) QA
3 4 (3.03%) GDPR
4 1 (0.76%) Accessibility
4 1 (0.76%) ISO 9001
4 1 (0.76%) ISO/IEC 27001
System Software
1 2 (1.52%) Active Directory
1 2 (1.52%) Microsoft App-V
1 2 (1.52%) XenApp
Systems Management
1 2 (1.52%) ThinApp
2 1 (0.76%) Microsoft Intune
Vendors
1 90 (68.18%) Microsoft
2 23 (17.42%) Oracle
3 10 (7.58%) SAP
4 9 (6.82%) Civica
5 6 (4.55%) Alteryx
5 6 (4.55%) Informatica
5 6 (4.55%) Jitterbit
5 6 (4.55%) Sage
5 6 (4.55%) Talend
6 5 (3.79%) Google
7 4 (3.03%) Cognos
7 4 (3.03%) JD Edwards
8 3 (2.27%) Quadient
9 2 (1.52%) Citrix
9 2 (1.52%) DevExpress
9 2 (1.52%) Epicor
9 2 (1.52%) LexisNexis
9 2 (1.52%) Salesforce
9 2 (1.52%) VMware
9 2 (1.52%) Xero