Data-Driven Decision Making Jobs

Data-Driven Decision Making
UK

The table below provides summary statistics for permanent job vacancies requiring Data-Driven Decision Making skills. It includes a benchmarking guide to the annual salaries offered in vacancies that cited Data-Driven Decision Making over the 6 months leading up to 5 July 2025, comparing them to the same period in the previous two years.

6 months to
5 Jul 2025
Same period 2024 Same period 2023
Rank 254 433 479
Rank change year-on-year +179 +46 +14
Permanent jobs citing Data-Driven Decision Making 725 590 507
As % of all permanent jobs advertised in the UK 1.22% 0.55% 0.57%
As % of the Processes & Methodologies category 1.34% 0.67% 0.60%
Number of salaries quoted 330 411 210
10th Percentile £40,000 £36,250 £36,209
25th Percentile £48,813 £46,250 £44,192
Median annual salary (50th Percentile) £60,609 £55,000 £57,577
Median % change year-on-year +10.20% -4.48% -4.04%
75th Percentile £82,500 £77,500 £75,000
90th Percentile £102,500 £92,500 £86,250
UK excluding London median annual salary £57,500 £52,550 £52,500
% change year-on-year +9.42% +0.10% +3.04%

All Process and Methodology Skills
UK

Data-Driven Decision Making falls under the Processes and Methodologies category. For comparison with the information above, the following table provides summary statistics for all permanent job vacancies requiring process or methodology skills.

Permanent vacancies with a requirement for process or methodology skills 54,056 88,173 84,676
As % of all permanent jobs advertised in the UK 90.82% 82.50% 95.28%
Number of salaries quoted 28,040 60,645 53,248
10th Percentile £27,868 £29,750 £33,750
25th Percentile £38,750 £40,000 £45,000
Median annual salary (50th Percentile) £55,000 £55,000 £60,249
Median % change year-on-year - -8.71% +0.42%
75th Percentile £74,813 £72,500 £80,000
90th Percentile £96,250 £92,500 £100,000
UK excluding London median annual salary £50,055 £50,000 £55,000
% change year-on-year +0.11% -9.09% +4.76%

Data-Driven Decision Making
Job Vacancy Trend

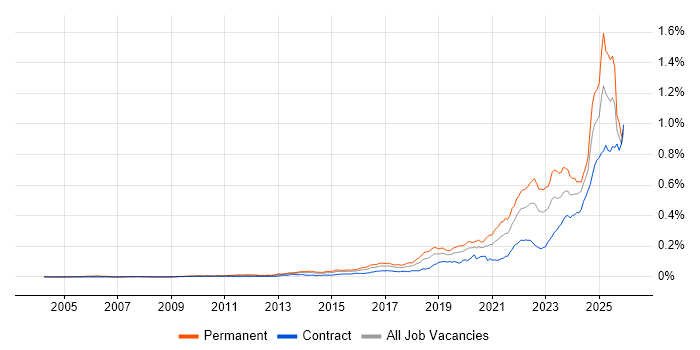
Job postings citing Data-Driven Decision Making as a proportion of all IT jobs advertised.

Job vacancy trend for Data-Driven Decision Making in the UK

Data-Driven Decision Making
Salary Trend

3-month moving average salary quoted in jobs citing Data-Driven Decision Making.

Salary trend for Data-Driven Decision Making in the UK

Data-Driven Decision Making
Salary Histogram

Salary distribution for jobs citing Data-Driven Decision Making over the 6 months to 5 July 2025.

Salary histogram for Data-Driven Decision Making in the UK

Data-Driven Decision Making
Top 16 Job Locations

The table below looks at the demand and provides a guide to the median salaries quoted in IT jobs citing Data-Driven Decision Making within the UK over the 6 months to 5 July 2025. The 'Rank Change' column provides an indication of the change in demand within each location based on the same 6 month period last year.

Location Rank Change
on Same Period
Last Year
Matching
Permanent
IT Job Ads
Median Salary
Past 6 Months
Median Salary
% Change
on Same Period
Last Year
Live
Jobs
England +163 645 £60,743 +10.44% 2,195
UK excluding London +143 406 £57,500 +9.42% 988
London +169 269 £75,000 +3.45% 1,332
Work from Home +154 207 £58,625 -6.20% 819
North of England +69 108 £57,500 +15.00% 292
South East +13 94 £64,500 +22.74% 219
Midlands +112 89 £57,500 +4.55% 152
North West +13 76 £57,500 +6.98% 180
West Midlands +76 59 £57,500 +4.55% 103
South West +111 47 £46,500 -15.45% 103
Scotland +81 40 £82,500 +45.70% 73
East Midlands +57 30 £57,500 +15.00% 49
Yorkshire +61 29 £57,500 +15.00% 91
East of England +48 25 £43,500 -17.14% 97
Wales +31 4 £55,000 - 39
North East +41 3 £57,500 +15.00% 22

Data-Driven Decision Making
Co-occurring Skills and Capabilities by Category

The follow tables expand on the table above by listing co-occurrences grouped by category. The same employment type, locality and period is covered with up to 20 co-occurrences shown in each of the following categories:

Application Platforms
1 23 (3.17%) Jupyter
2 15 (2.07%) Apache Spark
3 9 (1.24%) SharePoint
4 8 (1.10%) Apache
5 6 (0.83%) Confluence
6 4 (0.55%) CMS
6 4 (0.55%) IBM Domino
7 3 (0.41%) Drupal
8 2 (0.28%) Adobe Experience Manager
8 2 (0.28%) Apache Airflow
9 1 (0.14%) WordPress
Applications
1 146 (20.14%) Microsoft Office
2 59 (8.14%) Microsoft Excel
3 4 (0.55%) Trello
4 3 (0.41%) Chatbot
4 3 (0.41%) Microsoft PowerPoint
5 2 (0.28%) Microsoft Project
Business Applications
1 13 (1.79%) Salesforce CRM
2 7 (0.97%) Dynamics CRM
3 5 (0.69%) SAP WM
4 4 (0.55%) Payment Gateway
4 4 (0.55%) SAP S/4HANA
5 3 (0.41%) Dynamics GP
5 3 (0.41%) NetSuite
6 2 (0.28%) Adobe Campaign
6 2 (0.28%) Workday HCM
7 1 (0.14%) iTrent
7 1 (0.14%) Oracle EBS
7 1 (0.14%) Oracle ERP
7 1 (0.14%) Oracle SCM
7 1 (0.14%) SAP PM
7 1 (0.14%) Sparx Enterprise Architect
7 1 (0.14%) Sprinklr
Cloud Services
1 126 (17.38%) Power Platform
2 124 (17.10%) Azure
3 45 (6.21%) AWS
4 42 (5.79%) Google Analytics
5 38 (5.24%) SaaS
6 28 (3.86%) Azure Data Factory
7 23 (3.17%) GCP
8 19 (2.62%) Snowflake
9 15 (2.07%) Google Ads
10 14 (1.93%) Google Sheets
11 10 (1.38%) Microsoft 365
12 9 (1.24%) AWS Lambda
12 9 (1.24%) Google Tag Manager
12 9 (1.24%) Miro
12 9 (1.24%) Power Automate
12 9 (1.24%) Serverless
13 8 (1.10%) Azure Synapse Analytics
13 8 (1.10%) Google Workspace
14 7 (0.97%) GitHub
14 7 (0.97%) PaaS
Communications & Networking
1 7 (0.97%) Network Security
1 7 (0.97%) SMS
2 6 (0.83%) Firewall
2 6 (0.83%) VPN
3 5 (0.69%) LoRaWAN
4 4 (0.55%) Intrusion Detection
4 4 (0.55%) Wi-Fi
5 3 (0.41%) Internet
6 2 (0.28%) BGP
6 2 (0.28%) DHCP
6 2 (0.28%) DNS
6 2 (0.28%) LAN
6 2 (0.28%) OSPF
6 2 (0.28%) SD-WAN
6 2 (0.28%) TCP/IP
6 2 (0.28%) VLAN
6 2 (0.28%) WAN
7 1 (0.14%) 5G
7 1 (0.14%) LTE
7 1 (0.14%) MQTT
Database & Business Intelligence
1 123 (16.97%) Power BI
2 56 (7.72%) Data Warehouse
3 41 (5.66%) SQL Server
3 41 (5.66%) Tableau
4 33 (4.55%) Big Data
5 19 (2.62%) Data Lake
6 18 (2.48%) SQL Server Integration Services
7 12 (1.66%) Azure SQL Database
8 10 (1.38%) Looker
9 9 (1.24%) Data Hub
9 9 (1.24%) SQL Server Reporting Services
10 7 (0.97%) Amazon Redshift
10 7 (0.97%) Metadata
10 7 (0.97%) NoSQL
10 7 (0.97%) Power Query
11 6 (0.83%) Data Mining
11 6 (0.83%) MS Access
11 6 (0.83%) MySQL
12 5 (0.69%) MongoDB
12 5 (0.69%) PostgreSQL
Development Applications
1 24 (3.31%) JIRA
2 9 (1.24%) Visual Studio
3 6 (0.83%) Octopus Deploy
4 5 (0.69%) Jenkins
5 4 (0.55%) ERwin
5 4 (0.55%) Git
6 2 (0.28%) JUnit
7 1 (0.14%) ER Studio
7 1 (0.14%) GitLab
7 1 (0.14%) Mercurial
7 1 (0.14%) RStudio
7 1 (0.14%) Visual Website Optimizer
7 1 (0.14%) WaveMaker
General
1 404 (55.72%) Social Skills
2 305 (42.07%) Finance
3 239 (32.97%) Analytical Skills
4 235 (32.41%) Marketing
5 157 (21.66%) Legal
6 89 (12.28%) Law
7 55 (7.59%) Retail
8 46 (6.34%) Inclusion and Diversity
9 35 (4.83%) Banking
10 26 (3.59%) Influencing Skills
11 23 (3.17%) Manufacturing
12 22 (3.03%) Advertising
13 15 (2.07%) Financial Institution
14 13 (1.79%) Public Sector
15 12 (1.66%) Automotive
15 12 (1.66%) Presentation Skills
16 10 (1.38%) Front Office
17 9 (1.24%) Organisational Skills
18 7 (0.97%) Aviation
19 6 (0.83%) Agriculture
Job Titles
1 127 (17.52%) Customer Executive
2 90 (12.41%) Senior
3 88 (12.14%) Lead
4 78 (10.76%) Analyst
5 48 (6.62%) Developer
6 32 (4.41%) Data Engineer
6 32 (4.41%) Data Scientist
6 32 (4.41%) Innovation Manager
7 27 (3.72%) Product Manager
8 23 (3.17%) Data Analyst
8 23 (3.17%) Senior Data Scientist
8 23 (3.17%) SQL Developer
9 17 (2.34%) Product Owner
10 16 (2.21%) Data Analytics Director
10 16 (2.21%) Database Developer
10 16 (2.21%) Senior Analyst
10 16 (2.21%) SQL Database Developer
11 14 (1.93%) Business Intelligence Developer
11 14 (1.93%) IT Manager
12 13 (1.79%) Data Manager
Libraries, Frameworks & Software Standards
1 12 (1.66%) .NET
2 8 (1.10%) EDI
2 8 (1.10%) Node.js
3 7 (0.97%) HTML
4 6 (0.83%) JSON
4 6 (0.83%) NestJS
4 6 (0.83%) React
4 6 (0.83%) REST
4 6 (0.83%) RESTful
4 6 (0.83%) XML
5 4 (0.55%) CSS
6 3 (0.41%) Middleware
7 2 (0.28%) GraphQL
7 2 (0.28%) Kafka
7 2 (0.28%) Pyramid
7 2 (0.28%) React Native
7 2 (0.28%) SOAP
7 2 (0.28%) Spring
7 2 (0.28%) Spring Boot
8 1 (0.14%) XGBoost
Miscellaneous
1 70 (9.66%) Product Ownership
2 40 (5.52%) Social Media
3 39 (5.38%) FMCG
4 31 (4.28%) Algorithms
5 27 (3.72%) Analytical Mindset
6 23 (3.17%) Cyberattack
6 23 (3.17%) Management Information System
7 20 (2.76%) Self-Motivation
8 17 (2.34%) Onboarding
9 12 (1.66%) Cloud Native
10 11 (1.52%) IoT
11 8 (1.10%) Data Structures
11 8 (1.10%) Renewable Energy
12 6 (0.83%) Legacy Systems
13 5 (0.69%) Credit Risk
13 5 (0.69%) Data Centre
13 5 (0.69%) Life Science
13 5 (0.69%) Operational Technology
13 5 (0.69%) Replication
14 4 (0.55%) Blog
Operating Systems
1 6 (0.83%) Linux
2 5 (0.69%) Unix
3 4 (0.55%) Windows
3 4 (0.55%) Windows Server
4 1 (0.14%) VMS
Processes & Methodologies
1 587 (80.97%) Decision-Making
2 313 (43.17%) Analytics
3 180 (24.83%) Problem-Solving
4 178 (24.55%) Business Intelligence
5 153 (21.10%) Artificial Intelligence
6 139 (19.17%) Business Development
7 138 (19.03%) Continuous Improvement
8 133 (18.34%) Visualisation
9 129 (17.79%) Contract Negotiation
10 118 (16.28%) Stakeholder Management
11 116 (16.00%) Roadmaps
12 99 (13.66%) Data Governance
13 96 (13.24%) Project Management
14 95 (13.10%) Agile
15 90 (12.41%) Data Analysis
16 83 (11.45%) Machine Learning
17 81 (11.17%) Actionable Insight
17 81 (11.17%) Data Strategy
18 76 (10.48%) Data Science
18 76 (10.48%) Mentoring
Programming Languages
1 155 (21.38%) SQL
2 103 (14.21%) Python
3 34 (4.69%) T-SQL
4 33 (4.55%) JavaScript
5 30 (4.14%) Java
6 13 (1.79%) Data Analysis Expressions
7 10 (1.38%) R
8 7 (0.97%) PowerShell
8 7 (0.97%) TypeScript
9 6 (0.83%) C#
10 5 (0.69%) VBA
11 4 (0.55%) PHP
12 3 (0.41%) Bash
12 3 (0.41%) C++
12 3 (0.41%) Scala
13 2 (0.28%) VB
14 1 (0.14%) F#
14 1 (0.14%) Fortran
14 1 (0.14%) Lisp
14 1 (0.14%) PL/SQL
Qualifications
1 145 (20.00%) Degree
2 31 (4.28%) Computer Science Degree
3 26 (3.59%) DBS Check
3 26 (3.59%) Security Cleared
4 24 (3.31%) DV Cleared
5 19 (2.62%) Master's Degree
6 11 (1.52%) PMI Certification
6 11 (1.52%) PMP
7 8 (1.10%) Microsoft Certification
8 5 (0.69%) ACCA
8 5 (0.69%) Azure Certification
9 4 (0.55%) BPSS Clearance
9 4 (0.55%) PhD
10 3 (0.41%) SC Cleared
11 2 (0.28%) CCAB
11 2 (0.28%) CCIE
11 2 (0.28%) CIMA
11 2 (0.28%) Cisco Certification
11 2 (0.28%) CISSP
11 2 (0.28%) Six Sigma Black Belt
Quality Assurance & Compliance
1 50 (6.90%) Data Quality
2 34 (4.69%) Accessibility
2 34 (4.69%) GDPR
3 16 (2.21%) QA
4 9 (1.24%) Cyber Essentials
5 6 (0.83%) Actionable Recommendations
6 3 (0.41%) Sarbanes-Oxley
7 2 (0.28%) IEC 62304
7 2 (0.28%) ISO 13485
7 2 (0.28%) ISO/IEC 27001
8 1 (0.14%) GRC
8 1 (0.14%) HIPAA
8 1 (0.14%) MiFID
8 1 (0.14%) NCSC
8 1 (0.14%) NIST
8 1 (0.14%) PCI DSS
8 1 (0.14%) PSD2
8 1 (0.14%) SLA
8 1 (0.14%) SOC 2
System Software
1 35 (4.83%) Docker
2 4 (0.55%) Hyper-V
2 4 (0.55%) VMware Infrastructure
3 1 (0.14%) HDFS
Systems Management
1 30 (4.14%) Kubernetes
2 4 (0.55%) Ansible
2 4 (0.55%) FortiGate
3 3 (0.41%) Grafana
3 3 (0.41%) Prometheus
3 3 (0.41%) Terraform
4 2 (0.28%) Systems Management Server (SMS)
5 1 (0.14%) Matomo
Vendors
1 170 (23.45%) Salesforce
2 119 (16.41%) Microsoft
3 72 (9.93%) Google
4 27 (3.72%) SAP
5 22 (3.03%) Databricks
6 13 (1.79%) Informatica
7 9 (1.24%) Adobe
8 7 (0.97%) HubSpot
9 6 (0.83%) Hotjar
10 4 (0.55%) Fortinet
10 4 (0.55%) Gigya
10 4 (0.55%) Oracle
10 4 (0.55%) PayPal
10 4 (0.55%) ServiceNow
10 4 (0.55%) VMware
10 4 (0.55%) Xero
10 4 (0.55%) YouTube
11 3 (0.41%) IBM
11 3 (0.41%) Sage
11 3 (0.41%) Sun