Cybersecurity Jobs

Cybersecurity
UK

The table below provides summary statistics for permanent job vacancies requiring Cybersecurity skills. It includes a benchmarking guide to the annual salaries offered in vacancies that cited Cybersecurity over the 6 months leading up to 30 April 2025, comparing them to the same period in the previous two years.

6 months to
30 Apr 2025
Same period 2024 Same period 2023
Rank 31 37 45
Rank change year-on-year +6 +8 +30
Permanent jobs citing Cybersecurity 3,274 5,464 6,391
As % of all permanent jobs advertised in the UK 6.28% 5.56% 6.15%
As % of the Processes & Methodologies category 6.73% 6.46% 6.43%
Number of salaries quoted 2,123 3,980 3,348
10th Percentile £27,500 £35,738 £37,500
25th Percentile £46,125 £45,000 £50,000
Median annual salary (50th Percentile) £54,000 £57,500 £65,000
Median % change year-on-year -6.09% -11.54% -
75th Percentile £73,750 £75,063 £80,000
90th Percentile £95,000 £95,000 £97,500
UK excluding London median annual salary £47,683 £52,500 £59,526
% change year-on-year -9.18% -11.80% +3.52%

All Process and Methodology Skills
UK

Cybersecurity falls under the Processes and Methodologies category. For comparison with the information above, the following table provides summary statistics for all permanent job vacancies requiring process or methodology skills.

Permanent vacancies with a requirement for process or methodology skills 48,641 84,574 99,457
As % of all permanent jobs advertised in the UK 93.26% 86.00% 95.63%
Number of salaries quoted 26,531 59,798 58,397
10th Percentile £30,580 £29,000 £34,000
25th Percentile £42,500 £40,000 £45,000
Median annual salary (50th Percentile) £57,500 £55,000 £61,500
Median % change year-on-year +4.55% -10.57% +2.50%
75th Percentile £76,250 £72,500 £82,500
90th Percentile £98,750 £92,500 £100,000
UK excluding London median annual salary £52,500 £50,000 £55,000
% change year-on-year +5.00% -9.09% +4.76%

Cybersecurity
Job Vacancy Trend

Job postings citing Cybersecurity as a proportion of all IT jobs advertised.
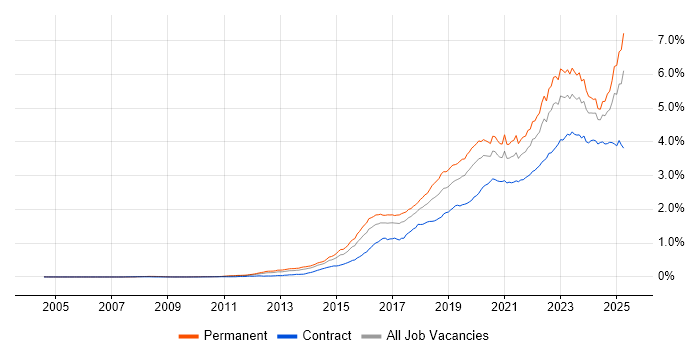
Job vacancy trend for Cybersecurity in the UK

Cybersecurity
Salary Trend

3-month moving average salary quoted in jobs citing Cybersecurity.

Salary trend for Cybersecurity in the UK

Cybersecurity
Salary Histogram

Salary distribution for jobs citing Cybersecurity over the 6 months to 30 April 2025.

Salary histogram for Cybersecurity in the UK

Cybersecurity
Top 19 Job Locations

The table below looks at the demand and provides a guide to the median salaries quoted in IT jobs citing Cybersecurity within the UK over the 6 months to 30 April 2025. The 'Rank Change' column provides an indication of the change in demand within each location based on the same 6 month period last year.

Location Rank Change
on Same Period
Last Year
Matching
Permanent
IT Job Ads
Median Salary
Past 6 Months
Median Salary
% Change
on Same Period
Last Year
Live
Jobs
England +1 2,894 £55,000 -4.35% 1,785
UK excluding London +6 2,263 £47,683 -9.18% 1,205
Work from Home +28 1,602 £47,683 -17.07% 1,312
London -7 813 £75,000 +3.45% 704
North of England -6 588 £47,683 -8.45% 311
Midlands +8 533 £47,683 -13.30% 170
South East -2 514 £47,683 -5.58% 304
North West -22 406 £54,793 +5.20% 197
West Midlands +2 342 £60,000 +9.09% 113
South West -4 228 £47,683 -20.53% 164
East Midlands +24 188 £47,683 +12.20% 55
Scotland +41 171 £47,683 -13.30% 112
Yorkshire +13 166 £47,683 -4.63% 90
East of England +3 155 £47,683 -11.70% 109
Wales +37 57 £48,500 -7.63% 29
Northern Ireland +30 16 £57,500 +35.29% 28
North East -12 16 £37,935 -10.74% 26
Isle of Man +10 3 £43,000 +14.67% 1
Channel Islands +2 2 £78,750 -21.25%

Cybersecurity
Co-occurring Skills and Capabilities by Category

The follow tables expand on the table above by listing co-occurrences grouped by category. The same employment type, locality and period is covered with up to 20 co-occurrences shown in each of the following categories:

Application Platforms
1 99 (3.02%) SharePoint
2 98 (2.99%) Microsoft Exchange
3 27 (0.82%) Confluence
4 17 (0.52%) IIS
5 12 (0.37%) Umbraco
6 9 (0.27%) Apache Airflow
7 8 (0.24%) Apache
8 6 (0.18%) CMS
9 5 (0.15%) Apache Spark
10 3 (0.092%) Adobe Experience Manager
10 3 (0.092%) Apache Solr
10 3 (0.092%) nginx
10 3 (0.092%) Skype for Business
10 3 (0.092%) WordPress
11 2 (0.061%) SharePoint Server
11 2 (0.061%) TPMS
12 1 (0.031%) Oracle Workflow
12 1 (0.031%) SAS
Applications
1 60 (1.83%) Microsoft Office
2 36 (1.10%) Maya
3 31 (0.95%) Microsoft Excel
4 21 (0.64%) Simulink
5 19 (0.58%) Microsoft Project
6 14 (0.43%) Chatbot
6 14 (0.43%) Trello
7 11 (0.34%) Microsoft PowerPoint
8 4 (0.12%) MS Visio
9 3 (0.092%) Spreadsheet
10 2 (0.061%) Adobe Creative Suite
11 1 (0.031%) OrCAD
11 1 (0.031%) TargetLink
Business Applications
1 29 (0.89%) Dynamics CRM
2 13 (0.40%) NetSuite
3 11 (0.34%) SAP S/4HANA
4 9 (0.27%) SAP IBP
5 6 (0.18%) Salesforce CRM
6 5 (0.15%) Exchequer
7 4 (0.12%) Dynamics NAV
8 3 (0.092%) Fidessa
8 3 (0.092%) Sage 50
8 3 (0.092%) SAP CO
8 3 (0.092%) SAP CX
8 3 (0.092%) SAP FI
8 3 (0.092%) SAP FI/CO
8 3 (0.092%) SAP FSCM
8 3 (0.092%) Sprinklr
9 2 (0.061%) Elite 3E
9 2 (0.061%) SAP IS-U
10 1 (0.031%) CiviCRM
10 1 (0.031%) Finacle
10 1 (0.031%) Workday HCM
Cloud Services
1 578 (17.65%) Azure
2 390 (11.91%) Microsoft 365
3 255 (7.79%) AWS
4 111 (3.39%) GCP
5 99 (3.02%) Entra ID
6 80 (2.44%) SaaS
7 78 (2.38%) Cloud Computing
8 60 (1.83%) Azure Sentinel
9 59 (1.80%) Power Platform
10 57 (1.74%) PaaS
11 48 (1.47%) IaaS
12 40 (1.22%) Azure DevOps
13 38 (1.16%) OneDrive
14 32 (0.98%) Power Automate
15 26 (0.79%) GitHub
16 19 (0.58%) Microsoft Purview
17 17 (0.52%) Dynamics 365
17 17 (0.52%) PowerApps
18 12 (0.37%) Boomi
18 12 (0.37%) Google Workspace
Communications & Networking
1 378 (11.55%) Firewall
2 170 (5.19%) Network Security
3 140 (4.28%) DNS
4 101 (3.08%) VPN
5 99 (3.02%) WAN
6 97 (2.96%) VoIP
7 96 (2.93%) TCP/IP
8 91 (2.78%) DHCP
9 80 (2.44%) LAN
10 66 (2.02%) Intrusion Detection
11 60 (1.83%) VLAN
12 38 (1.16%) Internet
13 36 (1.10%) Wi-Fi
14 31 (0.95%) SAN
15 29 (0.89%) 5G
16 23 (0.70%) 3GPP
16 23 (0.70%) Wireless
17 19 (0.58%) HTTP
18 18 (0.55%) SD-WAN
19 17 (0.52%) SSL
Database & Business Intelligence
1 47 (1.44%) Power BI
2 38 (1.16%) SQL Server
3 23 (0.70%) MongoDB
4 22 (0.67%) Amazon RDS
4 22 (0.67%) Data Warehouse
5 18 (0.55%) Data Lake
6 17 (0.52%) PostgreSQL
7 15 (0.46%) MySQL
8 13 (0.40%) Big Data
8 13 (0.40%) NoSQL
8 13 (0.40%) Tableau
9 11 (0.34%) BigQuery
10 10 (0.31%) Elasticsearch
10 10 (0.31%) SAP BW
11 8 (0.24%) Relational Database
12 6 (0.18%) Metadata
13 5 (0.15%) Hadoop
14 4 (0.12%) Data Mining
15 3 (0.092%) GIS
15 3 (0.092%) MS Access
Development Applications
1 75 (2.29%) JIRA
2 21 (0.64%) Git
3 20 (0.61%) Rational DOORS
4 18 (0.55%) Selenium
5 16 (0.49%) Jenkins
6 14 (0.43%) SonarQube
7 12 (0.37%) Burp Suite
8 10 (0.31%) Bitbucket
9 9 (0.27%) Atlassian Bamboo
9 9 (0.27%) GitLab
10 6 (0.18%) AppScan
11 5 (0.15%) Metasploit
11 5 (0.15%) Subversion
12 4 (0.12%) Visual Studio
13 3 (0.092%) Babel
13 3 (0.092%) IntelliJ
13 3 (0.092%) Sonatype Nexus
13 3 (0.092%) webpack
14 2 (0.061%) Apache Archiva
14 2 (0.061%) rollup.js
General
1 831 (25.38%) Social Skills
2 553 (16.89%) Finance
3 493 (15.06%) Presentation Skills
4 430 (13.13%) Legal
5 405 (12.37%) Law
6 375 (11.45%) Inclusion and Diversity
7 348 (10.63%) Analytical Skills
8 181 (5.53%) Banking
9 138 (4.22%) Telecoms
10 124 (3.79%) Marketing
11 119 (3.63%) Retail
12 118 (3.60%) Public Sector
13 104 (3.18%) Manufacturing
14 73 (2.23%) Electronics
15 62 (1.89%) Games
16 59 (1.80%) Organisational Skills
17 47 (1.44%) Aerospace
18 35 (1.07%) Military
19 34 (1.04%) Influencing Skills
20 33 (1.01%) Pharmaceutical
Job Titles
1 450 (13.74%) Systems Engineer
2 436 (13.32%) Analyst
3 363 (11.09%) Security Engineer
4 325 (9.93%) Senior
5 263 (8.03%) Security Analyst
6 199 (6.08%) Lead
7 176 (5.38%) Architect
8 174 (5.31%) IT Support
9 167 (5.10%) Principal Engineer
10 147 (4.49%) Principal Security Engineer
11 133 (4.06%) Security Manager
12 113 (3.45%) IT Manager
13 104 (3.18%) Consultant
14 88 (2.69%) Product Analyst
15 87 (2.66%) Principal Security Analyst
16 86 (2.63%) Cybersecurity Analyst
17 82 (2.50%) Cybersecurity Engineer
18 79 (2.41%) Senior Security Engineer
19 74 (2.26%) Cybersecurity Manager
20 73 (2.23%) IT Analyst
Libraries, Frameworks & Software Standards
1 60 (1.83%) Software Packaging
2 48 (1.47%) React
3 33 (1.01%) Middleware
3 33 (1.01%) Node.js
4 30 (0.92%) REST
5 29 (0.89%) Kafka
5 29 (0.89%) Web Services
6 19 (0.58%) .NET
6 19 (0.58%) AngularJS
6 19 (0.58%) CSS
6 19 (0.58%) SAML
7 17 (0.52%) YAML
8 16 (0.49%) HTML
9 15 (0.46%) MERN Stack
9 15 (0.46%) OAuth
10 13 (0.40%) OpenID
11 11 (0.34%) Ajax
11 11 (0.34%) jQuery
11 11 (0.34%) Leaflet
12 10 (0.31%) SOAP
Miscellaneous
1 315 (9.62%) Management Information System
2 308 (9.41%) Cyberattack
3 214 (6.54%) Security Posture
4 154 (4.70%) Cyber Threat
5 129 (3.94%) Data Centre
6 84 (2.57%) Self-Motivation
7 78 (2.38%) Onboarding
8 74 (2.26%) Operational Technology
9 48 (1.47%) Security Operations Centre
10 47 (1.44%) Social Media
11 45 (1.37%) CCTV
11 45 (1.37%) Enterprise Software
12 38 (1.16%) Cyber Security Posture
12 38 (1.16%) Data Protection Act
13 33 (1.01%) Virtual Team
14 32 (0.98%) SCADA
15 30 (0.92%) Cloud Native
16 28 (0.86%) Cyber Defence
16 28 (0.86%) PMI
17 27 (0.82%) Hybrid Cloud
Operating Systems
1 408 (12.46%) Windows
2 161 (4.92%) Windows Server
3 139 (4.25%) Linux
4 81 (2.47%) Windows 10
5 39 (1.19%) Mac OS
6 24 (0.73%) Windows Vista
7 21 (0.64%) Apple iOS
8 20 (0.61%) Android
9 19 (0.58%) Unix
10 13 (0.40%) Red Hat Enterprise Linux
11 12 (0.37%) Windows Server 2016
11 12 (0.37%) Windows Server 2019
12 8 (0.24%) Windows 7
13 6 (0.18%) Windows Server 2012
14 4 (0.12%) VMS
15 2 (0.061%) Solaris
15 2 (0.061%) Ubuntu
15 2 (0.061%) Windows Server 2003
15 2 (0.061%) Windows Server 2008
16 1 (0.031%) Windows 8
Processes & Methodologies
1 675 (20.62%) Agile
2 620 (18.94%) Information Security
3 604 (18.45%) Risk Management
4 521 (15.91%) Problem-Solving
5 478 (14.60%) Systems Engineering
6 436 (13.32%) SysML
7 420 (12.83%) MODAF
7 420 (12.83%) UML
8 412 (12.58%) Project Management
9 387 (11.82%) Line Management
10 358 (10.93%) Incident Response
11 313 (9.56%) Creative Thinking
12 297 (9.07%) Computer Science
13 292 (8.92%) SIEM
14 264 (8.06%) Artificial Intelligence
15 248 (7.57%) Continuous Improvement
16 239 (7.30%) Vulnerability Management
17 228 (6.96%) Mentoring
18 215 (6.57%) Security Operations
19 211 (6.44%) ITIL
Programming Languages
1 440 (13.44%) MATLAB
2 195 (5.96%) PowerShell
2 195 (5.96%) Python
3 100 (3.05%) SQL
4 67 (2.05%) JavaScript
5 51 (1.56%) Java
6 50 (1.53%) TypeScript
7 48 (1.47%) C#
8 44 (1.34%) Bash
9 30 (0.92%) Kusto Query Language
10 28 (0.86%) C++
11 19 (0.58%) Kotlin
11 19 (0.58%) Perl
12 17 (0.52%) C
13 11 (0.34%) PHP
14 7 (0.21%) Go
14 7 (0.21%) Ruby
15 5 (0.15%) R
15 5 (0.15%) Rust
16 4 (0.12%) Objective-C
Qualifications
1 1,261 (38.52%) Degree
2 650 (19.85%) BPSS Clearance
3 532 (16.25%) CISSP
4 402 (12.28%) CISM
5 257 (7.85%) Security Cleared
6 158 (4.83%) CESG Certified Professional
7 138 (4.22%) Computer Science Degree
8 133 (4.06%) SC Cleared
9 96 (2.93%) CEH
10 91 (2.78%) Master's Degree
11 86 (2.63%) DV Cleared
12 84 (2.57%) PMI Certification
13 80 (2.44%) CISA
14 79 (2.41%) CompTIA Security+
15 77 (2.35%) Cisco Certification
16 65 (1.99%) CRISC
17 61 (1.86%) DBS Check
18 57 (1.74%) PMP
19 51 (1.56%) GCIH
20 50 (1.53%) Microsoft Certification
Quality Assurance & Compliance
1 545 (16.65%) ISO/IEC 27001
2 503 (15.36%) NIST
3 377 (11.51%) NCSC
4 226 (6.90%) GDPR
5 164 (5.01%) Cyber Essentials
6 162 (4.95%) JSP 440
7 148 (4.52%) RMADS
8 81 (2.47%) Cyber Essentials PLUS
9 80 (2.44%) PCI DSS
10 73 (2.23%) GRC
11 45 (1.37%) QA
12 35 (1.07%) SLA
13 28 (0.86%) HIPAA
14 27 (0.82%) COBIT
15 26 (0.79%) Accessibility
16 24 (0.73%) GxP
16 24 (0.73%) ISO/IEC 27002 (supersedes ISO/IEC 17799)
17 23 (0.70%) Def Stans
17 23 (0.70%) NIST 800
18 17 (0.52%) SOC 2
System Software
1 251 (7.67%) Active Directory
2 83 (2.54%) VMware Infrastructure
3 62 (1.89%) Hyper-V
4 51 (1.56%) Docker
5 46 (1.41%) Virtual Machines
6 19 (0.58%) Virtual Desktop
7 12 (0.37%) VMware ESXi
8 11 (0.34%) Firmware
9 5 (0.15%) Terminal Services
9 5 (0.15%) vSphere
10 2 (0.061%) Postfix
10 2 (0.061%) Virtual Servers
10 2 (0.061%) VirtualBox
11 1 (0.031%) Embedded Firmware
11 1 (0.031%) HDFS
11 1 (0.031%) pfSense
11 1 (0.031%) Snort
11 1 (0.031%) Veritas Cluster Server
11 1 (0.031%) VMware NSX
11 1 (0.031%) XenApp
Systems Management
1 99 (3.02%) Microsoft Intune
2 57 (1.74%) Kubernetes
3 43 (1.31%) Ansible
3 43 (1.31%) Single Sign-On
4 30 (0.92%) QRadar
5 29 (0.89%) SCCM
6 25 (0.76%) Terraform
7 19 (0.58%) Nessus
8 16 (0.49%) FortiGate
9 14 (0.43%) Puppet
10 12 (0.37%) Progress Chef
11 11 (0.34%) CASB
11 11 (0.34%) CSIRT
12 7 (0.21%) ZABBIX
13 6 (0.18%) BMC PATROL
13 6 (0.18%) Functional Safety
13 6 (0.18%) PaperCut
13 6 (0.18%) SCOM
14 5 (0.15%) Active Directory Federation Services
14 5 (0.15%) Autotask
Vendors
1 685 (20.92%) Microsoft
2 134 (4.09%) VMware
3 103 (3.15%) Cisco
4 77 (2.35%) Google
5 58 (1.77%) SAP
6 50 (1.53%) Tenable
7 48 (1.47%) Fortinet
8 45 (1.37%) Splunk
9 39 (1.19%) Apple
10 38 (1.16%) Adobe
11 33 (1.01%) Qualys
12 26 (0.79%) IBM
13 25 (0.76%) Oracle
13 25 (0.76%) Palo Alto
13 25 (0.76%) Salesforce
14 24 (0.73%) CrowdStrike
14 24 (0.73%) Siemens
15 19 (0.58%) ServiceNow
16 17 (0.52%) Databricks
17 15 (0.46%) Ping Identity