Senior Analyst Jobs

Senior Analyst
UK

The median Senior Analyst salary in the UK is £60,000 per year, according to job vacancies posted during the 6 months leading to 30 May 2025.

The table below provides salary benchmarking and summary statistics, comparing them to the same period in the previous two years.

6 months to
30 May 2025
Same period 2024 Same period 2023
Rank 311 179 176
Rank change year-on-year -132 -3 +116
Permanent jobs requiring a Senior Analyst 507 1,664 2,067
As % of all permanent jobs advertised in the UK 0.92% 1.61% 2.13%
As % of the Job Titles category 1.01% 1.70% 2.33%
Number of salaries quoted 315 809 791
10th Percentile £42,000 £39,164 £38,000
25th Percentile £45,748 £46,250 £44,769
Median annual salary (50th Percentile) £60,000 £57,500 £55,000
Median % change year-on-year +4.35% +4.55% -
75th Percentile £73,750 £70,000 £70,000
90th Percentile £85,000 £85,000 £85,000
UK excluding London median annual salary £49,500 £52,500 £50,000
% change year-on-year -5.71% +5.00% -

All Permanent IT Job Vacancies
UK

For comparison with the information above, the following table provides summary statistics for all permanent IT job vacancies. Most job vacancies include a discernible job title that can be normalized. As such, the figures in the second row provide an indication of the number of permanent jobs in our overall sample.

Permanent vacancies in the UK with a recognized job title 50,066 97,923 88,829
% of permanent jobs with a recognized job title 90.36% 94.81% 91.43%
Number of salaries quoted 26,124 69,761 56,179
10th Percentile £28,750 £28,500 £32,500
25th Percentile £40,750 £38,500 £45,000
Median annual salary (50th Percentile) £55,000 £52,500 £60,000
Median % change year-on-year +4.76% -12.50% -
75th Percentile £73,750 £70,000 £80,000
90th Percentile £95,000 £90,000 £100,000
UK excluding London median annual salary £51,000 £50,000 £53,500
% change year-on-year +2.00% -6.54% +6.63%

Senior Analyst
Job Vacancy Trend

Job postings that featured Senior Analyst in the job title as a proportion of all IT jobs advertised.
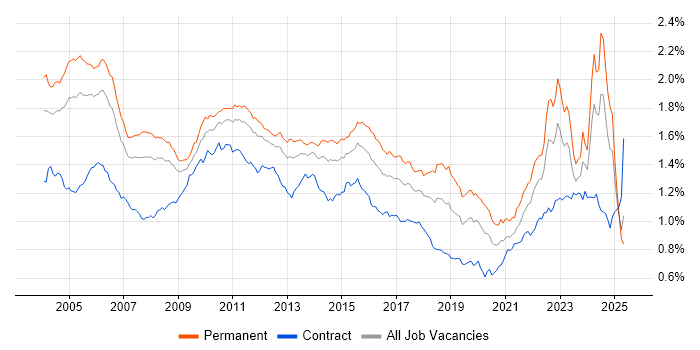
Job vacancy trend for Senior Analyst in the UK

Senior Analyst
Salary Trend

3-month moving average salary quoted in jobs citing Senior Analyst.

Salary trend for Senior Analyst in the UK

Senior Analyst
Salary Histogram

Salary distribution for jobs citing Senior Analyst over the 6 months to 30 May 2025.

Salary histogram for Senior Analyst in the UK

Senior Analyst
Top 17 Job Locations

The table below looks at the demand and provides a guide to the median salaries quoted in IT jobs citing Senior Analyst within the UK over the 6 months to 30 May 2025. The 'Rank Change' column provides an indication of the change in demand within each location based on the same 6 month period last year.

Location Rank Change
on Same Period
Last Year
Matching
Permanent
IT Job Ads
Median Salary
Past 6 Months
Median Salary
% Change
on Same Period
Last Year
Live
Jobs
England -159 454 £60,000 +4.35% 1,065
UK excluding London -114 257 £49,500 -5.71% 1,032
London -84 232 £70,000 - 192
Work from Home -158 177 £65,000 +13.04% 514
North of England -72 73 £50,000 - 198
South East -85 69 £47,500 -9.52% 348
North West -37 55 £51,250 +2.50% 88
Midlands -36 50 £48,500 -11.82% 191
Scotland +94 36 £47,500 -5.00% 39
East Midlands +3 28 £45,000 -28.00% 77
West Midlands -30 22 £50,000 -9.09% 100
Yorkshire -13 17 £47,250 -8.30% 89
South West +12 12 £48,894 -11.10% 116
East of England +19 10 £55,000 +57.14% 136
Northern Ireland +45 5 - - 13
Wales +20 2 - - 28
North East +20 1 £50,000 +42.86% 21

Senior Analyst Skill Set
Top 30 Co-occurring Skills and Capabilities

For the 6 months to 30 May 2025, Senior Analyst job roles required the following skills and capabilities in order of popularity. The figures indicate the absolute number co-occurrences and as a proportion of all permanent job ads featuring Senior Analyst in the job title.

1 214 (42.21%) Social Skills
2 176 (34.71%) SQL
3 171 (33.73%) Finance
4 137 (27.02%) Analytical Skills
5 125 (24.65%) Microsoft
6 108 (21.30%) Problem-Solving
7 106 (20.91%) Degree
8 103 (20.32%) Agile
9 99 (19.53%) Azure
10 97 (19.13%) Python
11 92 (18.15%) Analytics
12 86 (16.96%) Stakeholder Management
13 84 (16.57%) Power Platform
14 81 (15.98%) Data Analysis
15 76 (14.99%) Business Intelligence
16 72 (14.20%) Power BI
17 59 (11.64%) Banking
18 55 (10.85%) Windows
18 55 (10.85%) Visualisation
19 54 (10.65%) Mentoring
20 53 (10.45%) Retail
21 52 (10.26%) Law
21 52 (10.26%) Business Analysis
22 50 (9.86%) Requirements Gathering
23 49 (9.66%) Change Management
24 48 (9.47%) ITIL
25 47 (9.27%) Data Modelling
25 47 (9.27%) Project Management
26 44 (8.68%) Continuous Improvement
27 42 (8.28%) Microsoft 365

Senior Analyst Skill Set
Co-occurring Skills and Capabilities by Category

The follow tables expand on the table above by listing co-occurrences grouped by category. The same employment type, locality and period is covered with up to 20 co-occurrences shown in each of the following categories:

Application Platforms
1 21 (4.14%) SharePoint
2 18 (3.55%) SAS
3 17 (3.35%) Confluence
4 16 (3.16%) Microsoft Exchange
5 3 (0.59%) Cloud Foundry
5 3 (0.59%) Skype for Business
6 1 (0.20%) Apache
6 1 (0.20%) Apache Airflow
6 1 (0.20%) Apache Spark
6 1 (0.20%) Jupyter
6 1 (0.20%) Oracle Workflow
Applications
1 37 (7.30%) Microsoft Excel
2 19 (3.75%) Microsoft Office
3 17 (3.35%) MS Visio
4 9 (1.78%) Microsoft PowerPoint
5 4 (0.79%) Spreadsheet
6 1 (0.20%) Chatbot
6 1 (0.20%) Microsoft Project
Business Applications
1 16 (3.16%) OpenText VIM for SAP
1 16 (3.16%) SAP FI
2 3 (0.59%) Dynamics AX
2 3 (0.59%) Workday HCM
3 2 (0.39%) Oracle EBS
3 2 (0.39%) Oracle EBS R12
3 2 (0.39%) Oracle SCM
4 1 (0.20%) Aladdin
4 1 (0.20%) Bloomberg AIM
4 1 (0.20%) Dynamics CRM
4 1 (0.20%) Dynamics GP
4 1 (0.20%) NetSuite
4 1 (0.20%) Oracle ERP
4 1 (0.20%) SAP ERP
4 1 (0.20%) SAP GRC
4 1 (0.20%) SAP S/4HANA
4 1 (0.20%) thinkFolio
4 1 (0.20%) Unit4 Business World
Cloud Services
1 99 (19.53%) Azure
2 84 (16.57%) Power Platform
3 42 (8.28%) Microsoft 365
4 20 (3.94%) AWS
5 17 (3.35%) Dynamics 365
6 15 (2.96%) Azure Logic Apps
7 11 (2.17%) Azure Data Factory
8 9 (1.78%) Azure Sentinel
8 9 (1.78%) Entra ID
8 9 (1.78%) GCP
8 9 (1.78%) SaaS
9 6 (1.18%) Azure Monitor
10 5 (0.99%) Cloud Computing
10 5 (0.99%) GitHub
10 5 (0.99%) OneDrive
10 5 (0.99%) Snowflake
11 4 (0.79%) Miro
11 4 (0.79%) Nutanix
11 4 (0.79%) Power Automate
11 4 (0.79%) PowerApps
Communications & Networking
1 21 (4.14%) Firewall
2 16 (3.16%) Network Security
3 14 (2.76%) Broadband
4 12 (2.37%) VPN
5 7 (1.38%) DHCP
5 7 (1.38%) DNS
5 7 (1.38%) TCP/IP
6 5 (0.99%) LAN
6 5 (0.99%) WAN
7 4 (0.79%) Internet
7 4 (0.79%) VLAN
8 3 (0.59%) SAN
8 3 (0.59%) Skype
8 3 (0.59%) WebEx
9 2 (0.39%) Wi-Fi
10 1 (0.20%) Intranet
10 1 (0.20%) Intrusion Detection
10 1 (0.20%) Remote Desktop
Database & Business Intelligence
1 72 (14.20%) Power BI
2 35 (6.90%) Tableau
3 26 (5.13%) SQL Server
4 25 (4.93%) SQL Server Reporting Services
5 23 (4.54%) SQL Server Integration Services
6 18 (3.55%) DB2
7 16 (3.16%) Data Warehouse
8 10 (1.97%) Relational Database
9 6 (1.18%) Looker
10 5 (0.99%) BusinessObjects
10 5 (0.99%) Data Mining
11 4 (0.79%) Big Data
11 4 (0.79%) NoSQL
11 4 (0.79%) Oracle BI Publisher
11 4 (0.79%) Oracle Database
11 4 (0.79%) Oracle Reports
12 3 (0.59%) Azure SQL Database
12 3 (0.59%) Data Lake
13 2 (0.39%) Metadata
13 2 (0.39%) Metadata Repository
Development Applications
1 40 (7.89%) JIRA
2 19 (3.75%) Git
3 11 (2.17%) eggPlant
4 9 (1.78%) Visual Studio
5 8 (1.58%) Selenium
6 5 (0.99%) JMeter
6 5 (0.99%) TestNG
7 4 (0.79%) Burp Suite
7 4 (0.79%) Cypress.io
7 4 (0.79%) Eclipse
8 3 (0.59%) Gatling
8 3 (0.59%) Jenkins
8 3 (0.59%) JUnit
8 3 (0.59%) Postman
8 3 (0.59%) REST Assured
8 3 (0.59%) TestCafe
9 2 (0.39%) HP UFT
9 2 (0.39%) LoadRunner
9 2 (0.39%) Oracle Forms
10 1 (0.20%) Oracle APEX
General
1 214 (42.21%) Social Skills
2 171 (33.73%) Finance
3 137 (27.02%) Analytical Skills
4 59 (11.64%) Banking
5 53 (10.45%) Retail
6 52 (10.26%) Law
7 26 (5.13%) Presentation Skills
8 24 (4.73%) Inclusion and Diversity
9 23 (4.54%) Legal
10 21 (4.14%) Billing
11 17 (3.35%) Financial Institution
12 16 (3.16%) Marketing
13 14 (2.76%) Telecoms
14 12 (2.37%) Influencing Skills
14 12 (2.37%) Wholesale Banking
15 10 (1.97%) Manufacturing
16 9 (1.78%) Pharmaceutical
16 9 (1.78%) Public Sector
17 7 (1.38%) Documentation Skills
18 6 (1.18%) Advertising
Libraries, Frameworks & Software Standards
1 22 (4.34%) .NET
2 8 (1.58%) .NET Framework
2 8 (1.58%) ASP.NET
3 7 (1.38%) HTML
4 6 (1.18%) RESTful
5 4 (0.79%) Lightning Web Components
5 4 (0.79%) REST
5 4 (0.79%) XML
6 3 (0.59%) Oracle Fusion
6 3 (0.59%) React
7 2 (0.39%) Middleware
7 2 (0.39%) Playwright
8 1 (0.20%) .NET Core
8 1 (0.20%) CSS
8 1 (0.20%) EDI
8 1 (0.20%) EDIFACT
8 1 (0.20%) IDoc
8 1 (0.20%) Kafka
8 1 (0.20%) SAP Basis
8 1 (0.20%) Web Services
Miscellaneous
1 23 (4.54%) Management Information System
2 19 (3.75%) Onboarding
3 15 (2.96%) Analytical Mindset
3 15 (2.96%) Product Ownership
4 13 (2.56%) Social Media
5 11 (2.17%) Enterprise Software
6 10 (1.97%) Legacy Applications
7 9 (1.78%) PACS
7 9 (1.78%) Self-Motivation
8 7 (1.38%) Credit Risk
8 7 (1.38%) Data Protection Act
8 7 (1.38%) Security Operations Centre
9 5 (0.99%) Cyber Threat
9 5 (0.99%) NHS
10 4 (0.79%) Cloud Native
10 4 (0.79%) Data Centre
10 4 (0.79%) Derivative
10 4 (0.79%) Driving Licence
10 4 (0.79%) IoT
10 4 (0.79%) Mobile App
Operating Systems
1 55 (10.85%) Windows
2 14 (2.76%) Windows 10
3 7 (1.38%) Linux
4 6 (1.18%) Windows Server
5 5 (0.99%) Apple iOS
6 4 (0.79%) Windows Server 2012
7 1 (0.20%) AIX
7 1 (0.20%) Android
7 1 (0.20%) Unix
7 1 (0.20%) Windows Server 2016
Processes & Methodologies
1 108 (21.30%) Problem-Solving
2 103 (20.32%) Agile
3 92 (18.15%) Analytics
4 86 (16.96%) Stakeholder Management
5 81 (15.98%) Data Analysis
6 76 (14.99%) Business Intelligence
7 55 (10.85%) Visualisation
8 54 (10.65%) Mentoring
9 52 (10.26%) Business Analysis
10 50 (9.86%) Requirements Gathering
11 49 (9.66%) Change Management
12 48 (9.47%) ITIL
13 47 (9.27%) Data Modelling
13 47 (9.27%) Project Management
14 44 (8.68%) Continuous Improvement
15 41 (8.09%) Actionable Insight
16 40 (7.89%) Customer Service
17 39 (7.69%) Decision-Making
18 38 (7.50%) ERP
19 37 (7.30%) Scrum
Programming Languages
1 176 (34.71%) SQL
2 97 (19.13%) Python
3 24 (4.73%) C#
4 22 (4.34%) R
5 20 (3.94%) PL/SQL
5 20 (3.94%) T-SQL
6 18 (3.55%) VB.NET
7 13 (2.56%) JavaScript
8 12 (2.37%) Data Analysis Expressions
8 12 (2.37%) Kusto Query Language
9 10 (1.97%) Java
10 3 (0.59%) C++
10 3 (0.59%) PowerShell
10 3 (0.59%) Scala
10 3 (0.59%) VBA
11 1 (0.20%) Bash
11 1 (0.20%) F#
11 1 (0.20%) MATLAB
11 1 (0.20%) PHP
11 1 (0.20%) X++
Qualifications
1 106 (20.91%) Degree
2 35 (6.90%) DBS Check
3 20 (3.94%) Security Cleared
4 16 (3.16%) Master's Degree
5 15 (2.96%) BPSS Clearance
5 15 (2.96%) ISTQB
6 13 (2.56%) CISSP
7 11 (2.17%) CISM
7 11 (2.17%) DV Cleared
8 9 (1.78%) SC Cleared
9 8 (1.58%) ACCA
10 7 (1.38%) CIMA
10 7 (1.38%) CRISC
11 4 (0.79%) A+ Certification
11 4 (0.79%) Computer Science Degree
11 4 (0.79%) ISTQB Foundation Certification
11 4 (0.79%) OSCP
12 3 (0.59%) Cisco Certification
12 3 (0.59%) ISO 27001 Lead Implementer
12 3 (0.59%) ITIL Foundation Certificate
Quality Assurance & Compliance
1 16 (3.16%) QA
2 15 (2.96%) NIST
3 13 (2.56%) GRC
3 13 (2.56%) PMO
4 10 (1.97%) Data Quality
4 10 (1.97%) GDPR
4 10 (1.97%) ISO/IEC 27001
5 7 (1.38%) Accessibility
5 7 (1.38%) Cyber Essentials
6 5 (0.99%) Actionable Recommendations
7 4 (0.79%) COREP
7 4 (0.79%) PCI DSS
8 3 (0.59%) SLA
9 2 (0.39%) California Consumer Privacy Act
9 2 (0.39%) Cyber Essentials PLUS
9 2 (0.39%) Sarbanes-Oxley
10 1 (0.20%) AIFMD
10 1 (0.20%) IFRS
10 1 (0.20%) IFRS 9
10 1 (0.20%) Solvency II
System Software
1 23 (4.54%) Active Directory
2 13 (2.56%) VMware Infrastructure
3 9 (1.78%) Docker
4 1 (0.20%) Hyper-V
4 1 (0.20%) VMware ESXi
Systems Management
1 14 (2.76%) Microsoft Intune
2 4 (0.79%) SCCM
3 2 (0.39%) HP Quality Center
3 2 (0.39%) ITRS Geneos
3 2 (0.39%) Nagios
4 1 (0.20%) CSIRT
4 1 (0.20%) Nessus
Vendors
1 125 (24.65%) Microsoft
2 28 (5.52%) SAP
3 21 (4.14%) Databricks
4 16 (3.16%) Splunk
5 15 (2.96%) VMware
6 14 (2.76%) ServiceNow
7 12 (2.37%) Google
7 12 (2.37%) Oracle
8 11 (2.17%) Keysight
9 10 (1.97%) Cisco
10 9 (1.78%) Meraki
11 8 (1.58%) Aderant
11 8 (1.58%) Salesforce
11 8 (1.58%) SolarWinds
12 7 (1.38%) HP
13 6 (1.18%) Bloomberg
14 5 (0.99%) Alteryx
14 5 (0.99%) Workday
15 3 (0.59%) BT
15 3 (0.59%) Concur