HTML (including XHTML, DHTML & HTML5)
UK

The table below provides summary statistics for permanent job vacancies requiring HTML skills. It includes a benchmarking guide to the annual salaries offered in vacancies that cited HTML over the 6 months leading up to 26 July 2024, comparing them to the same period in the previous two years.

6 months to
26 Jul 2024
Same period 2023 Same period 2022
Rank 52 58 33
Rank change year-on-year +6 -25 -11
Permanent jobs citing HTML 3,704 4,078 14,966
As % of all permanent jobs advertised in the UK 4.10% 5.05% 8.54%
As % of the Libraries, Frameworks & Software Standards category 21.04% 18.28% 21.67%
Number of salaries quoted 2,510 3,161 6,268
10th Percentile £31,250 £34,875 £32,500
25th Percentile £38,813 £42,500 £41,250
Median annual salary (50th Percentile) £52,500 £55,000 £55,000
Median % change year-on-year -4.55% - +10.00%
75th Percentile £67,500 £75,000 £70,000
90th Percentile £81,250 £91,250 £87,500
UK excluding London median annual salary £50,000 £52,500 £50,000
% change year-on-year -4.76% +5.00% +11.11%

All Software Libraries and Frameworks
UK

HTML falls under the Software Libraries and Frameworks category. For comparison with the information above, the following table provides summary statistics for all permanent job vacancies requiring technical specification, industry standards, software libraries and framework skills.

Permanent vacancies with a requirement for technical specification, industry standards, software libraries and framework skills 17,601 22,313 69,061
As % of all permanent jobs advertised in the UK 19.48% 27.65% 39.40%
Number of salaries quoted 12,656 16,103 29,822
10th Percentile £36,750 £41,250 £38,000
25th Percentile £46,250 £51,250 £47,500
Median annual salary (50th Percentile) £60,000 £67,500 £65,000
Median % change year-on-year -11.11% +3.85% +13.04%
75th Percentile £80,000 £85,875 £83,000
90th Percentile £105,000 £106,289 £100,000
UK excluding London median annual salary £55,000 £57,500 £55,000
% change year-on-year -4.35% +4.55% +10.00%

HTML
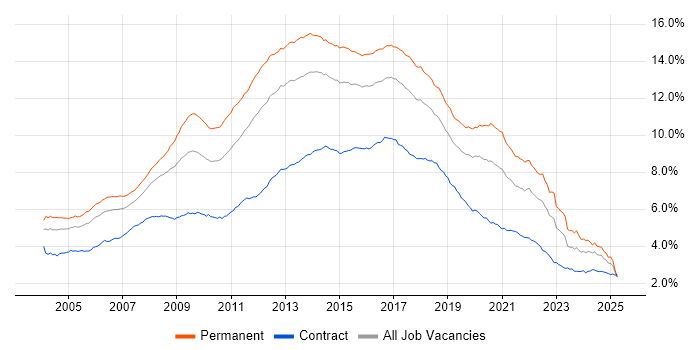
Job Vacancy Trend

Job postings citing HTML as a proportion of all IT jobs advertised.

Job vacancy trend for HTML in the UK

HTML
Salary Trend

3-month moving average salary quoted in jobs citing HTML.

Salary trend for HTML in the UK

HTML
Salary Histogram

Salary distribution for jobs citing HTML over the 6 months to 26 July 2024.

Salary histogram for HTML in the UK

HTML
Top 17 Job Locations

The table below looks at the demand and provides a guide to the median salaries quoted in IT jobs citing HTML within the UK over the 6 months to 26 July 2024. The 'Rank Change' column provides an indication of the change in demand within each location based on the same 6 month period last year.

Location Rank Change
on Same Period
Last Year
Matching
Permanent
IT Job Ads
Median Salary
Past 6 Months
Median Salary
% Change
on Same Period
Last Year
Live
Jobs
England +7 3,169 £52,500 -5.26% 524
UK excluding London +4 2,826 £50,000 -4.76% 482
Work from Home -4 1,359 £52,500 -5.26% 319
London -26 746 £65,000 -7.14% 141
South East -4 710 £52,500 -4.55% 149
North of England +15 657 £47,500 -9.52% 117
Midlands +52 475 £47,000 -10.82% 92
North West +33 449 £47,500 -5.45% 63
South West -15 325 £50,000 +5.26% 43
Scotland +12 283 £49,250 -6.19% 29
East of England +24 247 £47,500 -12.04% 52
West Midlands +16 239 £48,500 -9.94% 65
East Midlands +78 230 £44,500 -17.21% 27
Yorkshire -14 174 £45,000 -14.29% 38
Wales +3 82 £42,500 -2.86% 11
Northern Ireland +17 47 £41,750 -20.48% 18
North East -18 34 £46,968 -6.07% 18

HTML
Co-occurring Skills and Capabilities by Category

The follow tables expand on the table above by listing co-occurrences grouped by category. The same employment type, locality and period is covered with up to 20 co-occurrences shown in each of the following categories:

Application Platforms
1 223 (6.02%) CMS
2 196 (5.29%) WordPress
3 90 (2.43%) SharePoint
4 71 (1.92%) IIS
5 53 (1.43%) FileNet
6 42 (1.13%) Umbraco
7 40 (1.08%) Apache
8 38 (1.03%) nginx
9 33 (0.89%) Drupal
10 25 (0.67%) SAS
11 20 (0.54%) Confluence
12 17 (0.46%) Cloud Foundry
13 14 (0.38%) Apache Solr
14 12 (0.32%) Microsoft Exchange
15 11 (0.30%) Headless CMS
16 10 (0.27%) ArcGIS
17 8 (0.22%) JBoss
17 8 (0.22%) Moodle
18 6 (0.16%) WinCC
19 5 (0.13%) ThingWorx
Applications
1 70 (1.89%) Sketch
2 49 (1.32%) Adobe XD
2 49 (1.32%) Photoshop
3 47 (1.27%) Microsoft Excel
4 40 (1.08%) Microsoft Office
5 36 (0.97%) Adobe Creative Suite
6 26 (0.70%) Adobe Illustrator
7 20 (0.54%) Microsoft PowerPoint
8 12 (0.32%) InVision
9 11 (0.30%) InfoPath
10 10 (0.27%) Adobe After Effects
10 10 (0.27%) Trello
11 9 (0.24%) Adobe Captivate
12 7 (0.19%) MS Visio
13 6 (0.16%) MadCap Flare
13 6 (0.16%) RoboHelp
14 5 (0.13%) Adobe Premiere
15 4 (0.11%) InDesign
16 3 (0.081%) SPSS
17 2 (0.054%) Acrobat
Business Applications
1 55 (1.48%) Shopify
2 49 (1.32%) Magento
3 41 (1.11%) Dynamics CRM
4 37 (1.00%) SDL Web 8
5 18 (0.49%) Remedy ITSM
6 16 (0.43%) Salesforce CRM
7 14 (0.38%) Adobe Campaign
7 14 (0.38%) Payment Gateway
8 11 (0.30%) NEC Housing
8 11 (0.30%) Sage 200
9 7 (0.19%) Teamcenter
10 6 (0.16%) Sage 50
10 6 (0.16%) SAP ERP
10 6 (0.16%) SAP SD
11 5 (0.13%) NetSuite
12 3 (0.081%) Dynamics NAV
13 2 (0.054%) CiviCRM
13 2 (0.054%) SAP MII
14 1 (0.027%) Elite 3E
14 1 (0.027%) R3 Corda
Cloud Services
1 1,100 (29.70%) Azure
2 526 (14.20%) AWS
3 350 (9.45%) Azure DevOps
4 265 (7.15%) IBM Cloud
5 206 (5.56%) Serverless
6 173 (4.67%) GitHub
7 165 (4.45%) Azure Service Bus
8 156 (4.21%) Power Platform
9 155 (4.18%) Azure Functions
9 155 (4.18%) SaaS
10 143 (3.86%) Azure Logic Apps
11 129 (3.48%) Azure API Management
12 127 (3.43%) Figma
13 76 (2.05%) Amazon S3
14 69 (1.86%) GCP
15 68 (1.84%) Power Automate
16 67 (1.81%) Microsoft 365
17 66 (1.78%) Google Analytics
18 61 (1.65%) Dynamics 365
18 61 (1.65%) PowerApps
Communications & Networking
1 56 (1.51%) HTTP
2 55 (1.48%) Internet
3 49 (1.32%) DNS
4 47 (1.27%) TCP/IP
5 43 (1.16%) Firewall
6 40 (1.08%) SSL
7 25 (0.67%) WAN
8 21 (0.57%) MQTT
9 19 (0.51%) FTP
9 19 (0.51%) Wireless
10 18 (0.49%) Network Security
10 18 (0.49%) VPN
11 16 (0.43%) LAN
12 15 (0.40%) Intranet
12 15 (0.40%) Wi-Fi
13 9 (0.24%) HTTPS
13 9 (0.24%) SNMP
14 8 (0.22%) NGN
14 8 (0.22%) TACACS
15 7 (0.19%) IPsec
Database & Business Intelligence
1 720 (19.44%) SQL Server
2 428 (11.56%) MySQL
3 397 (10.72%) PostgreSQL
4 382 (10.31%) NoSQL
5 329 (8.88%) MongoDB
6 294 (7.94%) Relational Database
7 252 (6.80%) DB2
8 104 (2.81%) Elasticsearch
9 93 (2.51%) Power BI
10 59 (1.59%) Azure SQL Database
11 54 (1.46%) Apache Cassandra
12 42 (1.13%) Tableau
13 37 (1.00%) SQL Server Reporting Services
14 34 (0.92%) GIS
15 30 (0.81%) Redis
16 27 (0.73%) Oracle Database
17 23 (0.62%) Data Warehouse
18 19 (0.51%) Geospatial Data
19 18 (0.49%) SQL Server Integration Services
20 17 (0.46%) Amazon RDS
Development Applications
1 747 (20.17%) Git
2 233 (6.29%) JIRA
3 170 (4.59%) Visual Studio
4 159 (4.29%) JUnit
5 128 (3.46%) Cypress.io
6 112 (3.02%) Selenium
7 83 (2.24%) Jenkins
8 73 (1.97%) Jasmine
9 63 (1.70%) Protractor
10 62 (1.67%) Karma Test Runner
10 62 (1.67%) WebDriver
11 61 (1.65%) Team Foundation Server
12 54 (1.46%) TeamCity
13 51 (1.38%) GitLab
14 50 (1.35%) NUnit
15 45 (1.21%) Moq
15 45 (1.21%) webpack
16 41 (1.11%) Visual Studio Code
17 34 (0.92%) Octopus Deploy
18 26 (0.70%) gulp
General
1 898 (24.24%) Social Skills
2 551 (14.88%) Finance
3 447 (12.07%) Inclusion and Diversity
4 399 (10.77%) Marketing
5 374 (10.10%) Public Sector
6 313 (8.45%) Law
7 206 (5.56%) Analytical Skills
8 175 (4.72%) Legal
9 139 (3.75%) Retail
10 134 (3.62%) Banking
11 98 (2.65%) Investment Banking
12 76 (2.05%) Games
13 64 (1.73%) Advertising
14 63 (1.70%) Manufacturing
15 53 (1.43%) Organisational Skills
16 51 (1.38%) Automotive
17 43 (1.16%) Electronics
18 37 (1.00%) Telecoms
19 36 (0.97%) Multimedia
20 32 (0.86%) Presentation Skills
Job Titles
1 2,359 (63.69%) Developer
2 732 (19.76%) Senior
3 501 (13.53%) Full Stack Developer
4 471 (12.72%) Senior Developer
5 457 (12.34%) .NET Developer
6 360 (9.72%) Software Engineer
7 300 (8.10%) Lead
8 291 (7.86%) PHP Developer
9 264 (7.13%) Software Developer
10 259 (6.99%) Full Stack Engineer
11 248 (6.70%) C# Developer
12 226 (6.10%) Web Developer
13 204 (5.51%) Front-End Developer (Client-Side Developer)
14 161 (4.35%) Azure Developer
15 154 (4.16%) C# .NET Developer
16 143 (3.86%) Designer
17 132 (3.56%) Java Engineer
18 126 (3.40%) Java Software Engineer
19 112 (3.02%) Azure Engineer
20 107 (2.89%) Consultant
Libraries, Frameworks & Software Standards
1 3,017 (81.45%) CSS
2 1,419 (38.31%) .NET
3 1,299 (35.07%) React
4 1,009 (27.24%) AngularJS
5 848 (22.89%) jQuery
6 820 (22.14%) ASP.NET
7 769 (20.76%) HTML5
8 652 (17.60%) Twitter Bootstrap
9 605 (16.33%) Web Services
10 578 (15.60%) Vue
11 568 (15.33%) Node.js
12 556 (15.01%) REST
13 419 (11.31%) JSON
14 415 (11.20%) RESTful
15 385 (10.39%) CSS3
16 372 (10.04%) .NET Core
17 335 (9.04%) .NET Framework
18 317 (8.56%) XML
19 286 (7.72%) ASP.NET Core
19 286 (7.72%) Laravel
Miscellaneous
1 370 (9.99%) Algorithms
2 356 (9.61%) Data Structures
3 270 (7.29%) Hybrid Cloud
4 269 (7.26%) Blockchain
5 140 (3.78%) e-Learning
6 117 (3.16%) Mobile App
7 115 (3.10%) Self-Motivation
8 114 (3.08%) Greenfield Project
9 111 (3.00%) Cloud Native
9 111 (3.00%) Product Ownership
10 78 (2.11%) Legacy Systems
11 77 (2.08%) Onboarding
12 59 (1.59%) IoT
13 56 (1.51%) Legacy Code
14 53 (1.43%) Social Media
15 49 (1.32%) Management Information System
16 44 (1.19%) CMDB
17 39 (1.05%) NHS
18 35 (0.94%) Enterprise Software
19 32 (0.86%) Graphic Design
Operating Systems
1 503 (13.58%) Linux
2 413 (11.15%) Windows
3 292 (7.88%) Android
4 279 (7.53%) Apple iOS
5 18 (0.49%) Unix
5 18 (0.49%) Windows Server
6 12 (0.32%) Ubuntu
7 9 (0.24%) VMS
7 9 (0.24%) Windows Server 2019
8 6 (0.16%) Red Hat Enterprise Linux
9 5 (0.13%) AIX
10 3 (0.081%) CentOS
11 2 (0.054%) Mac OS X
12 1 (0.027%) Embedded Linux
12 1 (0.027%) Kali Linux
12 1 (0.027%) Mac OS
12 1 (0.027%) VxWorks
Processes & Methodologies
1 1,305 (35.23%) Agile
2 1,229 (33.18%) Full Stack Development
3 896 (24.19%) Web Development
4 843 (22.76%) Problem-Solving
5 816 (22.03%) MVC
6 761 (20.55%) User Experience
7 635 (17.14%) DevOps
8 632 (17.06%) Software Engineering
9 555 (14.98%) Artificial Intelligence
10 515 (13.90%) OO
11 460 (12.42%) Computer Science
12 458 (12.37%) Front End Development
13 450 (12.15%) OOP
14 438 (11.83%) Design Patterns
15 429 (11.58%) Mentoring
16 417 (11.26%) CI/CD
17 341 (9.21%) Responsive Web Design
18 338 (9.13%) SOLID
19 324 (8.75%) E-Commerce
20 303 (8.18%) SDLC
Programming Languages
1 2,927 (79.02%) JavaScript
2 1,483 (40.04%) C#
3 1,321 (35.66%) SQL
4 675 (18.22%) Java
5 627 (16.93%) PHP
6 623 (16.82%) TypeScript
7 544 (14.69%) Python
8 166 (4.48%) T-SQL
9 100 (2.70%) C++
10 91 (2.46%) C
11 83 (2.24%) PowerShell
12 61 (1.65%) VB.NET
13 41 (1.11%) Ruby
14 39 (1.05%) VB
15 37 (1.00%) Bash
15 37 (1.00%) PL/SQL
16 32 (0.86%) Go
17 29 (0.78%) VBA
17 29 (0.78%) XPath
18 28 (0.76%) Apex Code
Qualifications
1 708 (19.11%) Degree
2 236 (6.37%) Computer Science Degree
3 171 (4.62%) Security Cleared
4 111 (3.00%) SC Cleared
5 45 (1.21%) Microsoft Certification
6 40 (1.08%) Master's Degree
7 37 (1.00%) BPSS Clearance
8 30 (0.81%) DV Cleared
9 15 (0.40%) CISSP
9 15 (0.40%) DBS Check
10 11 (0.30%) CIPD
11 10 (0.27%) Azure Certification
12 7 (0.19%) CCNA
12 7 (0.19%) Cisco Certification
13 6 (0.16%) HND
13 6 (0.16%) PhD
13 6 (0.16%) Postgraduate
14 5 (0.13%) MCAD
15 4 (0.11%) CTC Cleared
15 4 (0.11%) ITIL Certification
Quality Assurance & Compliance
1 257 (6.94%) Accessibility
2 150 (4.05%) QA
3 118 (3.19%) WCAG
4 39 (1.05%) GDPR
5 33 (0.89%) SLA
6 12 (0.32%) Data Quality
7 9 (0.24%) ISO 9001
7 9 (0.24%) MiFID
8 6 (0.16%) IEC 61131
8 6 (0.16%) PMO
9 5 (0.13%) ISO/IEC 27001
10 4 (0.11%) EMIR
10 4 (0.11%) GRC
11 3 (0.081%) HIPAA
12 2 (0.054%) Cyber Essentials
12 2 (0.054%) Sarbanes-Oxley
13 1 (0.027%) Def Stans
13 1 (0.027%) HL7
13 1 (0.027%) IEC 61508
13 1 (0.027%) WAI
System Software
1 211 (5.70%) Docker
2 22 (0.59%) Active Directory
3 10 (0.27%) Firmware
4 7 (0.19%) VMware Infrastructure
5 6 (0.16%) Virtual Desktop
6 5 (0.13%) VMware ESXi
7 4 (0.11%) Hyper-V
7 4 (0.11%) Virtual Machines
8 3 (0.081%) KVM
9 2 (0.054%) Terminal Services
9 2 (0.054%) VMware Server
10 1 (0.027%) GlusterFS
Systems Management
1 190 (5.13%) Kubernetes
2 33 (0.89%) Terraform
3 27 (0.73%) Single Sign-On
4 20 (0.54%) Ansible
5 17 (0.46%) Progress Chef
5 17 (0.46%) Puppet
6 10 (0.27%) Kibana
6 10 (0.27%) MIIS
7 6 (0.16%) Active Directory Federation Services
7 6 (0.16%) cPanel
7 6 (0.16%) Nagios
7 6 (0.16%) Plesk
8 5 (0.13%) CloudHub
9 3 (0.081%) Grafana
9 3 (0.081%) Istio
10 2 (0.054%) Matomo
10 2 (0.054%) Microsoft Intune
10 2 (0.054%) Prometheus
10 2 (0.054%) Rancher
10 2 (0.054%) WMI
Vendors
1 420 (11.34%) Microsoft
2 272 (7.34%) Red Hat
3 265 (7.15%) IBM
4 170 (4.59%) Adobe
5 156 (4.21%) Oracle
6 142 (3.83%) Google
7 87 (2.35%) ServiceNow
8 72 (1.94%) Salesforce
9 36 (0.97%) WooCommerce
10 35 (0.94%) SAP
11 29 (0.78%) Atlassian
11 29 (0.78%) Facebook
12 26 (0.70%) Splunk
12 26 (0.70%) VMware
13 24 (0.65%) HP
14 21 (0.57%) OpenAI
15 19 (0.51%) Xamarin
16 18 (0.49%) BMC
16 18 (0.49%) Cognizant
16 18 (0.49%) Remedy