Payment Card Industry Data Security Standard (PCI DSS)
UK

The table below provides summary statistics for permanent job vacancies requiring PCI DSS skills. It includes a benchmarking guide to the annual salaries offered in vacancies that cited PCI DSS over the 6 months leading up to 30 April 2025, comparing them to the same period in the previous two years.

6 months to
30 Apr 2025
Same period 2024 Same period 2023
Rank 453 564 480
Rank change year-on-year +111 -84 +100
Permanent jobs citing PCI DSS 240 345 639
As % of all permanent jobs advertised in the UK 0.46% 0.35% 0.61%
As % of the Quality Assurance & Compliance category 2.71% 2.55% 3.20%
Number of salaries quoted 169 277 423
10th Percentile £41,850 £24,807 £32,500
25th Percentile £52,500 £43,750 £42,500
Median annual salary (50th Percentile) £70,000 £62,500 £59,500
Median % change year-on-year +12.00% +5.04% -0.83%
75th Percentile £98,474 £82,500 £80,000
90th Percentile £120,000 £92,500 £92,500
UK excluding London median annual salary £57,500 £53,500 £52,500
% change year-on-year +7.48% +1.90% -6.67%

All Quality Assurance and Compliance Skills
UK

PCI DSS falls under the Quality Assurance and Compliance category. For comparison with the information above, the following table provides summary statistics for all permanent job vacancies requiring quality assurance or compliance skills.

Permanent vacancies with a requirement for quality assurance or compliance skills 8,850 13,541 19,961
As % of all permanent jobs advertised in the UK 16.97% 13.77% 19.19%
Number of salaries quoted 4,598 9,268 9,195
10th Percentile £31,250 £27,000 £32,000
25th Percentile £42,500 £36,250 £42,500
Median annual salary (50th Percentile) £60,000 £52,500 £57,500
Median % change year-on-year +14.29% -8.70% +4.55%
75th Percentile £73,750 £70,000 £76,250
90th Percentile £90,000 £90,000 £93,750
UK excluding London median annual salary £55,000 £47,500 £50,000
% change year-on-year +15.79% -5.00% +5.04%

PCI DSS
Job Vacancy Trend

Job postings citing PCI DSS as a proportion of all IT jobs advertised.
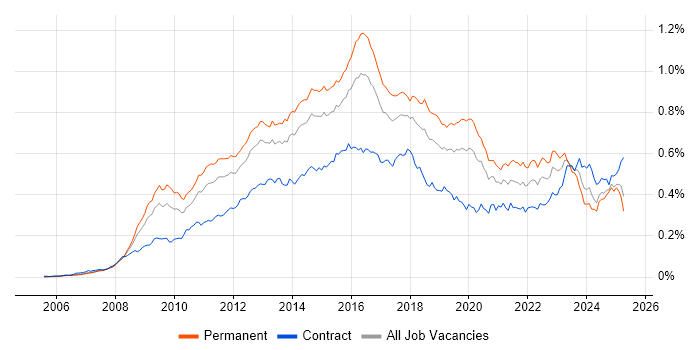
Job vacancy trend for PCI DSS in the UK

PCI DSS
Salary Trend

3-month moving average salary quoted in jobs citing PCI DSS.

Salary trend for PCI DSS in the UK

PCI DSS
Salary Histogram

Salary distribution for jobs citing PCI DSS over the 6 months to 30 April 2025.

Salary histogram for PCI DSS in the UK

PCI DSS
Top 17 Job Locations

The table below looks at the demand and provides a guide to the median salaries quoted in IT jobs citing PCI DSS within the UK over the 6 months to 30 April 2025. The 'Rank Change' column provides an indication of the change in demand within each location based on the same 6 month period last year.

Location Rank Change
on Same Period
Last Year
Matching
Permanent
IT Job Ads
Median Salary
Past 6 Months
Median Salary
% Change
on Same Period
Last Year
Live
Jobs
England +94 212 £70,750 +13.20% 172
UK excluding London +123 131 £57,500 +7.48% 103
London +84 89 £87,500 +20.69% 76
Work from Home +141 85 £72,246 +25.64% 92
South East +111 41 £65,000 -10.34% 26
North of England +61 41 £61,250 +25.00% 36
North West +8 20 £65,000 +44.44% 22
South West +98 16 £60,000 +33.33% 8
Yorkshire +68 16 £70,000 +27.27% 9
Midlands +27 12 £40,000 -25.23% 12
Scotland +126 11 £40,000 +61.22% 9
East Midlands +25 7 £40,000 +61.22% 4
North East +56 5 £57,500 +53.33% 5
East of England +45 5 £75,000 +205.80% 10
West Midlands +42 5 £40,000 -48.39% 8
Northern Ireland - 4 £35,000 -
Wales +40 1 £58,500 +11.43% 2

PCI DSS
Co-occurring Skills and Capabilities by Category

The follow tables expand on the table above by listing co-occurrences grouped by category. The same employment type, locality and period is covered with up to 20 co-occurrences shown in each of the following categories:

Application Platforms
1 8 (3.33%) IBM Domino
2 7 (2.92%) SAS
3 6 (2.50%) Apache Spark
3 6 (2.50%) SharePoint
4 5 (2.08%) Microsoft Exchange
5 2 (0.83%) IIS
6 1 (0.42%) Confluence
Applications
1 16 (6.67%) Microsoft Office
2 9 (3.75%) Acrobat
3 1 (0.42%) Microsoft Excel
Business Applications
1 2 (0.83%) Dynamics CRM
1 2 (0.83%) Payment Gateway
2 1 (0.42%) SAP CO
2 1 (0.42%) SAP FI
2 1 (0.42%) SAP FI/CO
Cloud Services
1 93 (38.75%) Azure
2 53 (22.08%) AWS
3 39 (16.25%) Microsoft 365
4 34 (14.17%) GCP
5 11 (4.58%) SaaS
6 10 (4.17%) Azure DevOps
6 10 (4.17%) Google Workspace
7 8 (3.33%) AWS CloudFormation
7 8 (3.33%) GitHub
7 8 (3.33%) GitHub Actions
8 6 (2.50%) Amazon EMR
8 6 (2.50%) Amazon SageMaker
8 6 (2.50%) Azure AKS
8 6 (2.50%) Cloud Computing
8 6 (2.50%) OneDrive
8 6 (2.50%) Power Platform
8 6 (2.50%) Snowflake
9 5 (2.08%) Cloudflare
9 5 (2.08%) Entra ID
10 4 (1.67%) Datadog
Communications & Networking
1 48 (20.00%) Firewall
2 39 (16.25%) Network Security
3 23 (9.58%) VPN
4 12 (5.00%) Wireless
5 10 (4.17%) LAN
5 10 (4.17%) WAN
6 9 (3.75%) Intranet
6 9 (3.75%) SD-WAN
6 9 (3.75%) Wi-Fi
7 8 (3.33%) DNS
7 8 (3.33%) Intrusion Detection
7 8 (3.33%) MPLS
8 7 (2.92%) IPsec
9 5 (2.08%) BGP
9 5 (2.08%) DHCP
9 5 (2.08%) OSPF
9 5 (2.08%) SSL
9 5 (2.08%) VLAN
10 4 (1.67%) EIGRP
10 4 (1.67%) TCP/IP
Database & Business Intelligence
1 16 (6.67%) NoSQL
1 16 (6.67%) Tableau
2 7 (2.92%) SQL Server
3 6 (2.50%) Azure SQL Database
4 4 (1.67%) MongoDB
4 4 (1.67%) Power BI
5 3 (1.25%) MS Access
5 3 (1.25%) SQL Server Integration Services
6 2 (0.83%) Amazon RDS
6 2 (0.83%) DynamoDB
6 2 (0.83%) MySQL
6 2 (0.83%) Relational Database
7 1 (0.42%) Amazon Athena
7 1 (0.42%) Amazon Aurora
7 1 (0.42%) Data Lake
7 1 (0.42%) Data Warehouse
7 1 (0.42%) Elasticsearch
7 1 (0.42%) MariaDB
7 1 (0.42%) OLAP
7 1 (0.42%) OLTP
Development Applications
1 6 (2.50%) GitLab
1 6 (2.50%) JIRA
2 3 (1.25%) Jenkins
3 2 (0.83%) ERwin
4 1 (0.42%) Bitbucket
4 1 (0.42%) Burp Suite
4 1 (0.42%) Git
4 1 (0.42%) Metasploit
4 1 (0.42%) Selenium
4 1 (0.42%) Team Foundation Server
General
1 119 (49.58%) Social Skills
2 72 (30.00%) Finance
3 52 (21.67%) Analytical Skills
4 36 (15.00%) Retail
5 32 (13.33%) Legal
6 24 (10.00%) Influencing Skills
7 21 (8.75%) Inclusion and Diversity
8 13 (5.42%) Marketing
9 11 (4.58%) Banking
10 10 (4.17%) Law
10 10 (4.17%) Presentation Skills
11 4 (1.67%) Documentation Skills
11 4 (1.67%) Organisational Skills
11 4 (1.67%) Telecoms
12 3 (1.25%) Advertising
12 3 (1.25%) Brand Awareness
12 3 (1.25%) Local Government
13 2 (0.83%) Aviation
13 2 (0.83%) Manufacturing
13 2 (0.83%) Public Sector
Job Titles
1 39 (16.25%) Analyst
2 38 (15.83%) Senior
3 35 (14.58%) Lead
3 35 (14.58%) Security Analyst
4 28 (11.67%) Architect
5 19 (7.92%) Security Engineer
5 19 (7.92%) Security Manager
6 16 (6.67%) Information Analyst
7 15 (6.25%) Head of Security
7 15 (6.25%) Lead Architect
8 14 (5.83%) Information Security Analyst
9 13 (5.42%) Information Manager
9 13 (5.42%) Information Security Manager
10 12 (5.00%) Head of Information
10 12 (5.00%) Head of Information Security
11 11 (4.58%) Cloud Engineer
12 10 (4.17%) Consultant
12 10 (4.17%) Solutions Architect
13 9 (3.75%) Compliance Advisor
13 9 (3.75%) Security Advisor
Libraries, Frameworks & Software Standards
1 14 (5.83%) .NET
2 11 (4.58%) Azure Blueprints
3 7 (2.92%) EDI
4 6 (2.50%) Kafka
5 5 (2.08%) LDAP
5 5 (2.08%) Node.js
6 4 (1.67%) AngularJS
7 2 (0.83%) CSS
7 2 (0.83%) HTML
7 2 (0.83%) RESTful
7 2 (0.83%) SOAP
8 1 (0.42%) AWS CDK
8 1 (0.42%) JSON
8 1 (0.42%) JWT
8 1 (0.42%) ModSecurity
8 1 (0.42%) OAuth
8 1 (0.42%) OAuth2
8 1 (0.42%) REST
8 1 (0.42%) Spring
8 1 (0.42%) XML
Miscellaneous
1 51 (21.25%) Management Information System
2 40 (16.67%) Security Posture
3 18 (7.50%) Cyber Threat
4 14 (5.83%) Data Centre
5 11 (4.58%) Data Protection Act
6 10 (4.17%) e-Learning
7 9 (3.75%) Cloud Native
7 9 (3.75%) Product Ownership
8 8 (3.33%) Analytical Mindset
8 8 (3.33%) Distributed Systems
9 7 (2.92%) Credit Risk
9 7 (2.92%) Market Risk
9 7 (2.92%) Replication
10 6 (2.50%) Onboarding
11 3 (1.25%) Cyber Security Posture
11 3 (1.25%) Cyberattack
11 3 (1.25%) Greenfield Project
11 3 (1.25%) Self-Motivation
11 3 (1.25%) Social Media
11 3 (1.25%) SWIFT Messaging Network
Operating Systems
1 18 (7.50%) Windows
2 13 (5.42%) Windows Server
3 8 (3.33%) Linux
4 6 (2.50%) Windows Server 2019
5 5 (2.08%) VMS
6 4 (1.67%) Windows Server 2016
7 3 (1.25%) Unix
8 2 (0.83%) Mac OS
8 2 (0.83%) Windows 10
8 2 (0.83%) Windows Server 2012
9 1 (0.42%) Kali Linux
Processes & Methodologies
1 107 (44.58%) Information Security
2 80 (33.33%) Cybersecurity
3 76 (31.67%) Risk Management
4 50 (20.83%) Incident Response
5 47 (19.58%) Agile
5 47 (19.58%) Continuous Improvement
6 45 (18.75%) Cloud Security
7 42 (17.50%) Problem-Solving
8 41 (17.08%) Roadmaps
9 40 (16.67%) DevOps
9 40 (16.67%) Vulnerability Management
10 39 (16.25%) Data Protection
11 37 (15.42%) CI/CD
11 37 (15.42%) Security Operations
12 36 (15.00%) Vulnerability Scanning
13 35 (14.58%) Data Security
14 34 (14.17%) Security Management
15 29 (12.08%) Identity Access Management
15 29 (12.08%) Penetration Testing
15 29 (12.08%) Security Architecture
Programming Languages
1 36 (15.00%) Python
2 26 (10.83%) PowerShell
3 18 (7.50%) Bash
4 17 (7.08%) SQL
5 8 (3.33%) C#
5 8 (3.33%) R
6 7 (2.92%) Java
7 6 (2.50%) TypeScript
8 5 (2.08%) Kusto Query Language
9 3 (1.25%) JavaScript
10 2 (0.83%) Data Analysis Expressions
11 1 (0.42%) Bicep
11 1 (0.42%) Go
11 1 (0.42%) T-SQL
11 1 (0.42%) VBA
Qualifications
1 54 (22.50%) CISSP
2 44 (18.33%) CISM
3 29 (12.08%) Degree
4 17 (7.08%) CRISC
5 16 (6.67%) Cisco Certification
6 11 (4.58%) CEH
7 10 (4.17%) Computer Science Degree
8 9 (3.75%) (ISC)2 CCSP
8 9 (3.75%) CISA
9 8 (3.33%) AWS Certification
9 8 (3.33%) CCSP
9 8 (3.33%) CompTIA CySA+
10 7 (2.92%) CompTIA Security+
10 7 (2.92%) CREST Certified
10 7 (2.92%) Microsoft Certification
10 7 (2.92%) Security Cleared
11 6 (2.50%) CISMP
12 5 (2.08%) CCNP
12 5 (2.08%) OSCP
13 4 (1.67%) CCNA
Quality Assurance & Compliance
1 133 (55.42%) GDPR
2 122 (50.83%) ISO/IEC 27001
3 98 (40.83%) NIST
4 58 (24.17%) Cyber Essentials
5 41 (17.08%) GRC
6 29 (12.08%) Sarbanes-Oxley
7 27 (11.25%) Cyber Essentials PLUS
8 19 (7.92%) California Consumer Privacy Act
9 11 (4.58%) Data Quality
10 10 (4.17%) NCSC
11 9 (3.75%) PERC
11 9 (3.75%) SOC 2
12 8 (3.33%) QA
13 7 (2.92%) Basel II
13 7 (2.92%) Basel III
13 7 (2.92%) Dodd-Frank
13 7 (2.92%) IFRS
13 7 (2.92%) IFRS 9
14 6 (2.50%) COBIT
15 5 (2.08%) ISO 9001
System Software
1 13 (5.42%) Active Directory
2 8 (3.33%) Hyper-V
3 6 (2.50%) Virtual Machines
4 4 (1.67%) Docker
5 3 (1.25%) vSphere
6 2 (0.83%) Virtual Desktop
6 2 (0.83%) VMware Infrastructure
7 1 (0.42%) NFS
7 1 (0.42%) Squid
7 1 (0.42%) VMware NSX
Systems Management
1 23 (9.58%) Terraform
2 21 (8.75%) Kubernetes
3 11 (4.58%) CASB
4 6 (2.50%) Ansible
5 5 (2.08%) Istio
5 5 (2.08%) linkerd
6 4 (1.67%) Dell DRAC
6 4 (1.67%) Grafana
6 4 (1.67%) Progress Chef
6 4 (1.67%) Prometheus
7 3 (1.25%) EMC VPLEX
7 3 (1.25%) Nessus
8 2 (0.83%) Microsoft Intune
9 1 (0.42%) Cisco CUCM
9 1 (0.42%) cPanel
9 1 (0.42%) Kibana
9 1 (0.42%) OpenVAS
9 1 (0.42%) SCCM
9 1 (0.42%) Single Sign-On
Vendors
1 50 (20.83%) Microsoft
2 25 (10.42%) Google
3 12 (5.00%) Adobe
3 12 (5.00%) Cisco
4 9 (3.75%) Informatica
4 9 (3.75%) OneTrust
5 7 (2.92%) SolarWinds
6 4 (1.67%) Palo Alto
7 3 (1.25%) CrowdStrike
7 3 (1.25%) dotdigital
7 3 (1.25%) EMC
7 3 (1.25%) Facebook
7 3 (1.25%) Fortinet
7 3 (1.25%) Juniper
7 3 (1.25%) Meraki
7 3 (1.25%) Nimble Storage
7 3 (1.25%) Oracle
7 3 (1.25%) ServiceNow
7 3 (1.25%) Splunk
7 3 (1.25%) Veeam