JSON
UK

The following table provides summary statistics for permanent job vacancies with a requirement for JSON skills. Included is a benchmarking guide to the salaries offered in vacancies that have cited JSON over the 6 months to 10 December 2023 with a comparison to the same period in the previous 2 years.

6 months to
10 Dec 2023
Same period 2022 Same period 2021
Rank 211 239 189
Rank change year-on-year +28 -50 -31
Permanent jobs citing JSON 882 1,904 2,588
As % of all permanent jobs advertised in the UK 1.69% 1.56% 2.04%
As % of the Libraries, Frameworks & Software Standards category 6.42% 4.81% 5.32%
Number of salaries quoted 671 1,260 1,667
10th Percentile £43,750 £45,000 £36,124
25th Percentile £52,500 £52,500 £45,000
Median annual salary (50th Percentile) £65,000 £69,447 £60,000
Median % change year-on-year -6.40% +15.75% +9.09%
75th Percentile £85,000 £90,000 £72,500
90th Percentile £106,250 £103,750 £89,250
UK excluding London median annual salary £60,000 £59,500 £54,000
% change year-on-year +0.84% +10.19% +13.68%

All Software Libraries and Frameworks
UK

JSON is in the Software Libraries and Frameworks category. The following table is for comparison with the above and provides summary statistics for all permanent job vacancies with a requirement for technical specification, industry standards, software libraries and framework skills.

Permanent vacancies with a requirement for technical specification, industry standards, software libraries and framework skills 13,739 39,611 48,676
As % of all permanent jobs advertised in the UK 26.28% 32.41% 38.30%
Number of salaries quoted 10,720 24,123 32,015
10th Percentile £41,250 £40,000 £36,750
25th Percentile £51,250 £50,000 £45,000
Median annual salary (50th Percentile) £65,351 £65,000 £60,000
Median % change year-on-year +0.54% +8.33% +4.35%
75th Percentile £85,000 £86,250 £80,000
90th Percentile £106,289 £105,000 £96,250
UK excluding London median annual salary £57,500 £57,500 £52,500
% change year-on-year - +9.52% +5.00%

JSON
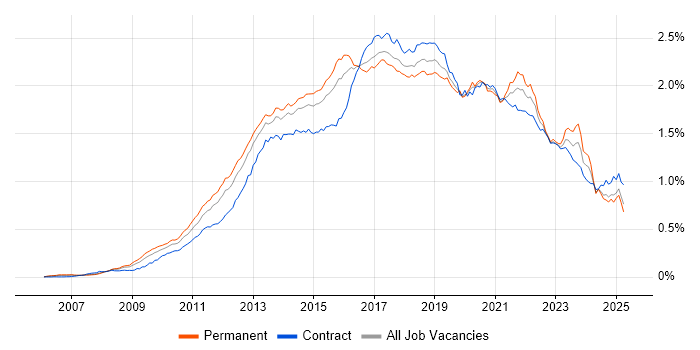
Job Vacancy Trend

Job postings citing JSON as a proportion of all IT jobs advertised.

Job vacancy trend for JSON in the UK

JSON
Salary Trend

3-month moving average salary quoted in jobs citing JSON.

Salary trend for JSON in the UK

JSON
Salary Histogram

Salary distribution for jobs citing JSON over the 6 months to 10 December 2023.

Salary histogram for JSON in the UK

JSON
Top 17 Job Locations

The table below looks at the demand and provides a guide to the median salaries quoted in IT jobs citing JSON within the UK over the 6 months to 10 December 2023. The 'Rank Change' column provides an indication of the change in demand within each location based on the same 6 month period last year.

Location Rank Change
on Same Period
Last Year
Matching
Permanent
IT Job Ads
Median Salary
Past 6 Months
Median Salary
% Change
on Same Period
Last Year
Live
Jobs
England +35 770 £65,351 -6.64% 266
UK excluding London +67 471 £60,000 +0.84% 168
Work from Home +40 404 £62,500 -7.41% 149
London +9 347 £80,000 -3.03% 123
South East +102 105 £52,500 -16.00% 36
North of England +76 95 £60,000 +4.35% 34
South West -3 74 £57,500 -10.09% 18
East of England +120 63 £60,000 +14.29% 34
North West +80 61 £57,500 +4.55% 23
Midlands +108 59 £58,750 +2.17% 20
Scotland -11 47 £60,000 -4.32% 12
East Midlands +63 33 £60,000 +9.09% 1
Yorkshire +61 33 £70,576 +11.58% 9
West Midlands +92 26 £41,250 -30.67% 19
Northern Ireland +42 19 £87,500 +80.41% 7
Wales +10 19 £47,500 -13.64% 10
North East +33 1 £45,000 +2.33% 2

JSON
Co-occurring Skills and Capabilities by Category

The follow tables expand on the table above by listing co-occurrences grouped by category. The same employment type, locality and period is covered with up to 20 co-occurrences shown in each of the following categories:

Application Platforms
1 89 (10.09%) JBoss
2 85 (9.64%) Red Hat Fuse
3 31 (3.51%) Confluence
4 27 (3.06%) SharePoint
5 21 (2.38%) Apache Spark
6 20 (2.27%) IIS
7 15 (1.70%) Tomcat
8 10 (1.13%) OpenStack
9 9 (1.02%) NServiceBus
10 8 (0.91%) Anypoint
10 8 (0.91%) Jetty
10 8 (0.91%) Oracle SOA Suite
11 6 (0.68%) Apache
11 6 (0.68%) Mendix
11 6 (0.68%) Oracle Workflow
11 6 (0.68%) WordPress
12 5 (0.57%) CMS
12 5 (0.57%) nginx
13 4 (0.45%) MQSeries
13 4 (0.45%) Oracle Application Server
Applications
1 25 (2.83%) Microsoft Office
2 9 (1.02%) MS Visio
3 8 (0.91%) Sketch
4 6 (0.68%) Adobe XD
5 5 (0.57%) Microsoft Excel
6 4 (0.45%) LibreOffice
7 2 (0.23%) UXPin
7 2 (0.23%) Zeplin
8 1 (0.11%) SPSS
8 1 (0.11%) Trello
Business Applications
1 18 (2.04%) Elite 3E
2 17 (1.93%) Remedy ITSM
3 9 (1.02%) Dynamics CRM
4 7 (0.79%) NetSuite
5 6 (0.68%) Exstream
6 4 (0.45%) JDE EnterpriseOne
6 4 (0.45%) JDE OneWorld
7 3 (0.34%) Infor M3
8 1 (0.11%) Oracle FAH
8 1 (0.11%) Oracle General Ledger
8 1 (0.11%) Oracle Payables
8 1 (0.11%) Salesforce CRM
8 1 (0.11%) SAP Business One
8 1 (0.11%) SAP ERP
8 1 (0.11%) SAP Hybris
8 1 (0.11%) SAP S/4HANA
Cloud Services
1 312 (35.37%) Azure
2 173 (19.61%) AWS
3 121 (13.72%) Azure DevOps
4 82 (9.30%) SaaS
5 71 (8.05%) GitHub
6 68 (7.71%) Serverless
7 66 (7.48%) Microsoft 365
8 57 (6.46%) Power Platform
9 53 (6.01%) IaaS
10 47 (5.33%) PaaS
11 36 (4.08%) GCP
12 32 (3.63%) AWS Lambda
13 26 (2.95%) PowerApps
14 23 (2.61%) Azure Data Factory
14 23 (2.61%) Cloud Computing
15 22 (2.49%) Amazon EKS
16 20 (2.27%) Amazon S3
17 19 (2.15%) Amazon EC2
17 19 (2.15%) Dynamics 365
18 17 (1.93%) Azure Service Bus
Communications & Networking
1 44 (4.99%) HTTP
2 31 (3.51%) VPN
3 28 (3.17%) Firewall
4 23 (2.61%) NGFW
5 21 (2.38%) Internet
6 17 (1.93%) DNS
7 15 (1.70%) TCP/IP
8 13 (1.47%) SAN
8 13 (1.47%) WAN
9 12 (1.36%) AMQP
10 11 (1.25%) Intrusion Detection
10 11 (1.25%) Network Security
10 11 (1.25%) SD-WAN
11 8 (0.91%) Cisco IOS
11 8 (0.91%) SMTP
12 7 (0.79%) Cisco ISE
12 7 (0.79%) Ethernet
12 7 (0.79%) F5 BIG-IP GTM
12 7 (0.79%) F5 BIG-IP LTM
12 7 (0.79%) LAN
Database & Business Intelligence
1 171 (19.39%) SQL Server
2 91 (10.32%) Relational Database
3 70 (7.94%) MySQL
4 61 (6.92%) MongoDB
5 55 (6.24%) NoSQL
6 44 (4.99%) Power BI
7 41 (4.65%) SQL Server Integration Services
8 40 (4.54%) PostgreSQL
9 39 (4.42%) Big Data
9 39 (4.42%) Oracle Database
10 36 (4.08%) SQL Server Reporting Services
11 35 (3.97%) RDBMS
12 23 (2.61%) Azure SQL Database
12 23 (2.61%) Data Warehouse
12 23 (2.61%) Elasticsearch
13 21 (2.38%) SQLite
14 20 (2.27%) Data Lake
15 18 (2.04%) DynamoDB
15 18 (2.04%) Hadoop
16 17 (1.93%) Amazon Redshift
Development Applications
1 154 (17.46%) Git
2 142 (16.10%) Jenkins
3 90 (10.20%) IntelliJ
4 72 (8.16%) JIRA
5 46 (5.22%) Selenium
6 38 (4.31%) Postman
7 32 (3.63%) Maven
8 27 (3.06%) Cucumber
8 27 (3.06%) Oracle APEX
8 27 (3.06%) Subversion
9 24 (2.72%) GitLab
9 24 (2.72%) JMeter
9 24 (2.72%) JUnit
10 22 (2.49%) Visual Studio
11 17 (1.93%) Cypress.io
12 16 (1.81%) WebDriver
13 15 (1.70%) Artifactory
13 15 (1.70%) SoapUI
13 15 (1.70%) SQL Server Management Studio (SSMS)
14 14 (1.59%) Sonatype Nexus
General
1 158 (17.91%) Finance
2 157 (17.80%) Social Skills
3 136 (15.42%) Public Sector
4 70 (7.94%) Analytical Skills
5 61 (6.92%) Banking
6 51 (5.78%) Law
7 34 (3.85%) Inclusion and Diversity
8 31 (3.51%) Legal
9 24 (2.72%) Retail
10 21 (2.38%) Local Government
11 18 (2.04%) Publishing
12 12 (1.36%) Retail Banking
13 11 (1.25%) Marketing
14 10 (1.13%) Manufacturing
15 8 (0.91%) Financial Institution
15 8 (0.91%) Games
15 8 (0.91%) Presentation Skills
16 5 (0.57%) Advertising
16 5 (0.57%) Aerospace
17 4 (0.45%) Electronics
Job Titles
1 384 (43.54%) Developer
2 221 (25.06%) Senior
3 118 (13.38%) Software Engineer
4 114 (12.93%) Architect
5 105 (11.90%) Senior Developer
6 78 (8.84%) Java Developer
7 74 (8.39%) Lead
8 72 (8.16%) Java Engineer
9 67 (7.60%) Senior Software Engineer
10 66 (7.48%) Java Software Engineer
11 65 (7.37%) Senior Java Engineer
12 64 (7.26%) Analyst
13 63 (7.14%) Senior Java Software Engineer
14 46 (5.22%) .NET Developer
14 46 (5.22%) Solutions Architect
15 37 (4.20%) Software Developer
16 34 (3.85%) Cloud Architect
16 34 (3.85%) Cloud Engineer
17 32 (3.63%) Data Engineer
17 32 (3.63%) PHP Developer
Libraries, Frameworks & Software Standards
1 420 (47.62%) XML
2 316 (35.83%) REST
3 257 (29.14%) HTML
4 256 (29.02%) Web Services
5 232 (26.30%) CSS
6 197 (22.34%) SOAP
7 193 (21.88%) .NET
8 177 (20.07%) AngularJS
9 167 (18.93%) RESTful
10 158 (17.91%) Spring
11 118 (13.38%) React
12 101 (11.45%) Hibernate
13 94 (10.66%) .NET Framework
14 93 (10.54%) ASP.NET
15 92 (10.43%) XSD
15 92 (10.43%) YAML
16 84 (9.52%) JPA
17 76 (8.62%) Java EE
18 69 (7.82%) HTML5
19 67 (7.60%) Twitter Bootstrap
Miscellaneous
1 55 (6.24%) Public Cloud
2 53 (6.01%) Self-Motivation
3 42 (4.76%) Enterprise Software
4 35 (3.97%) Management Information System
5 32 (3.63%) Product Ownership
6 31 (3.51%) Legacy Systems
7 27 (3.06%) Private Cloud
8 25 (2.83%) Data Structures
9 22 (2.49%) Distributed Systems
10 20 (2.27%) Linux Command Line
11 16 (1.81%) Cloud Native
12 15 (1.70%) Data Centre
13 12 (1.36%) Replication
14 10 (1.13%) Greenfield Project
14 10 (1.13%) Low-Code
15 8 (0.91%) Online Banking
15 8 (0.91%) Virtual Team
16 7 (0.79%) Clustering
16 7 (0.79%) Hedge funds
16 7 (0.79%) Hybrid Cloud
Operating Systems
1 66 (7.48%) Linux
2 55 (6.24%) Windows
3 33 (3.74%) Unix
4 30 (3.40%) Apple iOS
5 25 (2.83%) Android
5 25 (2.83%) Windows Server
6 8 (0.91%) Windows Server 2016
7 7 (0.79%) Windows Server 2019
8 5 (0.57%) Windows 10
9 2 (0.23%) zOS
10 1 (0.11%) CentOS
10 1 (0.11%) Ubuntu
Processes & Methodologies
1 450 (51.02%) Agile
2 282 (31.97%) DevOps
3 201 (22.79%) Problem-Solving
4 184 (20.86%) Software Engineering
5 149 (16.89%) Microservices
6 139 (15.76%) Mentoring
7 128 (14.51%) CI/CD
8 122 (13.83%) User Experience
9 120 (13.61%) Collaborative Working
10 119 (13.49%) Scrum
11 118 (13.38%) Front End Development
12 105 (11.90%) Test Automation
13 103 (11.68%) UX Design
14 97 (11.00%) Actionable Insight
15 91 (10.32%) MVC
16 85 (9.64%) Infrastructure as Code
17 84 (9.52%) Data Design
17 84 (9.52%) SDLC
18 81 (9.18%) TDD
19 74 (8.39%) Full Stack Development
Programming Languages
1 350 (39.68%) SQL
2 325 (36.85%) JavaScript
3 274 (31.07%) Java
4 225 (25.51%) Python
5 204 (23.13%) C#
6 157 (17.80%) PowerShell
7 76 (8.62%) T-SQL
8 59 (6.69%) Bash
9 55 (6.24%) PHP
10 47 (5.33%) Perl
11 46 (5.22%) TypeScript
12 30 (3.40%) PL/SQL
13 26 (2.95%) Ruby
14 25 (2.83%) Shell Script
15 22 (2.49%) Scala
16 20 (2.27%) C
16 20 (2.27%) Groovy
17 16 (1.81%) Bicep
17 16 (1.81%) VB
18 13 (1.47%) Tcl
Qualifications
1 169 (19.16%) Security Cleared
2 160 (18.14%) SC Cleared
3 101 (11.45%) Degree
4 41 (4.65%) Azure Certification
5 40 (4.54%) Computer Science Degree
6 23 (2.61%) Master's Degree
7 22 (2.49%) AWS Certification
8 9 (1.02%) DV Cleared
9 7 (0.79%) AWS Certified DevOps Engineer
9 7 (0.79%) AWS Certified SysOps Administrator
9 7 (0.79%) Microsoft Certification
10 4 (0.45%) AWS Certified Solutions Architect
10 4 (0.45%) BPSS Clearance
11 3 (0.34%) DBS Check
12 2 (0.23%) ISTQB
13 1 (0.11%) HNC
13 1 (0.11%) Numerate Degree
13 1 (0.11%) OCP
13 1 (0.11%) Oracle Certification
13 1 (0.11%) RHCE
Quality Assurance & Compliance
1 57 (6.46%) QA
2 28 (3.17%) Data Quality
3 14 (1.59%) Accessibility
4 11 (1.25%) ISO/IEC 27001
5 6 (0.68%) NCSC
6 2 (0.23%) PMO
7 1 (0.11%) COREP
7 1 (0.11%) HL7
7 1 (0.11%) IFRS
7 1 (0.11%) IFRS 17
7 1 (0.11%) IFRS 9
7 1 (0.11%) ISO 9001
7 1 (0.11%) SLA
7 1 (0.11%) Software Quality Assurance
System Software
1 128 (14.51%) Docker
2 53 (6.01%) Active Directory
3 42 (4.76%) VMware Infrastructure
4 30 (3.40%) Virtual Desktop
5 25 (2.83%) VMware ESXi
6 24 (2.72%) vSphere
7 16 (1.81%) Hyper-V
8 7 (0.79%) VMware NSX
9 4 (0.45%) FreeRADIUS
10 3 (0.34%) Virtual Machines
11 1 (0.11%) Ceph
11 1 (0.11%) Citrix Hypervisor
11 1 (0.11%) Gluster
11 1 (0.11%) HDFS
11 1 (0.11%) KVM
11 1 (0.11%) NFS
11 1 (0.11%) QEMU
Systems Management
1 96 (10.88%) Terraform
2 91 (10.32%) Kubernetes
3 54 (6.12%) Ansible
4 20 (2.27%) Istio
5 18 (2.04%) Progress Chef
6 17 (1.93%) Packer
7 15 (1.70%) Puppet
8 13 (1.47%) FortiGate
9 10 (1.13%) HP Quality Center
10 8 (0.91%) Active Directory Federation Services
11 7 (0.79%) Argo
12 6 (0.68%) Kibana
12 6 (0.68%) Microsoft Clustering
13 4 (0.45%) MIIS
13 4 (0.45%) NetBackup
13 4 (0.45%) Rancher
13 4 (0.45%) WSUS
14 3 (0.34%) Nagios
14 3 (0.34%) Single Sign-On
15 2 (0.23%) Norton AntiVirus
Vendors
1 140 (15.87%) Microsoft
2 86 (9.75%) Oracle
3 57 (6.46%) Citrix
4 52 (5.90%) VMware
5 49 (5.56%) Google
6 35 (3.97%) HP
7 26 (2.95%) ServiceNow
8 25 (2.83%) Atlassian
8 25 (2.83%) SolarWinds
9 22 (2.49%) Xamarin
10 21 (2.38%) IBM
11 17 (1.93%) BMC
11 17 (1.93%) Databricks
11 17 (1.93%) Remedy
12 16 (1.81%) Cisco
13 12 (1.36%) MKS
13 12 (1.36%) MuleSoft
14 11 (1.25%) F5
14 11 (1.25%) Fortinet
15 9 (1.02%) Adobe