Customer-Centricity Jobs

Customer-Centric
UK

The table below provides summary statistics for permanent job vacancies requiring Customer-Centricity skills. It includes a benchmarking guide to the annual salaries offered in vacancies that cited Customer-Centricity over the 6 months leading up to 10 October 2024, comparing them to the same period in the previous two years.

6 months to
10 Oct 2024
Same period 2023 Same period 2022
Rank 355 321 306
Rank change year-on-year -34 -15 +88
Permanent jobs citing Customer-Centricity 566 590 1,787
As % of all permanent jobs advertised in the UK 0.72% 0.97% 1.23%
As % of the Processes & Methodologies category 0.86% 1.03% 1.28%
Number of salaries quoted 234 469 599
10th Percentile £30,875 £30,000 £28,900
25th Percentile £36,250 £41,250 £41,250
Median annual salary (50th Percentile) £55,625 £67,529 £60,000
Median % change year-on-year -17.63% +12.55% +4.35%
75th Percentile £75,000 £72,500 £85,000
90th Percentile £89,625 £85,250 £97,500
UK excluding London median annual salary £45,000 £65,033 £47,500
% change year-on-year -30.80% +36.91% -5.00%

All Process and Methodology Skills
UK

Customer-Centricity falls under the Processes and Methodologies category. For comparison with the information above, the following table provides summary statistics for all permanent job vacancies requiring process or methodology skills.

Permanent vacancies with a requirement for process or methodology skills 65,494 57,337 139,178
As % of all permanent jobs advertised in the UK 83.47% 94.46% 96.17%
Number of salaries quoted 32,352 40,989 77,356
10th Percentile £32,888 £32,500 £33,950
25th Percentile £43,750 £45,000 £45,000
Median annual salary (50th Percentile) £60,000 £60,000 £60,000
Median % change year-on-year - - +4.35%
75th Percentile £77,500 £80,000 £80,000
90th Percentile £96,250 £97,600 £97,500
UK excluding London median annual salary £52,500 £53,760 £52,500
% change year-on-year -2.34% +2.40% +5.00%

Customer-Centricity
Job Vacancy Trend

Job postings citing Customer-Centricity as a proportion of all IT jobs advertised.
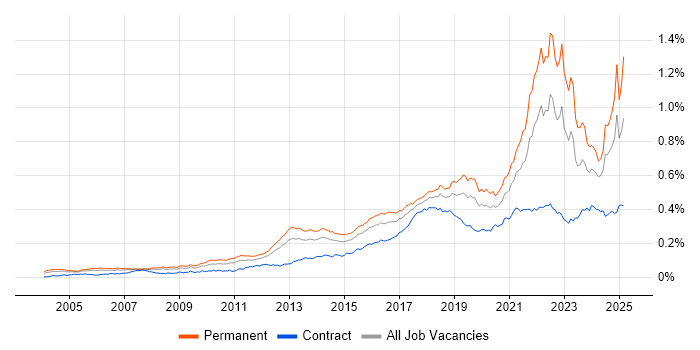
Job vacancy trend for Customer-Centricity in the UK

Customer-Centricity
Salary Trend

3-month moving average salary quoted in jobs citing Customer-Centricity.

Salary trend for Customer-Centricity in the UK

Customer-Centricity
Salary Histogram

Salary distribution for jobs citing Customer-Centricity over the 6 months to 10 October 2024.

Salary histogram for Customer-Centricity in the UK

Customer-Centricity
Top 17 Job Locations

The table below looks at the demand and provides a guide to the median salaries quoted in IT jobs citing Customer-Centricity within the UK over the 6 months to 10 October 2024. The 'Rank Change' column provides an indication of the change in demand within each location based on the same 6 month period last year.

Location Rank Change
on Same Period
Last Year
Matching
Permanent
IT Job Ads
Median Salary
Past 6 Months
Median Salary
% Change
on Same Period
Last Year
Live
Jobs
England -26 511 £55,000 -12.70% 219
UK excluding London -51 332 £45,000 -30.80% 129
London +51 202 £75,000 +22.20% 104
Work from Home -15 145 £57,500 -4.56% 85
South East -56 93 £40,000 - 22
North of England -28 91 £61,305 -9.18% 39
North West -14 57 £61,305 -3.88% 24
South West -10 52 £38,411 -45.13% 21
Midlands -17 47 £40,000 -42.86% 22
Yorkshire 0 28 £60,000 -11.11% 13
East Midlands -15 28 £26,500 -62.14% 8
East of England -54 22 £42,500 -15.00% 12
Scotland -1 20 £53,750 -23.21% 9
West Midlands -22 19 £60,000 -14.29% 14
North East -37 6 - - 2
Wales +24 5 - - 2
Northern Ireland +25 2 £68,750 +52.78% 6

Customer-Centricity
Co-occurring Skills and Capabilities by Category

The follow tables expand on the table above by listing co-occurrences grouped by category. The same employment type, locality and period is covered with up to 20 co-occurrences shown in each of the following categories:

Application Platforms
1 16 (2.83%) SharePoint
2 13 (2.30%) Microsoft Exchange
2 13 (2.30%) Oracle SOA Suite
3 6 (1.06%) Confluence
4 3 (0.53%) Oracle Workflow
5 2 (0.35%) Apache Pulsar
5 2 (0.35%) CMS
5 2 (0.35%) Moodle
6 1 (0.18%) Apache
6 1 (0.18%) IIS
6 1 (0.18%) SAS
6 1 (0.18%) WordPress
Applications
1 63 (11.13%) Microsoft Excel
2 38 (6.71%) Microsoft Office
3 14 (2.47%) AutoCAD
3 14 (2.47%) Microsoft Project
4 6 (1.06%) Microsoft PowerPoint
5 3 (0.53%) Adobe XD
5 3 (0.53%) Sketch
6 2 (0.35%) MS Visio
7 1 (0.18%) Adobe Captivate
7 1 (0.18%) Blender
Business Applications
1 14 (2.47%) Oracle EBS
2 6 (1.06%) Oracle ERP
3 5 (0.88%) Oracle EBS R12
4 2 (0.35%) Dynamics CRM
4 2 (0.35%) Oracle General Ledger
4 2 (0.35%) Oracle Subledger Accounting
4 2 (0.35%) Salesforce CRM
5 1 (0.18%) Dynamics NAV
5 1 (0.18%) Payment Gateway
Cloud Services
1 109 (19.26%) AWS
2 91 (16.08%) Azure
3 62 (10.95%) SaaS
4 52 (9.19%) Microsoft 365
5 39 (6.89%) GCP
6 27 (4.77%) Power Platform
7 18 (3.18%) IaaS
8 16 (2.83%) OCI
9 15 (2.65%) PaaS
10 11 (1.94%) Azure DevOps
11 9 (1.59%) Google Workspace
12 7 (1.24%) Dynamics 365
13 6 (1.06%) Entra ID
14 5 (0.88%) OneDrive
15 4 (0.71%) Figma
16 3 (0.53%) Miro
16 3 (0.53%) Nutanix
16 3 (0.53%) Rubrik
17 2 (0.35%) Amazon Bedrock
17 2 (0.35%) Collibra
Communications & Networking
1 26 (4.59%) TCP/IP
2 24 (4.24%) Firewall
3 23 (4.06%) LAN
4 19 (3.36%) VLAN
5 18 (3.18%) BGP
5 18 (3.18%) OSPF
6 10 (1.77%) WAN
7 9 (1.59%) Radio Access Network
7 9 (1.59%) SAN
8 8 (1.41%) HTTP
9 7 (1.24%) DNS
9 7 (1.24%) Remote Desktop
10 6 (1.06%) DHCP
11 5 (0.88%) VPN
12 4 (0.71%) ADSL
13 3 (0.53%) Broadband
13 3 (0.53%) Ethernet
13 3 (0.53%) NAS
14 2 (0.35%) Internet
14 2 (0.35%) Wi-Fi
Database & Business Intelligence
1 44 (7.77%) SQL Server
2 27 (4.77%) Power BI
3 22 (3.89%) SQL Server Reporting Services
4 17 (3.00%) MS Access
4 17 (3.00%) Tableau
5 14 (2.47%) Amazon QuickSight
5 14 (2.47%) Oracle ODI
6 8 (1.41%) Amazon Redshift
6 8 (1.41%) Data Warehouse
7 7 (1.24%) SQL Server Integration Services
8 6 (1.06%) MySQL
9 5 (0.88%) Power Query
9 5 (0.88%) Relational Database
10 4 (0.71%) Azure SQL Database
11 3 (0.53%) PostgreSQL
12 2 (0.35%) MariaDB
12 2 (0.35%) Metadata
12 2 (0.35%) MongoDB
12 2 (0.35%) SAP BW
13 1 (0.18%) NoSQL
Development Applications
1 17 (3.00%) Visual Studio
2 14 (2.47%) Git
2 14 (2.47%) JIRA
3 5 (0.88%) Android Studio
3 5 (0.88%) JUnit
3 5 (0.88%) Robolectric
4 4 (0.71%) Jenkins
4 4 (0.71%) Postman
4 4 (0.71%) SQL Server Management Studio (SSMS)
5 3 (0.53%) Cypress.io
5 3 (0.53%) Gatling
5 3 (0.53%) JMeter
5 3 (0.53%) Locust
5 3 (0.53%) REST Assured
6 2 (0.35%) Jasmine
6 2 (0.35%) Selenium
6 2 (0.35%) TeamCity
7 1 (0.18%) Cucumber
7 1 (0.18%) GitLab
7 1 (0.18%) Team Foundation Server
General
1 252 (44.52%) Social Skills
2 132 (23.32%) Analytical Skills
3 110 (19.43%) Finance
4 70 (12.37%) Inclusion and Diversity
5 35 (6.18%) Marketing
6 33 (5.83%) Presentation Skills
7 30 (5.30%) Retail
8 27 (4.77%) Banking
8 27 (4.77%) Law
9 23 (4.06%) Manufacturing
9 23 (4.06%) Retail Banking
10 21 (3.71%) Public Sector
11 19 (3.36%) Legal
12 18 (3.18%) Organisational Skills
13 17 (3.00%) Influencing Skills
13 17 (3.00%) Telecoms
14 9 (1.59%) Digital Health
15 4 (0.71%) Electronics
16 3 (0.53%) Back Office
17 2 (0.35%) Multimedia
Job Titles
1 96 (16.96%) Senior
2 75 (13.25%) Analyst
3 68 (12.01%) Architect
4 42 (7.42%) Software Engineer
5 38 (6.71%) Consultant
6 35 (6.18%) Senior Architect
7 31 (5.48%) Solutions Architect
8 29 (5.12%) Developer
9 28 (4.95%) Lead
10 27 (4.77%) Senior Manager
11 23 (4.06%) IT Support
12 22 (3.89%) IT Analyst
12 22 (3.89%) Project Manager
12 22 (3.89%) Senior Solutions Architect
13 18 (3.18%) Engineering Manager
13 18 (3.18%) IT Consultant
13 18 (3.18%) Network Consultant
13 18 (3.18%) Support Analyst
14 17 (3.00%) Portal Developer
14 17 (3.00%) Systems Engineer
Libraries, Frameworks & Software Standards
1 41 (7.24%) .NET
2 30 (5.30%) React
3 23 (4.06%) RESTful
4 21 (3.71%) .NET Core
4 21 (3.71%) .NET Framework
5 17 (3.00%) JSON
5 17 (3.00%) XML
6 16 (2.83%) REST
7 15 (2.65%) AngularJS
8 14 (2.47%) Spring
9 13 (2.30%) Node.js
9 13 (2.30%) Web Services
10 12 (2.12%) HTML
10 12 (2.12%) Spring Boot
11 11 (1.94%) CSS
11 11 (1.94%) GraphQL
11 11 (1.94%) OAuth
11 11 (1.94%) OpenID
12 9 (1.59%) jQuery
13 8 (1.41%) Micronaut
Miscellaneous
1 43 (7.60%) Onboarding
2 33 (5.83%) Self-Motivation
3 32 (5.65%) Management Information System
4 30 (5.30%) Cloud Native
5 29 (5.12%) Product Ownership
6 25 (4.42%) Data Centre
7 24 (4.24%) Hybrid Cloud
8 21 (3.71%) Mobile App
9 20 (3.53%) Robotics
10 13 (2.30%) Cyberattack
10 13 (2.30%) Life Science
11 11 (1.94%) Analytical Mindset
11 11 (1.94%) Distributed Systems
11 11 (1.94%) Social Media
12 9 (1.59%) Video Conferencing
13 8 (1.41%) Driving Licence
13 8 (1.41%) Virtual Team
14 7 (1.24%) FMCG
14 7 (1.24%) Private Cloud
14 7 (1.24%) Public Cloud
Operating Systems
1 64 (11.31%) Windows
2 31 (5.48%) Linux
3 22 (3.89%) Windows Server
4 11 (1.94%) Unix
4 11 (1.94%) Windows 10
5 10 (1.77%) Android
6 6 (1.06%) Apple iOS
7 3 (0.53%) Mac OS
8 2 (0.35%) Windows 7
9 1 (0.18%) Windows Server 2008
9 1 (0.18%) Windows Server 2012
9 1 (0.18%) Windows Server 2016
9 1 (0.18%) Windows Server 2019
Processes & Methodologies
1 163 (28.80%) Agile
2 150 (26.50%) Problem-Solving
3 119 (21.02%) Continuous Improvement
4 107 (18.90%) Customer Experience
5 104 (18.37%) Customer-Centric Approach
6 90 (15.90%) Roadmaps
7 88 (15.55%) Project Management
8 72 (12.72%) Business Development
9 68 (12.01%) ITIL
10 67 (11.84%) Process Improvement
11 61 (10.78%) Coaching
12 60 (10.60%) Software Engineering
13 59 (10.42%) Logistics
14 58 (10.25%) Customer Service
15 51 (9.01%) DevOps
16 49 (8.66%) Stakeholder Management
17 47 (8.30%) Project Delivery
18 45 (7.95%) Cybersecurity
18 45 (7.95%) Decision-Making
18 45 (7.95%) Scrum
Programming Languages
1 80 (14.13%) SQL
2 39 (6.89%) Python
3 23 (4.06%) Java
4 19 (3.36%) JavaScript
5 13 (2.30%) C#
6 11 (1.94%) TypeScript
7 9 (1.59%) PowerShell
7 9 (1.59%) Ruby
8 8 (1.41%) Kotlin
9 6 (1.06%) C++
10 4 (0.71%) Bash
10 4 (0.71%) Data Analysis Expressions
10 4 (0.71%) Perl
10 4 (0.71%) R
11 3 (0.53%) Apex Code
11 3 (0.53%) SOQL
11 3 (0.53%) VBA
11 3 (0.53%) VBScript
12 2 (0.35%) PHP
12 2 (0.35%) T-SQL
Qualifications
1 96 (16.96%) Degree
2 46 (8.13%) Security Cleared
3 40 (7.07%) SC Cleared
4 39 (6.89%) Master's Degree
5 25 (4.42%) MBA
6 18 (3.18%) Cisco Certification
7 16 (2.83%) Azure Certification
7 16 (2.83%) Six Sigma Black Belt
8 15 (2.65%) CISSP
9 14 (2.47%) DBS Check
9 14 (2.47%) Microsoft Certification
10 13 (2.30%) (ISC)2 CCSP
10 13 (2.30%) AWS Certification
10 13 (2.30%) CCSP
10 13 (2.30%) CISM
10 13 (2.30%) Computer Science Degree
10 13 (2.30%) ISACA
11 12 (2.12%) A+ Certification
11 12 (2.12%) ITIL Foundation Certificate
12 10 (1.77%) BPSS Clearance
Quality Assurance & Compliance
1 36 (6.36%) QA
2 14 (2.47%) SLA
3 13 (2.30%) Cyber Essentials
3 13 (2.30%) Cyber Essentials PLUS
3 13 (2.30%) IASME
4 10 (1.77%) ISO 14001
4 10 (1.77%) ISO 9001
4 10 (1.77%) ISO/IEC 27001
5 9 (1.59%) ISO 22301
5 9 (1.59%) NEBOSH
6 5 (0.88%) Accessibility
6 5 (0.88%) Sarbanes-Oxley
7 2 (0.35%) Data Quality
7 2 (0.35%) GAAP
7 2 (0.35%) IFRS
7 2 (0.35%) ISO/IEC 27002 (supersedes ISO/IEC 17799)
8 1 (0.18%) GDPR
8 1 (0.18%) ISO 20022
8 1 (0.18%) NIST
System Software
1 42 (7.42%) Active Directory
2 11 (1.94%) Docker
2 11 (1.94%) Hyper-V
3 8 (1.41%) VMware Infrastructure
4 4 (0.71%) Lustre
4 4 (0.71%) Slurm Workload Manager
5 3 (0.53%) vSphere
6 2 (0.35%) Microsoft Virtual Server
6 2 (0.35%) Virtual Servers
7 1 (0.18%) Terminal Services
7 1 (0.18%) Virtual Desktop
Systems Management
1 12 (2.12%) SCCM
2 8 (1.41%) Kubernetes
3 5 (0.88%) Microsoft Intune
4 4 (0.71%) Terraform
5 3 (0.53%) Jamf Pro
5 3 (0.53%) NetBackup
5 3 (0.53%) NetIQ Identity Manager
5 3 (0.53%) Single Sign-On
6 1 (0.18%) Ansible
6 1 (0.18%) Autotask
6 1 (0.18%) Puppet
6 1 (0.18%) yum
Vendors
1 131 (23.14%) Microsoft
2 34 (6.01%) Oracle
3 22 (3.89%) Cisco
4 21 (3.71%) Fortinet
5 19 (3.36%) Salesforce
6 18 (3.18%) Sony
7 16 (2.83%) Extreme Networks
7 16 (2.83%) Minitab
8 10 (1.77%) Google
8 10 (1.77%) HubSpot
9 9 (1.59%) BT
9 9 (1.59%) VMware
10 8 (1.41%) Apple
11 6 (1.06%) HP
12 5 (0.88%) Adobe
12 5 (0.88%) Meraki
13 4 (0.71%) Aruba
13 4 (0.71%) Dell
13 4 (0.71%) IBM
13 4 (0.71%) Veeam