Virtual Machine (VM)
UK

The following table provides summary statistics for permanent job vacancies with a requirement for Virtual Machines skills. Included is a benchmarking guide to the salaries offered in vacancies that have cited Virtual Machines over the 6 months to 10 December 2023 with a comparison to the same period in the previous 2 years.

6 months to
10 Dec 2023
Same period 2022 Same period 2021
Rank 322 528 522
Rank change year-on-year +206 -6 -15
Permanent jobs citing Virtual Machines 497 682 699
As % of all permanent jobs advertised in the UK 0.95% 0.56% 0.55%
As % of the System Software category 5.67% 3.65% 3.11%
Number of salaries quoted 256 361 424
10th Percentile £31,875 £31,250 £30,750
25th Percentile £50,000 £37,500 £37,750
Median annual salary (50th Percentile) £62,500 £52,500 £52,500
Median % change year-on-year +19.05% - +5.00%
75th Percentile £74,250 £72,500 £70,000
90th Percentile £86,250 £91,250 £85,000
UK excluding London median annual salary £57,500 £45,000 £45,000
% change year-on-year +27.78% - +12.50%

All System Software Skills
UK

Virtual Machines is in the System Software category. The following table is for comparison with the above and provides summary statistics for all permanent job vacancies with a requirement for system software skills.

Permanent vacancies with a requirement for system software skills 8,771 18,701 22,467
As % of all permanent jobs advertised in the UK 16.78% 15.30% 17.68%
Number of salaries quoted 7,001 12,503 15,991
10th Percentile £29,000 £29,250 £28,000
25th Percentile £37,000 £38,000 £38,250
Median annual salary (50th Percentile) £55,000 £55,000 £55,000
75th Percentile £72,500 £77,715 £77,500
90th Percentile £90,000 £95,000 £95,000
UK excluding London median annual salary £47,557 £49,150 £47,500
% change year-on-year -3.24% +3.47% +4.97%

Virtual Machines
Job Vacancy Trend

Job postings citing Virtual Machines as a proportion of all IT jobs advertised.
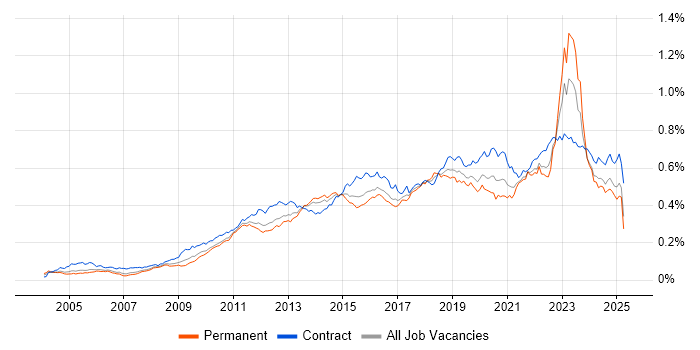
Job vacancy trend for Virtual Machines in the UK

Virtual Machines
Salary Trend

3-month moving average salary quoted in jobs citing Virtual Machines.

Salary trend for Virtual Machines in the UK

Virtual Machines
Salary Histogram

Salary distribution for jobs citing Virtual Machines over the 6 months to 10 December 2023.

Salary histogram for Virtual Machines in the UK

Virtual Machines
Top 17 Job Locations

The table below looks at the demand and provides a guide to the median salaries quoted in IT jobs citing Virtual Machines within the UK over the 6 months to 10 December 2023. The 'Rank Change' column provides an indication of the change in demand within each location based on the same 6 month period last year.

Location Rank Change
on Same Period
Last Year
Matching
Permanent
IT Job Ads
Median Salary
Past 6 Months
Median Salary
% Change
on Same Period
Last Year
Live
Jobs
England +199 426 £62,500 +13.64% 140
UK excluding London +200 347 £57,500 +27.78% 92
Work from Home +203 173 £65,000 +30.00% 64
North of England +195 116 £61,250 +44.66% 22
London +131 112 £65,000 -7.14% 55
South East +127 78 £56,525 +13.05% 21
Yorkshire +129 74 £37,250 -12.02% 8
South West +49 45 £51,250 +21.04% 9
Midlands +141 42 £60,000 +12.68% 20
North West +128 39 £75,000 +61.29% 10
Scotland +14 26 £65,000 +68.14% 9
West Midlands +124 23 £60,000 +9.09% 17
Wales +35 22 £44,000 +13.55% 4
East Midlands +64 19 - - 3
East of England +113 16 £56,250 +60.71% 10
North East +42 3 £40,000 +6.80% 5
Northern Ireland +33 2 - -

Virtual Machines
Co-occurring Skills and Capabilities by Category

The follow tables expand on the table above by listing co-occurrences grouped by category. The same employment type, locality and period is covered with up to 20 co-occurrences shown in each of the following categories:

Application Platforms
1 33 (6.64%) SharePoint
2 8 (1.61%) MS Exchange
3 4 (0.80%) IIS
4 3 (0.60%) Apache
5 2 (0.40%) Apache Airflow
5 2 (0.40%) Cloud Foundry
5 2 (0.40%) OpenStack
6 1 (0.20%) Apache Solr
6 1 (0.20%) Confluence
6 1 (0.20%) Drupal
Applications
1 27 (5.43%) Microsoft Excel
2 18 (3.62%) Microsoft Office
3 2 (0.40%) Microsoft PowerPoint
4 1 (0.20%) MS Visio
Business Applications
1 25 (5.03%) Oracle Payables
1 25 (5.03%) Oracle Receivables
2 3 (0.60%) Oracle Procure-to-Pay
3 2 (0.40%) Misys Equation
4 1 (0.20%) Sparx Enterprise Architect
Cloud Services
1 221 (44.47%) Azure
2 104 (20.93%) Microsoft 365
3 91 (18.31%) Entra ID
4 67 (13.48%) Azure DevOps
5 56 (11.27%) IaaS
6 47 (9.46%) Azure Storage
7 46 (9.26%) Azure Monitor
8 45 (9.05%) AWS
9 43 (8.65%) PaaS
10 35 (7.04%) Cloud Computing
11 26 (5.23%) Serverless
12 25 (5.03%) Azure ExpressRoute
13 22 (4.43%) GitHub
13 22 (4.43%) SaaS
14 20 (4.02%) Azure Logic Apps
14 20 (4.02%) Azure Sentinel
15 18 (3.62%) Azure App Service
16 16 (3.22%) Azure Service Bus
17 15 (3.02%) GCP
18 12 (2.41%) AWS CodePipeline
Communications & Networking
1 77 (15.49%) DNS
1 77 (15.49%) Firewall
2 64 (12.88%) DHCP
3 44 (8.85%) VPN
4 27 (5.43%) Wireless
5 25 (5.03%) 5G
5 25 (5.03%) Broadband
5 25 (5.03%) Software-Defined Networking
6 22 (4.43%) Network Security
7 16 (3.22%) WAN
8 15 (3.02%) LAN
9 14 (2.82%) VLAN
10 10 (2.01%) SAN
10 10 (2.01%) TCP/IP
11 9 (1.81%) VoIP
12 7 (1.41%) IP Telephony
13 6 (1.21%) BGP
13 6 (1.21%) Internet
14 5 (1.01%) NAS
14 5 (1.01%) SD-WAN
Database & Business Intelligence
1 18 (3.62%) Amazon RDS
1 18 (3.62%) Azure SQL Database
2 16 (3.22%) SQL Server
3 12 (2.41%) InterSystems Cache
4 7 (1.41%) Power BI
5 6 (1.21%) Data Lake
6 4 (0.80%) Elasticsearch
6 4 (0.80%) MySQL
7 3 (0.60%) MongoDB
7 3 (0.60%) RDBMS
7 3 (0.60%) Relational Database
8 2 (0.40%) PostgreSQL
8 2 (0.40%) SQL Server Integration Services
9 1 (0.20%) Data Warehouse
9 1 (0.20%) ObjectStore
9 1 (0.20%) Oracle Database
9 1 (0.20%) SQL Server Reporting Services
Development Applications
1 27 (5.43%) Jenkins
2 25 (5.03%) Git
3 16 (3.22%) TeamCity
4 15 (3.02%) GitLab
5 14 (2.82%) Octopus Deploy
6 10 (2.01%) Axure RP
7 8 (1.61%) JIRA
8 4 (0.80%) eggPlant
8 4 (0.80%) SQL Server Management Studio (SSMS)
8 4 (0.80%) Subversion
9 1 (0.20%) Bitbucket
9 1 (0.20%) CircleCI
9 1 (0.20%) JUnit
9 1 (0.20%) MSI
9 1 (0.20%) Selenium
9 1 (0.20%) Sonatype Nexus
9 1 (0.20%) TestNG
9 1 (0.20%) Travis CI
9 1 (0.20%) Vagrant
General
1 286 (57.55%) Social Skills
2 252 (50.70%) Finance
3 197 (39.64%) Banking
4 152 (30.58%) Games
5 42 (8.45%) Inclusion and Diversity
6 29 (5.84%) Analytical Skills
6 29 (5.84%) Law
7 28 (5.63%) Legal
8 16 (3.22%) Retail
9 10 (2.01%) Financial Institution
9 10 (2.01%) Telecoms
10 9 (1.81%) Organisational Skills
10 9 (1.81%) Public Sector
11 7 (1.41%) Marketing
12 5 (1.01%) Advertising
13 3 (0.60%) Aeronautics
13 3 (0.60%) Billing
13 3 (0.60%) French Language
13 3 (0.60%) Manufacturing
13 3 (0.60%) Pharmaceutical
Job Titles
1 161 (32.39%) Architect
2 152 (30.58%) Security Architect
3 81 (16.30%) Infrastructure Engineer
4 60 (12.07%) Azure Engineer
5 44 (8.85%) Senior
6 36 (7.24%) Cloud Engineer
7 31 (6.24%) Analyst
8 25 (5.03%) DevOps Engineer
8 25 (5.03%) Operations Analyst
9 24 (4.83%) Support Engineer
9 24 (4.83%) VMware Engineer
10 21 (4.23%) VMware Infrastructure Engineer
11 18 (3.62%) Administrator
12 15 (3.02%) Microsoft Engineer
12 15 (3.02%) Senior Infrastructure Engineer
12 15 (3.02%) Site Reliability Engineer
13 13 (2.62%) Azure Specialist
14 12 (2.41%) Active Directory Specialist
14 12 (2.41%) IT Manager
14 12 (2.41%) Systems Administrator
Libraries, Frameworks & Software Standards
1 51 (10.26%) ARM Templates
2 15 (3.02%) .NET
3 13 (2.62%) REST
4 11 (2.21%) Middleware
5 10 (2.01%) Azure Blueprints
5 10 (2.01%) Web Services
6 8 (1.61%) XML
7 4 (0.80%) Node.js
8 3 (0.60%) ADO
8 3 (0.60%) JSON
8 3 (0.60%) Keycloak
8 3 (0.60%) Motif
8 3 (0.60%) YAML
9 2 (0.40%) .NET Framework
9 2 (0.40%) JWT
9 2 (0.40%) NestJS
9 2 (0.40%) OAuth
9 2 (0.40%) PySpark
9 2 (0.40%) Velocity
10 1 (0.20%) FIX Protocol
Miscellaneous
1 36 (7.24%) Self-Motivation
2 28 (5.63%) Private Cloud
3 25 (5.03%) PKI
4 18 (3.62%) Public Cloud
5 16 (3.22%) Clustering
6 13 (2.62%) Mobile App
7 12 (2.41%) Blog
8 11 (2.21%) Data Centre
9 10 (2.01%) Mainframe
9 10 (2.01%) Robotics
10 9 (1.81%) iSeries
11 8 (1.61%) Management Information System
12 6 (1.21%) Cloud Native
12 6 (1.21%) Hybrid Cloud
13 4 (0.80%) Enterprise Storage
13 4 (0.80%) Greenfield Project
13 4 (0.80%) IoT
13 4 (0.80%) Legacy Systems
13 4 (0.80%) Security Posture
13 4 (0.80%) Virtual Team
Operating Systems
1 158 (31.79%) Windows
2 95 (19.11%) Windows Server
3 47 (9.46%) Linux
4 39 (7.85%) Windows Server 2016
5 33 (6.64%) Windows Server 2019
6 21 (4.23%) VMS
7 19 (3.82%) Unix
7 19 (3.82%) Windows Server 2012
8 14 (2.82%) Red Hat Enterprise Linux
9 10 (2.01%) zOS
10 6 (1.21%) Windows 10
10 6 (1.21%) Windows 7
11 5 (1.01%) CentOS
12 3 (0.60%) Ubuntu
13 2 (0.40%) Solaris
14 1 (0.20%) Apple iOS
14 1 (0.20%) Mac OS
14 1 (0.20%) Mac OS X
14 1 (0.20%) Windows 8
14 1 (0.20%) Windows Server 2008
Processes & Methodologies
1 182 (36.62%) RBAC
2 177 (35.61%) Actionable Insight
3 176 (35.41%) Containerisation
4 171 (34.41%) Cybersecurity
5 161 (32.39%) Identity Access Management
6 157 (31.59%) Asset Management
7 156 (31.39%) SIEM
8 153 (30.78%) Vulnerability Management
9 152 (30.58%) IT Asset Management
9 152 (30.58%) Network Segmentation
10 109 (21.93%) DevOps
11 92 (18.51%) Infrastructure Engineering
12 90 (18.11%) Problem-Solving
13 79 (15.90%) CI/CD
14 59 (11.87%) Agile
15 50 (10.06%) Infrastructure as Code
16 49 (9.86%) ITIL
17 46 (9.26%) Disaster Recovery
18 40 (8.05%) High Availability
19 39 (7.85%) Configuration Management
Programming Languages
1 116 (23.34%) PowerShell
2 53 (10.66%) SQL
3 44 (8.85%) Bash
4 43 (8.65%) Python
5 39 (7.85%) C#
6 33 (6.64%) Bicep
7 21 (4.23%) VB
7 21 (4.23%) VBScript
8 18 (3.62%) Java
9 15 (3.02%) Go
9 15 (3.02%) Ruby
10 14 (2.82%) JavaScript
11 4 (0.80%) Perl
12 3 (0.60%) Ada
12 3 (0.60%) C
13 2 (0.40%) DataFlex
13 2 (0.40%) Kusto Query Language
13 2 (0.40%) Lua
13 2 (0.40%) Rust
13 2 (0.40%) Shell Script
Qualifications
1 228 (45.88%) Security Cleared
2 63 (12.68%) Degree
3 61 (12.27%) SC Cleared
4 46 (9.26%) Azure Certification
5 27 (5.43%) DV Cleared
6 21 (4.23%) ITIL Foundation Certificate
7 14 (2.82%) Microsoft Certification
8 11 (2.21%) BPSS Clearance
9 7 (1.41%) Cisco Certification
10 6 (1.21%) Computer Science Degree
10 6 (1.21%) MCSA
11 4 (0.80%) AWS Certification
11 4 (0.80%) CCNA
11 4 (0.80%) ISEB
11 4 (0.80%) ISTQB
11 4 (0.80%) VMware Certified Professional (VCP)
12 3 (0.60%) CCNP
12 3 (0.60%) MCSE
13 2 (0.40%) AWS Certified SysOps Administrator
14 1 (0.20%) MCP
Quality Assurance & Compliance
1 21 (4.23%) SLA
2 7 (1.41%) ISO/IEC 27001
3 4 (0.80%) Cyber Essentials
3 4 (0.80%) Data Quality
4 2 (0.40%) Accessibility
4 2 (0.40%) QA
5 1 (0.20%) Cyber Essentials PLUS
5 1 (0.20%) GDPR
System Software
1 152 (30.58%) Active Directory
2 84 (16.90%) VMware Infrastructure
3 45 (9.05%) Docker
3 45 (9.05%) Hyper-V
4 38 (7.65%) Virtual Desktop
5 29 (5.84%) Virtual Servers
6 22 (4.43%) Firmware
7 12 (2.41%) VMware ESXi
8 6 (1.21%) vSphere
9 3 (0.60%) Ceph
10 2 (0.40%) KVM
10 2 (0.40%) Microsoft Virtual Server
10 2 (0.40%) NFS
10 2 (0.40%) pfSense
10 2 (0.40%) Veritas Cluster Server
10 2 (0.40%) XenApp
10 2 (0.40%) XenDesktop
11 1 (0.20%) BitLocker
11 1 (0.20%) Varnish
11 1 (0.20%) VirtualBox
Systems Management
1 82 (16.50%) Kubernetes
2 72 (14.49%) Microsoft Intune
3 47 (9.46%) Terraform
4 37 (7.44%) SCOM
5 32 (6.44%) SCCM
6 30 (6.04%) vCenter Server
7 27 (5.43%) VxRail
8 24 (4.83%) Active Directory Federation Services
9 23 (4.63%) WSUS
10 21 (4.23%) Ansible
11 15 (3.02%) Failover Clustering
11 15 (3.02%) FortiGate
11 15 (3.02%) Microsoft Data Protection Manager
12 9 (1.81%) Progress Chef
12 9 (1.81%) Puppet
13 7 (1.41%) Single Sign-On
14 4 (0.80%) Jamf Pro
14 4 (0.80%) Nagios
15 3 (0.60%) Docker Swarm
15 3 (0.60%) Norton AntiVirus
Vendors
1 171 (34.41%) Microsoft
2 93 (18.71%) VMware
3 40 (8.05%) Oracle
4 37 (7.44%) Cisco
5 26 (5.23%) Virgin Media
6 24 (4.83%) Citrix
7 23 (4.63%) Aruba
8 20 (4.02%) Commvault
9 19 (3.82%) Veeam
10 16 (3.22%) HP
11 15 (3.02%) Red Hat
12 14 (2.82%) Barracuda Networks
12 14 (2.82%) Kaseya
13 11 (2.21%) IBM
14 10 (2.01%) Meraki
14 10 (2.01%) ServiceNow
14 10 (2.01%) SolarWinds
14 10 (2.01%) TOWER Software
15 8 (1.61%) Adobe
16 7 (1.41%) Dell