Java Jobs with Work from Home Options

Java
UK > Work from Home

The table below provides summary statistics for permanent job vacancies with an option to work from home (WFH) and a requirement for Java skills. Included is a benchmarking guide to the salaries offered in vacancies that have cited Java over the 6 months to 7 December 2023 with a comparison to the same period in the previous 2 years.

6 months to
7 Dec 2023
Same period 2022 Same period 2021
Rank 16 15 19
Rank change year-on-year -1 +4 -3
Permanent jobs citing Java 2,567 7,252 5,969
As % of all permanent jobs with a WFH option 11.46% 13.44% 11.84%
As % of the Programming Languages category 25.11% 26.08% 20.46%
Number of salaries quoted 1,721 4,287 4,442
10th Percentile £43,750 £43,750 £41,250
25th Percentile £52,500 £52,500 £50,000
Median annual salary (50th Percentile) £70,576 £70,000 £67,500
Median % change year-on-year +0.82% +3.70% +8.00%
75th Percentile £95,000 £91,491 £88,438
90th Percentile £115,000 £112,500 £110,000
UK median annual salary £75,000 £72,500 £70,000
% change year-on-year +3.45% +3.57% +7.69%

All Programming Languages
Work from Home

Java is in the Programming Languages category. The following table is for comparison with the above and provides summary statistics for all permanent job vacancies with a WFH option and a requirement for coding skills.

Permanent vacancies with a requirement for coding skills 10,222 27,803 29,171
As % of all permanent jobs with a WFH option 45.65% 51.53% 57.86%
Number of salaries quoted 8,078 19,734 22,215
10th Percentile £40,000 £40,000 £36,250
25th Percentile £48,750 £48,750 £44,750
Median annual salary (50th Percentile) £64,000 £65,000 £60,000
Median % change year-on-year -1.54% +8.33% +9.09%
75th Percentile £83,750 £83,750 £77,500
90th Percentile £100,000 £97,500 £95,000
UK median annual salary £65,000 £65,000 £60,000
% change year-on-year - +8.33% +9.09%

Java
Trend for Jobs with a WFH Option

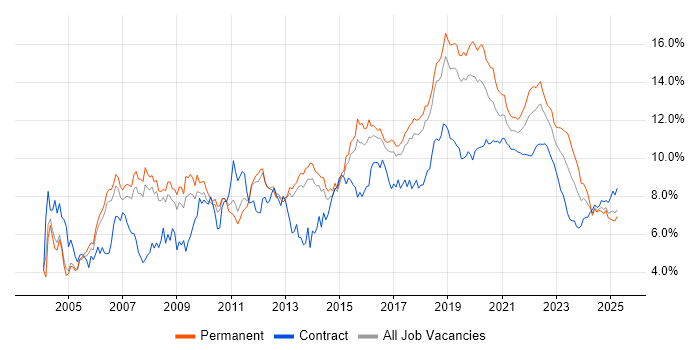
Job vacancies with a work from home option citing Java as a proportion of all IT jobs advertised.

Java trend for jobs with a WFH option

Java
Salary Trend for Jobs with a WFH Option

3-month moving average salary quoted in job vacancies with a work from home option citing Java.

Java salary trend for jobs with a WFH option

Java
Salary Histogram for Jobs with a WFH Option

Salary distribution for jobs with a work from home option citing Java over the 6 months to 7 December 2023.

Java salary histogram for jobs with a WFH option

Java
Co-occurring Skills and Capabilities with WFH Options by Category

The follow tables expand on the table above by listing co-occurrences grouped by category. The same employment type, locality and period is covered with up to 20 co-occurrences shown in each of the following categories:

Application Platforms
1 78 (3.04%) Apache
2 60 (2.34%) Confluence
3 59 (2.30%) Apache Airflow
4 57 (2.22%) Apache Spark
5 46 (1.79%) SharePoint
6 32 (1.25%) IIS
6 32 (1.25%) Tomcat
7 28 (1.09%) WebLogic
8 22 (0.86%) WebSphere
9 20 (0.78%) WebSphere Application Server
10 15 (0.58%) JBoss
11 13 (0.51%) Jupyter
12 12 (0.47%) Jetty
12 12 (0.47%) OpenStack
13 11 (0.43%) Red Hat Fuse
14 10 (0.39%) nginx
15 8 (0.31%) Oracle SOA Suite
16 7 (0.27%) NetWeaver
17 6 (0.23%) Oracle Workflow
18 4 (0.16%) CMS
Applications
1 6 (0.23%) Adobe XD
2 4 (0.16%) Adobe Premiere
3 3 (0.12%) 3ds Max
3 3 (0.12%) Blender
3 3 (0.12%) Chatbot
3 3 (0.12%) Maya
4 2 (0.078%) CANalyzer
4 2 (0.078%) Microsoft Office
5 1 (0.039%) Simulink
Business Applications
1 60 (2.34%) Endur
2 9 (0.35%) Dynamics CRM
3 6 (0.23%) BusinessWorks
4 5 (0.19%) SAP SD
5 4 (0.16%) Oracle EBS
5 4 (0.16%) SAP S/4HANA
5 4 (0.16%) Siebel CRM
6 3 (0.12%) SAP CRM
7 2 (0.078%) Distributed Ledger
7 2 (0.078%) Oracle Cash Management
7 2 (0.078%) Ripple
8 1 (0.039%) Adobe Campaign
8 1 (0.039%) Dynamics GP
8 1 (0.039%) Fidessa
8 1 (0.039%) Oracle Applications
8 1 (0.039%) R3 Corda
8 1 (0.039%) Salesforce CRM
8 1 (0.039%) SAP ERP
8 1 (0.039%) SAP GTS
8 1 (0.039%) Shopify
Cloud Services
1 1,071 (41.72%) AWS
2 468 (18.23%) Azure
3 463 (18.04%) Serverless
4 419 (16.32%) GCP
5 197 (7.67%) OpenShift
6 160 (6.23%) SaaS
7 157 (6.12%) GitHub
8 72 (2.80%) Azure DevOps
9 70 (2.73%) AWS Lambda
10 63 (2.45%) Amazon EC2
11 56 (2.18%) Amazon S3
11 56 (2.18%) dbt
12 50 (1.95%) PaaS
13 48 (1.87%) Amazon EKS
14 30 (1.17%) Amazon ECS
15 27 (1.05%) Amazon SQS
16 25 (0.97%) IaaS
17 24 (0.93%) AWS CloudFormation
17 24 (0.93%) Google Kubernetes Engine
18 20 (0.78%) Route 53
Communications & Networking
1 52 (2.03%) Internet
2 20 (0.78%) Firewall
3 19 (0.74%) AMQP
4 16 (0.62%) DNS
5 12 (0.47%) HTTP
5 12 (0.47%) TCP/IP
6 5 (0.19%) SMTP
6 5 (0.19%) SSL
6 5 (0.19%) VPN
7 4 (0.16%) Ethernet
8 3 (0.12%) Kerberos
8 3 (0.12%) Modbus
9 2 (0.078%) MQTT
9 2 (0.078%) NAS
9 2 (0.078%) SAN
9 2 (0.078%) Wireless
10 1 (0.039%) ATM
10 1 (0.039%) Broadband
10 1 (0.039%) DHCP
10 1 (0.039%) FTP
Database & Business Intelligence
1 298 (11.61%) Relational Database
2 207 (8.06%) RDBMS
3 187 (7.28%) SQL Server
4 152 (5.92%) Big Data
5 141 (5.49%) Oracle Database
6 139 (5.41%) NoSQL
7 126 (4.91%) PostgreSQL
8 115 (4.48%) MySQL
9 98 (3.82%) Elasticsearch
10 96 (3.74%) MongoDB
11 72 (2.80%) Amazon RDS
12 54 (2.10%) Hadoop
13 52 (2.03%) Amazon Athena
13 52 (2.03%) Apache Arrow
13 52 (2.03%) Dremio
14 51 (1.99%) Apache Ignite
15 33 (1.29%) BigQuery
16 30 (1.17%) DynamoDB
17 27 (1.05%) Data Warehouse
18 23 (0.90%) Data Lake
Development Applications
1 555 (21.62%) Git
2 392 (15.27%) Jenkins
3 192 (7.48%) Cucumber
4 183 (7.13%) JIRA
5 170 (6.62%) Selenium
6 158 (6.16%) Maven
7 124 (4.83%) GitLab
8 98 (3.82%) Postman
9 66 (2.57%) Bitbucket
9 66 (2.57%) Gradle
10 62 (2.42%) IntelliJ
11 60 (2.34%) Cypress.io
12 59 (2.30%) Sonatype Nexus
13 54 (2.10%) JUnit
14 52 (2.03%) SonarQube
15 44 (1.71%) Mockito
16 43 (1.68%) Artifactory
17 41 (1.60%) Atlassian Bamboo
18 38 (1.48%) JMeter
19 36 (1.40%) JDeveloper
General
1 677 (26.37%) Finance
2 461 (17.96%) Social Skills
3 360 (14.02%) Banking
4 199 (7.75%) Inclusion and Diversity
5 172 (6.70%) Police
6 169 (6.58%) Front Office
7 152 (5.92%) Analytical Skills
8 107 (4.17%) Public Sector
9 97 (3.78%) Retail
10 85 (3.31%) Investment Banking
11 82 (3.19%) Games
12 42 (1.64%) Legal
13 35 (1.36%) Retail Banking
14 34 (1.32%) Marketing
15 33 (1.29%) Financial Institution
16 25 (0.97%) Local Government
17 22 (0.86%) Aerospace
18 20 (0.78%) Telecoms
19 19 (0.74%) Presentation Skills
20 15 (0.58%) Organisational Skills
Job Titles
1 879 (34.24%) Developer
2 798 (31.09%) Software Engineer
3 580 (22.59%) Senior
4 515 (20.06%) Java Developer
5 351 (13.67%) Java Engineer
6 260 (10.13%) Senior Developer
7 258 (10.05%) Java Software Engineer
8 236 (9.19%) Lead
9 180 (7.01%) Architect
10 173 (6.74%) Senior Java Developer
11 149 (5.80%) Senior Software Engineer
12 136 (5.30%) DevOps Engineer
13 135 (5.26%) Solutions Architect
14 118 (4.60%) AWS Engineer
15 107 (4.17%) Software Developer
16 103 (4.01%) Developer/Software Engineer
17 88 (3.43%) Full Stack Developer
18 87 (3.39%) Ruby Engineer
19 83 (3.23%) Analyst
20 80 (3.12%) AWS Developer
Libraries, Frameworks & Software Standards
1 652 (25.40%) Spring
2 560 (21.82%) React
3 390 (15.19%) Spring Boot
4 282 (10.99%) Node.js
5 264 (10.28%) Kafka
6 230 (8.96%) REST
7 225 (8.77%) HTML
8 221 (8.61%) J2EE
9 195 (7.60%) .NET
9 195 (7.60%) AngularJS
10 168 (6.54%) Ruby on Rails
11 154 (6.00%) CSS
12 143 (5.57%) RESTful
13 135 (5.26%) Web Services
14 129 (5.03%) JSON
15 97 (3.78%) XML
16 87 (3.39%) SOAP
17 85 (3.31%) RabbitMQ
18 81 (3.16%) Hibernate
19 64 (2.49%) gRPC
Miscellaneous
1 113 (4.40%) Product Ownership
2 91 (3.54%) Self-Motivation
3 87 (3.39%) Greenfield Project
4 85 (3.31%) Algorithms
5 74 (2.88%) Hybrid Cloud
6 63 (2.45%) Public Cloud
7 62 (2.42%) Distributed Systems
8 60 (2.34%) Swaptions
9 57 (2.22%) Cyberattack
9 57 (2.22%) Virtual Team
10 55 (2.14%) Derivative
11 50 (1.95%) Fixed Income
12 44 (1.71%) Robotics
13 41 (1.60%) Private Cloud
14 39 (1.52%) Cloud Native
15 36 (1.40%) Data Structures
16 35 (1.36%) Mobile App
17 34 (1.32%) Linux Command Line
18 33 (1.29%) Foreign Exchange (FX)
18 33 (1.29%) Management Information System
Operating Systems
1 320 (12.47%) Linux
2 116 (4.52%) Windows
3 104 (4.05%) Unix
4 82 (3.19%) Android
5 31 (1.21%) Mac OS
6 30 (1.17%) Windows Server
7 23 (0.90%) Red Hat Enterprise Linux
8 19 (0.74%) Apple iOS
9 13 (0.51%) Ubuntu
10 11 (0.43%) VMS
11 8 (0.31%) CentOS
12 7 (0.27%) Debian
12 7 (0.27%) Solaris
13 3 (0.12%) Windows 10
14 1 (0.039%) Embedded Linux
Processes & Methodologies
1 1,090 (42.46%) Agile
2 1,084 (42.23%) Software Engineering
3 863 (33.62%) Microservices
4 691 (26.92%) DevOps
5 652 (25.40%) CI/CD
6 617 (24.04%) Problem-Solving
7 520 (20.26%) Containerisation
8 461 (17.96%) Mentoring
9 447 (17.41%) Design Patterns
10 390 (15.19%) Continuous Integration
11 386 (15.04%) Actionable Insight
12 365 (14.22%) Unit Testing
13 315 (12.27%) Clean Code
14 292 (11.38%) Code Quality
15 285 (11.10%) SDLC
16 272 (10.60%) Scrum
17 265 (10.32%) TDD
18 257 (10.01%) Test Automation
19 252 (9.82%) Full Stack Development
20 247 (9.62%) Coaching
Programming Languages
1 1,039 (40.48%) Python
2 720 (28.05%) JavaScript
3 460 (17.92%) SQL
4 391 (15.23%) C#
5 319 (12.43%) Ruby
6 222 (8.65%) Go
7 216 (8.41%) TypeScript
8 207 (8.06%) Bash
9 189 (7.36%) Kotlin
10 164 (6.39%) C++
11 133 (5.18%) Scala
12 130 (5.06%) Perl
13 99 (3.86%) PowerShell
14 67 (2.61%) VB
15 55 (2.14%) C
16 50 (1.95%) PL/SQL
17 49 (1.91%) Rust
18 33 (1.29%) R
19 31 (1.21%) Groovy
20 30 (1.17%) PHP
Qualifications
1 632 (24.62%) Security Cleared
2 431 (16.79%) SC Cleared
3 262 (10.21%) Degree
4 146 (5.69%) DV Cleared
5 129 (5.03%) Computer Science Degree
6 45 (1.75%) AWS Certification
7 37 (1.44%) BPSS Clearance
8 31 (1.21%) Master's Degree
9 26 (1.01%) AWS Certified Solutions Architect
10 25 (0.97%) AWS Certified Developer
11 24 (0.93%) AWS Certified Cloud Practitioner
12 23 (0.90%) ISTQB
13 21 (0.82%) ISEB
13 21 (0.82%) OCP
13 21 (0.82%) Oracle Certification
14 13 (0.51%) Azure Certification
14 13 (0.51%) ITIL Certification
15 6 (0.23%) ITIL Foundation Certificate
15 6 (0.23%) PhD
16 3 (0.12%) ISTQB Foundation Certification
Quality Assurance & Compliance
1 283 (11.02%) QA
2 36 (1.40%) Accessibility
3 25 (0.97%) SEPA
4 24 (0.93%) SLA
5 17 (0.66%) ISO 20022
6 6 (0.23%) NCSC
7 5 (0.19%) Data Quality
8 4 (0.16%) ISO/IEC 27001
9 3 (0.12%) California Consumer Privacy Act
9 3 (0.12%) GDPR
9 3 (0.12%) GMP
9 3 (0.12%) NIST
9 3 (0.12%) PCI DSS
9 3 (0.12%) WCAG
10 2 (0.078%) HIPAA
10 2 (0.078%) ISO 26262
10 2 (0.078%) Sarbanes-Oxley
10 2 (0.078%) Software Quality Assurance
11 1 (0.039%) ISO/IEC 27005
11 1 (0.039%) MiFID
System Software
1 706 (27.50%) Docker
2 21 (0.82%) Active Directory
3 13 (0.51%) Virtual Machines
4 8 (0.31%) Hyper-V
5 6 (0.23%) Virtual Desktop
6 5 (0.19%) Ceph
6 5 (0.19%) Firmware
6 5 (0.19%) VMware Infrastructure
7 2 (0.078%) HDFS
7 2 (0.078%) NFS
7 2 (0.078%) vSphere
8 1 (0.039%) Virtual Servers
Systems Management
1 578 (22.52%) Kubernetes
2 239 (9.31%) Terraform
3 170 (6.62%) Ansible
4 42 (1.64%) Puppet
5 31 (1.21%) Grafana
5 31 (1.21%) Single Sign-On
6 24 (0.93%) AirWatch
6 24 (0.93%) OpenSSO
7 22 (0.86%) Progress Chef
7 22 (0.86%) Prometheus
8 17 (0.66%) HP Quality Center
9 14 (0.55%) Kustomize
10 11 (0.43%) Salt
11 9 (0.35%) Istio
11 9 (0.35%) Microsoft Intune
12 6 (0.23%) Packer
13 5 (0.19%) Jamf Pro
13 5 (0.19%) SELinux
14 2 (0.078%) Hadoop YARN
14 2 (0.078%) Mesos
Vendors
1 354 (13.79%) Oracle
2 121 (4.71%) Microsoft
3 79 (3.08%) Google
4 70 (2.73%) TIBCO
5 62 (2.42%) Sybase
6 60 (2.34%) OpenLink
7 57 (2.22%) IBM
8 43 (1.68%) Splunk
9 32 (1.25%) Salesforce
10 24 (0.93%) SAP
10 24 (0.93%) ServiceNow
11 22 (0.86%) HP
12 19 (0.74%) Atlassian
12 19 (0.74%) VMware
13 18 (0.70%) Dynatrace
13 18 (0.70%) WSO2
14 17 (0.66%) Confluent
15 14 (0.55%) Red Hat
15 14 (0.55%) Veracode
16 13 (0.51%) Dell