Kafka Jobs with Hybrid/Remote/WFH Options

Apache Kafka
UK > Work from Home

The table below provides summary statistics for permanent remote or hybrid work requiring Kafka skills. It includes a benchmarking guide to the annual salaries offered in vacancies that cited Kafka over the 6 months leading up to 1 July 2025, comparing them to the same period in the previous two years.

6 months to
1 Jul 2025
Same period 2024 Same period 2023
Rank 143 293 140
Rank change year-on-year +150 -153 -46
Permanent jobs citing Kafka 479 353 884
As % of all permanent jobs with a WFH option 2.37% 1.02% 2.46%
As % of the Libraries, Frameworks & Software Standards category 9.44% 3.84% 7.50%
Number of salaries quoted 207 294 677
10th Percentile £52,500 £52,500 £58,750
25th Percentile £60,000 £55,313 £70,000
Median annual salary (50th Percentile) £85,000 £72,500 £85,000
Median % change year-on-year +17.24% -14.71% -
75th Percentile £125,000 £92,000 £115,000
90th Percentile £142,500 £112,500 £143,750
UK median annual salary £82,500 £75,000 £87,500
% change year-on-year +10.00% -14.29% +6.06%

All Software Libraries and Frameworks
Work from Home

Kafka falls under the Software Libraries and Frameworks category. For comparison with the information above, the following table provides summary statistics for all permanent job vacancies with remote or hybrid options requiring technical specification, industry standards, software libraries and framework skills.

Permanent vacancies with a requirement for technical specification, industry standards, software libraries and framework skills 5,074 9,184 11,794
As % of all permanent jobs with a WFH option 25.13% 26.63% 32.76%
Number of salaries quoted 2,906 7,533 9,281
10th Percentile £37,500 £38,750 £41,250
25th Percentile £51,250 £46,250 £51,104
Median annual salary (50th Percentile) £66,219 £60,000 £65,351
Median % change year-on-year +10.37% -8.19% +4.56%
75th Percentile £86,250 £80,000 £85,000
90th Percentile £115,000 £107,500 £105,000
UK median annual salary £67,500 £60,000 £67,071
% change year-on-year +12.50% -10.54% +4.11%

Kafka
Trend for Jobs with a WFH Option

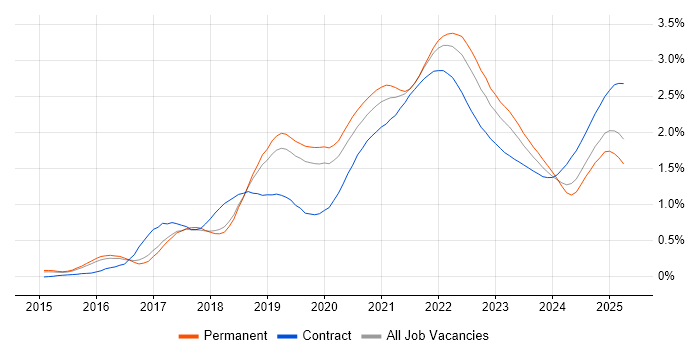
Job vacancies with remote working options citing Kafka as a proportion of all IT jobs advertised.

Kafka trend for jobs with Hybrid/Remote/WFH options

Kafka
Salary Trend for Jobs with a WFH Option

3-month moving average salary quoted in job vacancies with remote working options citing Kafka.

Kafka salary trend for jobs with a WFH option

Kafka
Salary Histogram for Jobs with a WFH Option

Salary distribution for jobs with remote working options citing Kafka over the 6 months to 1 July 2025.

Kafka salary histogram for jobs with a WFH option

Kafka
Co-occurring Skills and Capabilities with WFH Options by Category

The follow tables expand on the table above by listing co-occurrences grouped by category. The same employment type, locality and period is covered with up to 20 co-occurrences shown in each of the following categories:

Application Platforms
1 161 (33.61%) Confluence
2 63 (13.15%) Apache Spark
3 54 (11.27%) Apache
4 53 (11.06%) Apache Airflow
5 3 (0.63%) GemFire
6 2 (0.42%) OpenStack
6 2 (0.42%) Oracle SOA Suite
Business Applications
1 4 (0.84%) Oracle EBS
2 1 (0.21%) Dynamics CRM
2 1 (0.21%) SAP Business One
Cloud Services
1 395 (82.46%) AWS
2 294 (61.38%) Azure
3 200 (41.75%) GCP
4 64 (13.36%) Serverless
5 63 (13.15%) AWS Lambda
6 56 (11.69%) OpenShift
7 50 (10.44%) Amazon ECS
8 43 (8.98%) dbt
9 16 (3.34%) AWS CloudFormation
9 16 (3.34%) SaaS
10 10 (2.09%) Amazon EKS
10 10 (2.09%) AWS KMS
11 8 (1.67%) GitHub
12 7 (1.46%) Amazon MSK
13 5 (1.04%) Amazon EC2
13 5 (1.04%) Amazon S3
13 5 (1.04%) Azure DevOps
13 5 (1.04%) Azure Logic Apps
13 5 (1.04%) Snowflake
14 4 (0.84%) Figma
Communications & Networking
1 16 (3.34%) HTTP
2 10 (2.09%) Network Security
3 4 (0.84%) TCP/IP
4 3 (0.63%) Internet
5 2 (0.42%) Broadband
5 2 (0.42%) FTP
6 1 (0.21%) Firewall
Database & Business Intelligence
1 277 (57.83%) SQL Server
2 52 (10.86%) MongoDB
3 46 (9.60%) Amazon Athena
3 46 (9.60%) Apache Iceberg
4 45 (9.39%) Apache Ignite
5 42 (8.77%) Apache Arrow
5 42 (8.77%) Dremio
6 31 (6.47%) NoSQL
7 22 (4.59%) PostgreSQL
8 13 (2.71%) MySQL
9 12 (2.51%) Redis
10 10 (2.09%) Relational Database
11 9 (1.88%) Data Warehouse
12 8 (1.67%) Big Data
12 8 (1.67%) Hadoop
13 5 (1.04%) Amazon Redshift
14 4 (0.84%) Amazon RDS
14 4 (0.84%) Apache Hudi
14 4 (0.84%) Delta Lake
15 3 (0.63%) DynamoDB
Development Applications
1 261 (54.49%) GitLab
2 256 (53.44%) JIRA
3 254 (53.03%) Maven
4 253 (52.82%) Bitbucket
5 250 (52.19%) SonarQube
6 248 (51.77%) Selenium
7 247 (51.57%) Cucumber
7 247 (51.57%) Sonatype Nexus
8 43 (8.98%) Artifactory
9 22 (4.59%) Jenkins
10 19 (3.97%) Git
11 11 (2.30%) JUnit
12 6 (1.25%) Mockito
13 5 (1.04%) Oracle Forms
14 4 (0.84%) Gradle
14 4 (0.84%) NUnit
15 3 (0.63%) Atlassian Bamboo
15 3 (0.63%) Postman
16 2 (0.42%) REST Assured
16 2 (0.42%) XCTest
General
1 356 (74.32%) Finance
2 275 (57.41%) Inclusion and Diversity
3 273 (56.99%) Banking
4 106 (22.13%) Retail
5 90 (18.79%) Corporate Banking
5 90 (18.79%) Investment Banking
6 67 (13.99%) Front Office
7 43 (8.98%) Social Skills
8 28 (5.85%) Games
9 14 (2.92%) Public Sector
10 12 (2.51%) Advertising
10 12 (2.51%) Law
11 8 (1.67%) Analytical Skills
12 6 (1.25%) Aerospace
13 3 (0.63%) Marketing
14 2 (0.42%) Financial Institution
14 2 (0.42%) Telecoms
15 1 (0.21%) Legal
15 1 (0.21%) Manufacturing
15 1 (0.21%) Presentation Skills
Job Titles
1 305 (63.67%) Software Engineer
2 67 (13.99%) Developer
3 57 (11.90%) Data Engineer
4 54 (11.27%) Python Engineer
5 51 (10.65%) DevOps Engineer
6 50 (10.44%) Senior
7 49 (10.23%) AWS Engineer
8 48 (10.02%) AWS DevOps
8 48 (10.02%) AWS DevOps Engineer
9 41 (8.56%) Lead
10 24 (5.01%) Java Developer
11 22 (4.59%) Architect
11 22 (4.59%) Senior Software Engineer
12 19 (3.97%) Java Engineer
13 16 (3.34%) Developer/Software Engineer
13 16 (3.34%) Lead Software Engineer
14 14 (2.92%) AWS Architect
14 14 (2.92%) Java Software Engineer
14 14 (2.92%) Senior Developer
15 12 (2.51%) .NET Developer
Libraries, Frameworks & Software Standards
1 310 (64.72%) React
2 273 (56.99%) Spring Boot
3 270 (56.37%) Spring
4 265 (55.32%) Redux
5 252 (52.61%) CSS
5 252 (52.61%) HTML
6 249 (51.98%) JPA
7 162 (33.82%) Hibernate
8 105 (21.92%) REST
9 101 (21.09%) RESTful
10 95 (19.83%) Jest
11 93 (19.42%) HTML5
12 92 (19.21%) CSS3
13 90 (18.79%) Sass
14 47 (9.81%) PySpark
15 44 (9.19%) J2EE
16 33 (6.89%) .NET
17 30 (6.26%) Node.js
18 24 (5.01%) GraphQL
19 23 (4.80%) AngularJS
Miscellaneous
1 264 (55.11%) Product Ownership
2 247 (51.57%) Enterprise Software
3 35 (7.31%) Distributed Systems
4 24 (5.01%) Cloud Native
5 19 (3.97%) Fixed Income
6 12 (2.51%) Data Structures
6 12 (2.51%) Management Information System
7 10 (2.09%) Algorithms
8 7 (1.46%) Greenfield Project
9 6 (1.25%) Legacy Systems
10 5 (1.04%) Public Cloud
11 4 (0.84%) Derivative
11 4 (0.84%) Legacy Code
11 4 (0.84%) Mobile Games
11 4 (0.84%) Team-Oriented Environment
12 3 (0.63%) Credit Derivative
12 3 (0.63%) Equities
12 3 (0.63%) Foreign Exchange (FX)
12 3 (0.63%) IoT
12 3 (0.63%) Mobile App
Operating Systems
1 14 (2.92%) Linux
2 11 (2.30%) Unix
3 2 (0.42%) Windows
4 1 (0.21%) Debian
4 1 (0.21%) Red Hat Enterprise Linux
Processes & Methodologies
1 386 (80.58%) Agile
2 382 (79.75%) Software Engineering
3 351 (73.28%) DevOps
4 341 (71.19%) CI/CD
5 316 (65.97%) Microservices
6 281 (58.66%) Full-Stack Development
7 278 (58.04%) Containerisation
8 267 (55.74%) SDLC
9 259 (54.07%) Test Automation
10 257 (53.65%) Performance Optimisation
11 253 (52.82%) Front End Development
12 175 (36.53%) TDD
13 167 (34.86%) Clean Code
14 164 (34.24%) Continuous Improvement
15 143 (29.85%) Mentoring
16 98 (20.46%) Migration
17 97 (20.25%) User Experience
18 93 (19.42%) Strategic Thinking
19 90 (18.79%) Responsive Web Design
20 54 (11.27%) Site Reliability Engineering
Programming Languages
1 381 (79.54%) Java
2 298 (62.21%) SQL
3 289 (60.33%) JavaScript
4 132 (27.56%) TypeScript
5 112 (23.38%) Python
6 67 (13.99%) Go
7 37 (7.72%) C#
8 16 (3.34%) Scala
9 5 (1.04%) Groovy
9 5 (1.04%) PL/SQL
10 3 (0.63%) Bash
10 3 (0.63%) Shell Script
11 2 (0.42%) MATLAB
11 2 (0.42%) Rust
12 1 (0.21%) C++
12 1 (0.21%) Clojure
12 1 (0.21%) COBOL
12 1 (0.21%) T-SQL
Qualifications
1 48 (10.02%) Degree
2 26 (5.43%) Security Cleared
3 24 (5.01%) SC Cleared
4 22 (4.59%) Computer Science Degree
5 17 (3.55%) AWS Certification
6 15 (3.13%) AWS Certified Solutions Architect
7 4 (0.84%) Master's Degree
7 4 (0.84%) PhD
8 3 (0.63%) Numerate Degree
9 2 (0.42%) CISSP
10 1 (0.21%) Azure Certification
10 1 (0.21%) DV Cleared
Quality Assurance & Compliance
1 250 (52.19%) QA
2 97 (20.25%) Accessibility
3 15 (3.13%) GDPR
4 14 (2.92%) HIPAA
5 6 (1.25%) Def Stans
6 5 (1.04%) Data Quality
7 3 (0.63%) ISO/IEC 27001
7 3 (0.63%) SOC 2
8 1 (0.21%) ISO 15022
8 1 (0.21%) ISO 20022
8 1 (0.21%) MiFID
System Software
1 368 (76.83%) Docker
2 6 (1.25%) Virtual Machines
3 5 (1.04%) HDFS
4 2 (0.42%) VMware Infrastructure
5 1 (0.21%) Active Directory
Systems Management
1 372 (77.66%) Kubernetes
2 72 (15.03%) Terraform
3 17 (3.55%) Prometheus
4 16 (3.34%) Grafana
5 7 (1.46%) Argo
6 6 (1.25%) Istio
7 1 (0.21%) Ansible
7 1 (0.21%) Check_MK
7 1 (0.21%) FortiGate
7 1 (0.21%) Kibana
7 1 (0.21%) Kustomize
7 1 (0.21%) logstash
7 1 (0.21%) Opsgenie
7 1 (0.21%) Single Sign-On
Vendors
1 251 (52.40%) Solace
2 26 (5.43%) Google
3 23 (4.80%) Oracle
4 15 (3.13%) Microsoft
5 12 (2.51%) Apple
5 12 (2.51%) Splunk
6 8 (1.67%) VMware
7 6 (1.25%) Confluent
7 6 (1.25%) Databricks
7 6 (1.25%) Red Hat
8 5 (1.04%) Okta
9 3 (0.63%) New Relic
9 3 (0.63%) TIBCO
10 2 (0.42%) Atlassian
10 2 (0.42%) CA Agile Central
10 2 (0.42%) Dynatrace
10 2 (0.42%) Facebook
10 2 (0.42%) Informatica
10 2 (0.42%) Talend
11 1 (0.21%) YouTube