WCAG Jobs with Work from Home Options

Web Content Accessibility Guidelines (WCAG)
UK > Work from Home

The table below provides summary statistics for permanent job vacancies with an option to work from home (WFH) and a requirement for WCAG skills. Included is a benchmarking guide to the salaries offered in vacancies that have cited WCAG over the 6 months to 4 May 2024 with a comparison to the same period in the previous 2 years.

6 months to
4 May 2024
Same period 2023 Same period 2022
Rank 489 621 686
Rank change year-on-year +132 +65 -152
Permanent jobs citing WCAG 95 42 159
As % of all permanent jobs with a WFH option 0.28% 0.099% 0.23%
As % of the Quality Assurance & Compliance category 2.22% 0.67% 1.48%
Number of salaries quoted 85 14 43
10th Percentile £40,988 £34,875 £22,500
25th Percentile £47,500 £43,938 £32,500
Median annual salary (50th Percentile) £57,965 £60,000 £52,500
Median % change year-on-year -3.39% +14.29% -12.50%
75th Percentile £60,741 £71,875 £63,000
90th Percentile £65,546 £77,625 £73,750
UK median annual salary £57,965 £47,500 £42,074
% change year-on-year +22.03% +12.90% -36.49%

All Quality Assurance and Compliance Skills
Work from Home

WCAG is in the Quality Assurance and Compliance category. The following table is for comparison with the above and provides summary statistics for all permanent job vacancies with a WFH option and a requirement for quality assurance or compliance skills.

Permanent vacancies with a requirement for quality assurance or compliance skills 4,276 6,238 10,748
As % of all permanent jobs with a WFH option 12.66% 14.71% 15.81%
Number of salaries quoted 3,247 4,220 6,050
10th Percentile £34,750 £36,250 £32,500
25th Percentile £42,500 £46,000 £42,500
Median annual salary (50th Percentile) £57,500 £60,000 £55,000
Median % change year-on-year -4.17% +9.09% +4.76%
75th Percentile £73,750 £77,500 £73,750
90th Percentile £95,000 £92,500 £90,000
UK median annual salary £52,500 £57,500 £55,000
% change year-on-year -8.70% +4.55% +4.76%

WCAG
Trend for Jobs with a WFH Option

Job vacancies with a work from home option citing WCAG as a proportion of all IT jobs advertised.
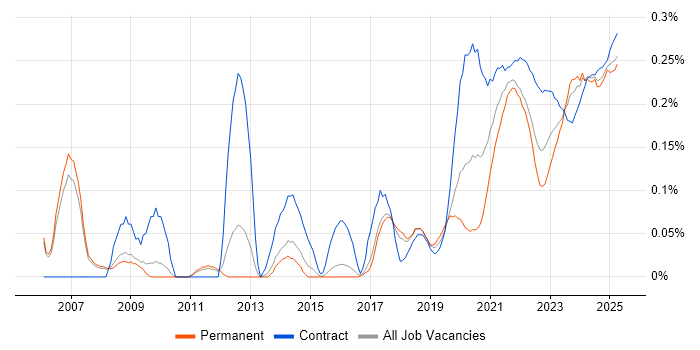
WCAG trend for jobs with a WFH option

WCAG
Salary Trend for Jobs with a WFH Option

3-month moving average salary quoted in job vacancies with a work from home option citing WCAG.

WCAG salary trend for jobs with a WFH option

WCAG
Salary Histogram for Jobs with a WFH Option

Salary distribution for jobs with a work from home option citing WCAG over the 6 months to 4 May 2024.

WCAG salary histogram for jobs with a WFH option

WCAG
Co-occurring Skills and Capabilities with WFH Options by Category

The follow tables expand on the table above by listing co-occurrences grouped by category. The same employment type, locality and period is covered with up to 20 co-occurrences shown in each of the following categories:

Application Platforms
1 1 (1.05%) Confluence
Applications
1 16 (16.84%) Adobe XD
2 4 (4.21%) InVision
2 4 (4.21%) Sketch
3 3 (3.16%) UserZoom
4 1 (1.05%) Microsoft Excel
Cloud Services
1 13 (13.68%) AWS
2 8 (8.42%) SaaS
3 7 (7.37%) GCP
4 5 (5.26%) Azure
5 4 (4.21%) Azure DevOps
5 4 (4.21%) Figma
6 3 (3.16%) Azure API Management
6 3 (3.16%) Azure Key Vault
6 3 (3.16%) Azure Monitor
6 3 (3.16%) Azure Service Bus
6 3 (3.16%) Azure Storage
6 3 (3.16%) Cloud Computing
6 3 (3.16%) Entra ID
6 3 (3.16%) Serverless
7 1 (1.05%) GitHub
Communications & Networking
1 2 (2.11%) HTTP
Database & Business Intelligence
1 5 (5.26%) SQL Server
2 2 (2.11%) Elasticsearch
3 1 (1.05%) MongoDB
3 1 (1.05%) NoSQL
3 1 (1.05%) Redis
Development Applications
1 13 (13.68%) Axure RP
1 13 (13.68%) Balsamiq
2 7 (7.37%) webpack
3 4 (4.21%) Visual Studio
4 3 (3.16%) Moq
4 3 (3.16%) Postman
4 3 (3.16%) Selenium
4 3 (3.16%) SoapUI
4 3 (3.16%) SpecFlow
5 1 (1.05%) GitKraken
5 1 (1.05%) JetBrains Rider
5 1 (1.05%) JIRA
5 1 (1.05%) ReSharper
General
1 74 (77.89%) Public Sector
2 18 (18.95%) Inclusion and Diversity
3 13 (13.68%) Marketing
3 13 (13.68%) Presentation Skills
4 8 (8.42%) Analytical Skills
4 8 (8.42%) Social Skills
5 4 (4.21%) Finance
6 3 (3.16%) Banking
6 3 (3.16%) Law
7 2 (2.11%) Retail
8 1 (1.05%) Welsh Language
Job Titles
1 52 (54.74%) Senior
2 37 (38.95%) Designer
3 36 (37.89%) Interaction Designer
4 27 (28.42%) Senior Data Warehouse Specialist
5 17 (17.89%) Senior Designer
5 17 (17.89%) Senior Interaction Designer
6 13 (13.68%) Consultant
6 13 (13.68%) User Experience Consultant
7 7 (7.37%) Developer
7 7 (7.37%) Front-End Engineer (Client-Side Engineer)
7 7 (7.37%) Senior Front-End Engineer (Client-Side Engineer)
8 5 (5.26%) Lead
9 4 (4.21%) Lead Developer
10 2 (2.11%) .NET Developer
10 2 (2.11%) Lead .NET Developer
10 2 (2.11%) Software Developer
10 2 (2.11%) UX Developer
11 1 (1.05%) Lead UX Designer
11 1 (1.05%) UI Designer
11 1 (1.05%) UI/UX Designer
Libraries, Frameworks & Software Standards
1 26 (27.37%) CSS
1 26 (27.37%) HTML
2 8 (8.42%) Node.js
3 7 (7.37%) GraphQL
3 7 (7.37%) React
3 7 (7.37%) REST
4 4 (4.21%) .NET
4 4 (4.21%) .NET Framework
4 4 (4.21%) ASP.NET
4 4 (4.21%) Entity Framework
5 3 (3.16%) .NET Core
5 3 (3.16%) ASP.NET MVC
5 3 (3.16%) Swagger
5 3 (3.16%) Vue
6 2 (2.11%) RESTful
7 1 (1.05%) ASP.NET Core
7 1 (1.05%) Blazor
7 1 (1.05%) Gherkin
7 1 (1.05%) Kafka
7 1 (1.05%) RabbitMQ
Miscellaneous
1 14 (14.74%) Product Ownership
2 7 (7.37%) Greenfield Project
3 3 (3.16%) W3C
4 2 (2.11%) Analytical Mindset
5 1 (1.05%) Blockchain
5 1 (1.05%) Enterprise Software
5 1 (1.05%) Management Information System
Processes & Methodologies
1 74 (77.89%) User-Centered Design (UCD)
2 67 (70.53%) Mentoring
3 66 (69.47%) Coaching
4 45 (47.37%) Agile
5 39 (41.05%) Prototyping
6 36 (37.89%) Analytics
6 36 (37.89%) Interaction Design
7 27 (28.42%) Software Testing
8 26 (27.37%) User Experience
9 22 (23.16%) Design Patterns
10 18 (18.95%) User Research
11 17 (17.89%) Service Design
12 16 (16.84%) High-Fidelity Prototypes
12 16 (16.84%) Wireframes
13 13 (13.68%) Creative Thinking
13 13 (13.68%) Information Architecture
13 13 (13.68%) Low-Fidelity Prototypes
13 13 (13.68%) Problem-Solving
13 13 (13.68%) Project Delivery
13 13 (13.68%) Thought Leadership
Programming Languages
1 20 (21.05%) JavaScript
2 8 (8.42%) TypeScript
3 4 (4.21%) C#
4 2 (2.11%) SQL
5 1 (1.05%) Go
5 1 (1.05%) Java
Qualifications
1 20 (21.05%) Degree
2 13 (13.68%) Microsoft Certification
3 3 (3.16%) Master's Degree
4 2 (2.11%) Azure Certification
5 1 (1.05%) BPSS Clearance
5 1 (1.05%) Computer Science Degree
5 1 (1.05%) ISTQB
Quality Assurance & Compliance
1 94 (98.95%) Accessibility
2 2 (2.11%) GDPR
3 1 (1.05%) QA
System Software
1 3 (3.16%) Active Directory
2 1 (1.05%) Docker
Vendors
1 18 (18.95%) Microsoft
2 13 (13.68%) Adobe
3 7 (7.37%) Google
4 3 (3.16%) Qualtrics
5 2 (2.11%) Monetate
5 2 (2.11%) Qubit