GIS Jobs with Work from Home Options

Geographic Information System (GIS)
UK > Work from Home

The table below provides summary statistics for permanent remote or hybrid work requiring GIS skills. It includes a benchmarking guide to the annual salaries offered in vacancies that cited GIS over the 6 months leading up to 26 July 2024, comparing them to the same period in the previous two years.

6 months to
26 Jul 2024
Same period 2023 Same period 2022
Rank 381 433 671
Rank change year-on-year +52 +238 -251
Permanent jobs citing GIS 157 148 245
As % of all permanent jobs with a WFH option 0.56% 0.45% 0.31%
As % of the Database & Business Intelligence category 2.67% 1.90% 1.06%
Number of salaries quoted 40 68 94
10th Percentile £32,325 £35,338 £31,625
25th Percentile £35,000 £39,688 £40,000
Median annual salary (50th Percentile) £40,000 £45,500 £52,008
Median % change year-on-year -12.09% -12.51% -9.55%
75th Percentile £49,063 £62,500 £61,625
90th Percentile £59,250 £70,000 £72,500
UK median annual salary £45,000 £45,000 £47,500
% change year-on-year - -5.26% -17.39%

All Database and Business Intelligence Skills
Work from Home

GIS falls under the Databases and Business Intelligence category. For comparison with the information above, the following table provides summary statistics for all permanent job vacancies with remote or hybrid options requiring database or business intelligence skills.

Permanent vacancies with a requirement for database or business intelligence skills 5,877 7,799 23,130
As % of all permanent jobs with a WFH option 21.04% 23.76% 29.45%
Number of salaries quoted 4,479 6,085 11,274
10th Percentile £38,084 £40,000 £36,750
25th Percentile £46,250 £49,000 £45,000
Median annual salary (50th Percentile) £62,000 £62,500 £60,000
Median % change year-on-year -0.80% +4.17% +9.09%
75th Percentile £87,500 £80,000 £80,000
90th Percentile £122,500 £97,500 £95,000
UK median annual salary £60,000 £62,500 £60,000
% change year-on-year -4.00% +4.17% +9.09%

GIS
Trend for Jobs with a WFH Option

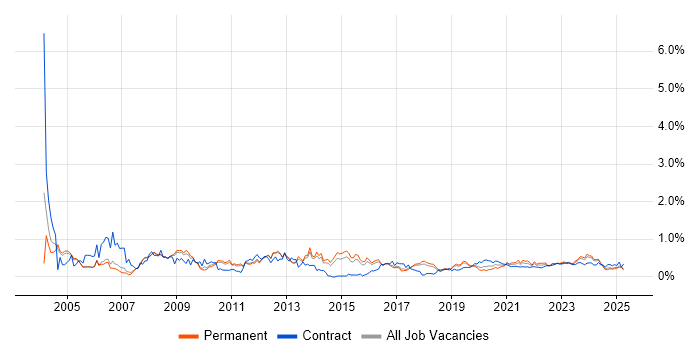
Job vacancies with a work from home option citing GIS as a proportion of all IT jobs advertised.

GIS trend for jobs with a WFH option

GIS
Salary Trend for Jobs with a WFH Option

3-month moving average salary quoted in job vacancies with a work from home option citing GIS.

GIS salary trend for jobs with a WFH option

GIS
Salary Histogram for Jobs with a WFH Option

Salary distribution for jobs with a work from home option citing GIS over the 6 months to 26 July 2024.

GIS salary histogram for jobs with a WFH option

GIS
Co-occurring Skills and Capabilities with WFH Options by Category

The follow tables expand on the table above by listing co-occurrences grouped by category. The same employment type, locality and period is covered with up to 20 co-occurrences shown in each of the following categories:

Application Platforms
1 108 (68.79%) ArcGIS
2 99 (63.06%) GeoServer
3 6 (3.82%) Apache
3 6 (3.82%) nginx
Applications
1 8 (5.10%) Microsoft Excel
2 3 (1.91%) Trello
Business Applications
1 1 (0.64%) Sparx Enterprise Architect
Cloud Services
1 113 (71.97%) AWS
1 113 (71.97%) Azure
2 12 (7.64%) Power Platform
3 8 (5.10%) Google Sheets
4 7 (4.46%) GitHub
4 7 (4.46%) GitHub Actions
5 2 (1.27%) Power Automate
6 1 (0.64%) Azure AKS
6 1 (0.64%) Cloud Computing
6 1 (0.64%) IaaS
6 1 (0.64%) Microsoft 365
6 1 (0.64%) PaaS
Communications & Networking
1 3 (1.91%) HTTP
2 1 (0.64%) Broadband
2 1 (0.64%) Internet
Database & Business Intelligence
1 111 (70.70%) PostgreSQL
2 103 (65.61%) QGIS
3 14 (8.92%) Geospatial Data
4 12 (7.64%) Power BI
5 8 (5.10%) Redis
5 8 (5.10%) SQL Server
6 6 (3.82%) Relational Database
7 4 (2.55%) Tableau
8 3 (1.91%) MySQL
9 2 (1.27%) MS Access
10 1 (0.64%) MongoDB
10 1 (0.64%) NoSQL
10 1 (0.64%) Spatial Data
Development Applications
1 6 (3.82%) JIRA
2 3 (1.91%) Git
3 2 (1.27%) Oracle Forms
4 1 (0.64%) GitLab
General
1 23 (14.65%) Finance
2 21 (13.38%) Social Skills
3 16 (10.19%) Public Sector
4 14 (8.92%) Analytical Skills
5 13 (8.28%) Retail
6 12 (7.64%) Back Office
7 11 (7.01%) Marketing
8 6 (3.82%) Electronics
8 6 (3.82%) Manufacturing
8 6 (3.82%) Telecoms
9 4 (2.55%) Automotive
9 4 (2.55%) Local Government
10 3 (1.91%) Publishing
11 2 (1.27%) Environmental Health
12 1 (0.64%) Games
12 1 (0.64%) Inclusion and Diversity
12 1 (0.64%) Presentation Skills
Job Titles
1 110 (70.06%) Software Engineer
2 106 (67.52%) Senior
3 98 (62.42%) Senior Software Engineer
4 10 (6.37%) Consultant
5 8 (5.10%) Digital Transformation
6 7 (4.46%) Coordinator
6 7 (4.46%) Geospatial Engineer
7 5 (3.18%) Analyst
8 4 (2.55%) Analytics Manager
8 4 (2.55%) Business Consultant
8 4 (2.55%) Business Development Consultant
8 4 (2.55%) Development Consultant
8 4 (2.55%) IT Consultant
8 4 (2.55%) Senior Analytics Manager
8 4 (2.55%) Senior Manager
9 3 (1.91%) GIS Technician
9 3 (1.91%) Senior Consultant
9 3 (1.91%) Technical Consultant
9 3 (1.91%) Technical Engineer
9 3 (1.91%) Technical Support Engineer
Libraries, Frameworks & Software Standards
1 105 (66.88%) CSS
2 102 (64.97%) .NET
3 101 (64.33%) .NET Core
4 100 (63.69%) React
5 99 (63.06%) Leaflet
5 99 (63.06%) OpenLayers
5 99 (63.06%) PostGIS
6 10 (6.37%) HTML
7 7 (4.46%) Celery
7 7 (4.46%) Dask
7 7 (4.46%) Django
7 7 (4.46%) Flask
7 7 (4.46%) GeoJSON
7 7 (4.46%) GeoPandas
7 7 (4.46%) NumPy
8 6 (3.82%) LAPP Stack
9 4 (2.55%) AngularJS
9 4 (2.55%) HTML5
9 4 (2.55%) JSON
9 4 (2.55%) REST
Miscellaneous
1 14 (8.92%) Management Information System
2 3 (1.91%) Driving Licence
2 3 (1.91%) iPhone
2 3 (1.91%) Mobile App
2 3 (1.91%) Product Ownership
3 1 (0.64%) Algorithms
3 1 (0.64%) Housing Association
Operating Systems
1 9 (5.73%) Linux
2 8 (5.10%) Windows
Processes & Methodologies
1 111 (70.70%) Software Engineering
2 105 (66.88%) Agile
3 102 (64.97%) Web Development
4 99 (63.06%) Actionable Insight
4 99 (63.06%) DevOps
5 18 (11.46%) Business Intelligence
6 17 (10.83%) Data Analysis
7 13 (8.28%) Problem-Solving
8 12 (7.64%) Line Management
9 10 (6.37%) Analytics
9 10 (6.37%) Customer Requirements
10 9 (5.73%) Computer Science
10 9 (5.73%) Decision-Making
10 9 (5.73%) Full Stack Development
11 8 (5.10%) Service Management
12 7 (4.46%) CI/CD
12 7 (4.46%) Code Quality
12 7 (4.46%) Culture Change
12 7 (4.46%) Data Modelling
13 6 (3.82%) Customer Experience
Programming Languages
1 122 (77.71%) Python
2 112 (71.34%) JavaScript
3 70 (44.59%) C#
4 15 (9.55%) SQL
5 5 (3.18%) R
6 3 (1.91%) Apex Code
7 2 (1.27%) Java
8 1 (0.64%) C++
8 1 (0.64%) Go
8 1 (0.64%) TypeScript
Qualifications
1 99 (63.06%) SC Cleared
1 99 (63.06%) Security Cleared
2 17 (10.83%) Degree
3 6 (3.82%) Master's Degree
4 1 (0.64%) AWS Certification
4 1 (0.64%) TOGAF Certification
Quality Assurance & Compliance
1 3 (1.91%) Accessibility
2 1 (0.64%) GDPR
System Software
1 8 (5.10%) Docker
Systems Management
1 7 (4.46%) Terraform
2 1 (0.64%) Kubernetes
Vendors
1 108 (68.79%) ESRI
2 8 (5.10%) Google
3 6 (3.82%) Salesforce
3 6 (3.82%) SAP
4 5 (3.18%) Oracle
5 3 (1.91%) Microsoft
6 2 (1.27%) Civica
7 1 (0.64%) Sparx