CSS Jobs with Work from Home Options

CSS (Cascading Style Sheets)
UK > Work from Home

The table below provides summary statistics for permanent remote or hybrid work requiring CSS skills. It includes a benchmarking guide to the annual salaries offered in vacancies that cited CSS over the 6 months leading up to 26 July 2024, comparing them to the same period in the previous two years.

6 months to
26 Jul 2024
Same period 2023 Same period 2022
Rank 58 49 28
Rank change year-on-year -9 -21 -7
Permanent jobs citing CSS 1,206 1,896 7,617
As % of all permanent jobs with a WFH option 4.32% 5.78% 9.70%
As % of the Libraries, Frameworks & Software Standards category 16.78% 17.70% 21.77%
Number of salaries quoted 893 1,572 3,543
10th Percentile £31,250 £37,000 £33,750
25th Percentile £38,750 £45,000 £41,750
Median annual salary (50th Percentile) £50,500 £55,414 £55,000
Median % change year-on-year -8.87% +0.75% +10.00%
75th Percentile £65,000 £75,000 £71,250
90th Percentile £78,750 £87,492 £85,000
UK median annual salary £52,500 £56,318 £55,000
% change year-on-year -6.78% +2.40% +10.00%

All Software Libraries and Frameworks
Work from Home

CSS falls under the Software Libraries and Frameworks category. For comparison with the information above, the following table provides summary statistics for all permanent job vacancies with remote or hybrid options requiring technical specification, industry standards, software libraries and framework skills.

Permanent vacancies with a requirement for technical specification, industry standards, software libraries and framework skills 7,187 10,711 34,988
As % of all permanent jobs with a WFH option 25.73% 32.64% 44.56%
Number of salaries quoted 5,753 8,589 17,752
10th Percentile £40,000 £41,450 £40,000
25th Percentile £47,500 £51,250 £47,000
Median annual salary (50th Percentile) £62,500 £65,351 £62,500
Median % change year-on-year -4.36% +4.56% +13.64%
75th Percentile £83,750 £85,000 £82,500
90th Percentile £117,500 £105,000 £95,000
UK median annual salary £60,000 £67,500 £65,000
% change year-on-year -11.11% +3.85% +13.04%

CSS
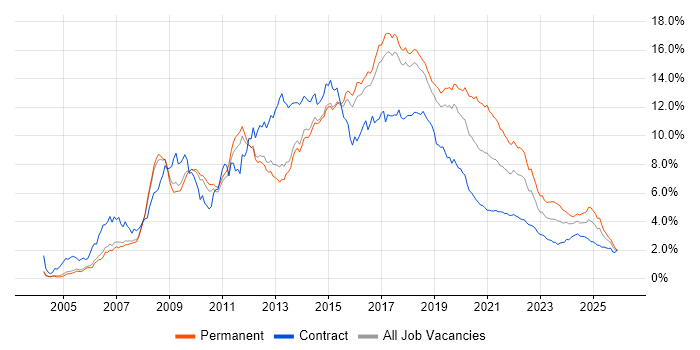
Trend for Jobs with a WFH Option

Job vacancies with a work from home option citing CSS as a proportion of all IT jobs advertised.

CSS trend for jobs with a WFH option

CSS
Salary Trend for Jobs with a WFH Option

3-month moving average salary quoted in job vacancies with a work from home option citing CSS.

CSS salary trend for jobs with a WFH option

CSS
Salary Histogram for Jobs with a WFH Option

Salary distribution for jobs with a work from home option citing CSS over the 6 months to 26 July 2024.

CSS salary histogram for jobs with a WFH option

CSS
Co-occurring Skills and Capabilities with WFH Options by Category

The follow tables expand on the table above by listing co-occurrences grouped by category. The same employment type, locality and period is covered with up to 20 co-occurrences shown in each of the following categories:

Application Platforms
1 102 (8.46%) ArcGIS
2 98 (8.13%) GeoServer
3 93 (7.71%) WordPress
4 61 (5.06%) CMS
5 47 (3.90%) SharePoint
6 45 (3.73%) IIS
7 25 (2.07%) SAS
8 17 (1.41%) nginx
9 16 (1.33%) Umbraco
10 13 (1.08%) Drupal
11 7 (0.58%) Apache Solr
12 6 (0.50%) Confluence
13 4 (0.33%) Apache
14 3 (0.25%) Moodle
14 3 (0.25%) Orchard CMS
15 2 (0.17%) Headless CMS
16 1 (0.083%) Adobe Experience Manager
16 1 (0.083%) Apache Airflow
16 1 (0.083%) EPiServer
16 1 (0.083%) Totara
Applications
1 23 (1.91%) Adobe XD
2 12 (1.00%) Microsoft Excel
3 8 (0.66%) Adobe Creative Suite
4 6 (0.50%) Sketch
5 5 (0.41%) Microsoft Office
6 4 (0.33%) Adobe Illustrator
7 3 (0.25%) SPSS
7 3 (0.25%) Trello
8 2 (0.17%) MS Visio
8 2 (0.17%) Photoshop
9 1 (0.083%) Acrobat
9 1 (0.083%) Adobe Premiere
9 1 (0.083%) InDesign
9 1 (0.083%) Notion
Business Applications
1 22 (1.82%) Magento
2 14 (1.16%) Shopify
3 10 (0.83%) NEC Housing
4 6 (0.50%) Dynamics CRM
4 6 (0.50%) Sage 200
4 6 (0.50%) Sage 50
5 5 (0.41%) Payment Gateway
6 1 (0.083%) nopCommerce
6 1 (0.083%) Remedy ITSM
6 1 (0.083%) Salesforce CRM
6 1 (0.083%) Visualfiles
Cloud Services
1 439 (36.40%) Azure
2 272 (22.55%) AWS
3 90 (7.46%) Azure DevOps
4 83 (6.88%) SaaS
5 63 (5.22%) GitHub
6 47 (3.90%) Power Platform
7 41 (3.40%) Google Analytics
8 38 (3.15%) GCP
9 33 (2.74%) Microsoft 365
10 23 (1.91%) Serverless
11 22 (1.82%) Power Automate
12 20 (1.66%) Figma
12 20 (1.66%) Snowflake
13 19 (1.58%) Firebase
13 19 (1.58%) npm
14 18 (1.49%) PowerApps
15 15 (1.24%) Azure Service Bus
16 14 (1.16%) Azure Functions
17 13 (1.08%) Dynamics 365
18 12 (1.00%) Azure Cosmos DB
Communications & Networking
1 28 (2.32%) DNS
2 24 (1.99%) TCP/IP
3 23 (1.91%) SSL
4 20 (1.66%) Firewall
5 15 (1.24%) Network Security
6 12 (1.00%) Internet
7 10 (0.83%) HTTP
8 8 (0.66%) VPN
9 7 (0.58%) MQTT
10 6 (0.50%) Wi-Fi
11 5 (0.41%) Reverse Proxy
12 4 (0.33%) Broadband
13 3 (0.25%) GPRS
13 3 (0.25%) OpenVPN
13 3 (0.25%) Remote Desktop
13 3 (0.25%) SMS
14 2 (0.17%) DKIM
14 2 (0.17%) DMARC
14 2 (0.17%) Intranet
14 2 (0.17%) Modbus
Database & Business Intelligence
1 274 (22.72%) SQL Server
2 160 (13.27%) PostgreSQL
3 141 (11.69%) MySQL
4 105 (8.71%) GIS
5 98 (8.13%) QGIS
6 83 (6.88%) Relational Database
7 52 (4.31%) Azure SQL Database
8 26 (2.16%) Power BI
8 26 (2.16%) Tableau
9 23 (1.91%) NoSQL
10 21 (1.74%) Oracle Database
11 15 (1.24%) MongoDB
12 14 (1.16%) Elasticsearch
13 10 (0.83%) SQL Server Reporting Services
14 9 (0.75%) Amazon RDS
14 9 (0.75%) Redis
15 8 (0.66%) Power Query
16 7 (0.58%) DynamoDB
16 7 (0.58%) Hadoop
16 7 (0.58%) MariaDB
Development Applications
1 256 (21.23%) Git
2 55 (4.56%) Visual Studio
3 47 (3.90%) JIRA
4 24 (1.99%) webpack
5 22 (1.82%) Team Foundation Server
6 21 (1.74%) Oracle APEX
7 19 (1.58%) gulp
7 19 (1.58%) Jenkins
8 18 (1.49%) GitLab
9 17 (1.41%) Cypress.io
10 16 (1.33%) Axure RP
11 14 (1.16%) Balsamiq
12 13 (1.08%) TeamCity
12 13 (1.08%) Visual Studio Code
13 12 (1.00%) Bitbucket
14 10 (0.83%) NUnit
14 10 (0.83%) Yeoman
15 9 (0.75%) Jasmine
15 9 (0.75%) Selenium
16 8 (0.66%) Octopus Deploy
General
1 266 (22.06%) Social Skills
2 124 (10.28%) Marketing
3 115 (9.54%) Finance
4 68 (5.64%) Analytical Skills
5 58 (4.81%) Retail
6 54 (4.48%) Inclusion and Diversity
6 54 (4.48%) Public Sector
7 51 (4.23%) Law
8 36 (2.99%) Legal
9 28 (2.32%) Games
10 18 (1.49%) Manufacturing
10 18 (1.49%) Police
11 16 (1.33%) Advertising
11 16 (1.33%) Presentation Skills
12 15 (1.24%) Back Office
13 14 (1.16%) Local Government
14 10 (0.83%) Tech for Good
15 9 (0.75%) Publishing
15 9 (0.75%) Telecoms
16 8 (0.66%) Banking
Job Titles
1 834 (69.15%) Developer
2 350 (29.02%) Senior
3 185 (15.34%) Senior Developer
4 168 (13.93%) Software Engineer
5 165 (13.68%) .NET Developer
6 139 (11.53%) Full Stack Developer
7 120 (9.95%) Senior Software Engineer
8 109 (9.04%) PHP Developer
9 101 (8.37%) Front-End Developer (Client-Side Developer)
10 88 (7.30%) Lead
11 84 (6.97%) Software Developer
12 71 (5.89%) Web Developer
13 65 (5.39%) Lead Developer
14 55 (4.56%) C# Developer
15 47 (3.90%) React Developer
16 39 (3.23%) C# .NET Developer
17 36 (2.99%) Senior .NET Developer
18 34 (2.82%) Senior Front-End Developer
19 33 (2.74%) Full Stack .NET Developer
20 31 (2.57%) Senior Full Stack Developer
Libraries, Frameworks & Software Standards
1 1,030 (85.41%) HTML
2 513 (42.54%) .NET
3 475 (39.39%) React
4 274 (22.72%) .NET Core
5 243 (20.15%) AngularJS
6 205 (17.00%) jQuery
7 200 (16.58%) HTML5
8 199 (16.50%) ASP.NET
9 167 (13.85%) Vue
10 146 (12.11%) RESTful
11 133 (11.03%) REST
12 129 (10.70%) CSS3
13 117 (9.70%) Laravel
13 117 (9.70%) Twitter Bootstrap
14 109 (9.04%) .NET Framework
15 107 (8.87%) Entity Framework
16 106 (8.79%) ASP.NET MVC
17 105 (8.71%) Node.js
18 103 (8.54%) Web Services
19 99 (8.21%) PostGIS
Miscellaneous
1 59 (4.89%) Greenfield Project
2 58 (4.81%) Mobile App
3 53 (4.39%) Legacy Systems
4 48 (3.98%) Self-Motivation
5 31 (2.57%) Product Ownership
6 26 (2.16%) CMDB
7 23 (1.91%) Onboarding
8 21 (1.74%) IoT
8 21 (1.74%) NHS
9 19 (1.58%) Low-Code
10 18 (1.49%) Life Science
11 14 (1.16%) Foreign Exchange (FX)
12 13 (1.08%) Cloud Native
13 11 (0.91%) Graphic Design
13 11 (0.91%) Social Media
14 9 (0.75%) Data Structures
15 8 (0.66%) Blog
15 8 (0.66%) Enterprise Software
15 8 (0.66%) Management Information System
16 7 (0.58%) Virtual Reality
Operating Systems
1 57 (4.73%) Linux
2 56 (4.64%) Windows
3 22 (1.82%) Android
4 21 (1.74%) Apple iOS
5 5 (0.41%) AIX
5 5 (0.41%) Windows Server
6 4 (0.33%) Ubuntu
7 3 (0.25%) CentOS
8 2 (0.17%) Mac OS X
8 2 (0.17%) Unix
9 1 (0.083%) VMS
Processes & Methodologies
1 390 (32.34%) Agile
2 331 (27.45%) Web Development
3 307 (25.46%) Full Stack Development
4 305 (25.29%) DevOps
5 258 (21.39%) Software Engineering
6 248 (20.56%) Problem-Solving
7 224 (18.57%) Front End Development
8 223 (18.49%) MVC
9 177 (14.68%) User Experience
10 129 (10.70%) Computer Science
11 126 (10.45%) Actionable Insight
12 120 (9.95%) Mentoring
13 117 (9.70%) E-Commerce
14 111 (9.20%) TDD
15 87 (7.21%) CI/CD
16 83 (6.88%) Analytics
17 80 (6.63%) Design Patterns
18 79 (6.55%) OO
18 79 (6.55%) OOP
18 79 (6.55%) Test Automation
Programming Languages
1 986 (81.76%) JavaScript
2 481 (39.88%) C#
3 370 (30.68%) SQL
4 230 (19.07%) TypeScript
5 214 (17.74%) PHP
6 203 (16.83%) Python
7 115 (9.54%) Java
8 50 (4.15%) T-SQL
9 33 (2.74%) VB.NET
10 28 (2.32%) PowerShell
11 24 (1.99%) Go
12 21 (1.74%) PL/SQL
13 19 (1.58%) XAML
14 18 (1.49%) C++
15 17 (1.41%) C
16 15 (1.24%) Ruby
17 14 (1.16%) R
18 12 (1.00%) Swift
19 11 (0.91%) VBA
20 10 (0.83%) Objective-C
Qualifications
1 202 (16.75%) Degree
2 144 (11.94%) Security Cleared
3 118 (9.78%) SC Cleared
4 90 (7.46%) Computer Science Degree
5 25 (2.07%) Microsoft Certification
6 19 (1.58%) BPSS Clearance
6 19 (1.58%) DBS Check
7 7 (0.58%) Master's Degree
8 6 (0.50%) Azure Certification
9 4 (0.33%) CTC Cleared
9 4 (0.33%) ITIL Certification
10 3 (0.25%) Postgraduate
11 2 (0.17%) ISO 27001 Lead Auditor
12 1 (0.083%) CIPD
12 1 (0.083%) DV Cleared
12 1 (0.083%) ITIL Foundation Certificate
Quality Assurance & Compliance
1 74 (6.14%) Accessibility
2 64 (5.31%) QA
3 20 (1.66%) SLA
4 17 (1.41%) WCAG
5 12 (1.00%) GDPR
6 5 (0.41%) ISO/IEC 27001
7 3 (0.25%) GRC
8 2 (0.17%) Cyber Essentials
8 2 (0.17%) ISO 9001
9 1 (0.083%) Sarbanes-Oxley
System Software
1 83 (6.88%) Docker
2 9 (0.75%) Active Directory
3 4 (0.33%) Hyper-V
4 3 (0.25%) KVM
4 3 (0.25%) Virtual Machines
4 3 (0.25%) VMware ESXi
5 2 (0.17%) Terminal Services
6 1 (0.083%) Firmware
6 1 (0.083%) VMware Infrastructure
Systems Management
1 35 (2.90%) Kubernetes
2 13 (1.08%) Terraform
3 7 (0.58%) MIIS
4 3 (0.25%) Galera Cluster
5 2 (0.17%) Plesk
6 1 (0.083%) cPanel
6 1 (0.083%) HP UCMDB
6 1 (0.083%) Single Sign-On
Vendors
1 187 (15.51%) Microsoft
2 102 (8.46%) ESRI
3 62 (5.14%) Google
4 45 (3.73%) Adobe
5 33 (2.74%) ServiceNow
6 30 (2.49%) Oracle
7 18 (1.49%) Salesforce
8 12 (1.00%) WooCommerce
9 11 (0.91%) Facebook
10 10 (0.83%) NEC
11 8 (0.66%) Sage
11 8 (0.66%) SAP
11 8 (0.66%) Screaming Frog
12 7 (0.58%) Atlassian
12 7 (0.58%) Splunk
13 6 (0.50%) Ahrefs
14 5 (0.41%) Twitter
14 5 (0.41%) UiPath
15 3 (0.25%) PayPal
15 3 (0.25%) Salesforce Marketing Cloud