Vue Jobs with Hybrid/Remote/WFH Options

Vue
UK > Work from Home

The table below provides summary statistics for permanent remote or hybrid work requiring Vue skills. It includes a benchmarking guide to the annual salaries offered in vacancies that cited Vue over the 6 months leading up to 17 June 2025, comparing them to the same period in the previous two years.

6 months to
17 Jun 2025
Same period 2024 Same period 2023
Rank 252 120 244
Rank change year-on-year -132 +124 -150
Permanent jobs citing Vue 247 878 519
As % of all permanent jobs with a WFH option 1.26% 2.46% 1.41%
As % of the Libraries, Frameworks & Software Standards category 4.89% 9.24% 4.29%
Number of salaries quoted 225 800 461
10th Percentile £41,250 £40,000 £41,250
25th Percentile £52,500 £45,000 £48,750
Median annual salary (50th Percentile) £75,000 £57,500 £60,000
Median % change year-on-year +30.43% -4.17% +4.35%
75th Percentile £110,000 £73,750 £77,500
90th Percentile £137,500 £97,500 £97,500
UK median annual salary £70,000 £57,500 £57,500
% change year-on-year +21.74% - -

All Software Libraries and Frameworks
Work from Home

Vue falls under the Software Libraries and Frameworks category. For comparison with the information above, the following table provides summary statistics for all permanent job vacancies with remote or hybrid options requiring technical specification, industry standards, software libraries and framework skills.

Permanent vacancies with a requirement for technical specification, industry standards, software libraries and framework skills 5,054 9,501 12,107
As % of all permanent jobs with a WFH option 25.87% 26.60% 32.78%
Number of salaries quoted 2,867 7,771 9,521
10th Percentile £37,500 £38,750 £41,250
25th Percentile £51,250 £46,250 £51,250
Median annual salary (50th Percentile) £66,100 £60,000 £65,351
Median % change year-on-year +10.17% -8.19% +4.56%
75th Percentile £85,000 £80,000 £85,000
90th Percentile £115,000 £102,500 £105,000
UK median annual salary £66,274 £60,000 £67,500
% change year-on-year +10.46% -11.11% +4.25%

Vue
Trend for Jobs with a WFH Option

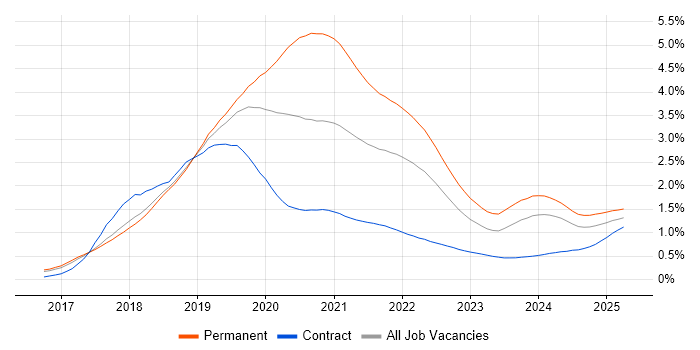
Job vacancies with remote working options citing Vue as a proportion of all IT jobs advertised.

Vue trend for jobs with Hybrid/Remote/WFH options

Vue
Salary Trend for Jobs with a WFH Option

3-month moving average salary quoted in job vacancies with remote working options citing Vue.

Vue salary trend for jobs with a WFH option

Vue
Salary Histogram for Jobs with a WFH Option

Salary distribution for jobs with remote working options citing Vue over the 6 months to 17 June 2025.

Vue salary histogram for jobs with a WFH option

Vue
Co-occurring Skills and Capabilities with WFH Options by Category

The follow tables expand on the table above by listing co-occurrences grouped by category. The same employment type, locality and period is covered with up to 20 co-occurrences shown in each of the following categories:

Application Platforms
1 80 (32.39%) Apache Airflow
2 15 (6.07%) CMS
3 10 (4.05%) Apache
4 9 (3.64%) IIS
5 8 (3.24%) WordPress
6 6 (2.43%) Confluence
7 3 (1.21%) Drupal
7 3 (1.21%) nginx
8 2 (0.81%) Headless CMS
8 2 (0.81%) SharePoint
8 2 (0.81%) Umbraco
9 1 (0.40%) ColdFusion
9 1 (0.40%) EPiServer
9 1 (0.40%) Strapi
Applications
1 4 (1.62%) Photoshop
2 2 (0.81%) Adobe Illustrator
2 2 (0.81%) Elementor
3 1 (0.40%) Adobe Creative Suite
3 1 (0.40%) Trello
Business Applications
1 1 (0.40%) Payment Gateway
1 1 (0.40%) Shopify
Cloud Services
1 174 (70.45%) AWS
2 111 (44.94%) GCP
3 80 (32.39%) dbt
4 72 (29.15%) Azure
5 12 (4.86%) Cloudflare
6 11 (4.45%) Serverless
7 9 (3.64%) npm
8 8 (3.24%) Azure DevOps
9 7 (2.83%) GitHub
10 6 (2.43%) AWS Lambda
10 6 (2.43%) Power Platform
11 5 (2.02%) Amazon EC2
12 4 (1.62%) Amazon SQS
12 4 (1.62%) SaaS
13 3 (1.21%) AWS CloudFormation
13 3 (1.21%) Azure Functions
13 3 (1.21%) Azure Logic Apps
13 3 (1.21%) Figma
13 3 (1.21%) OCI
13 3 (1.21%) Vercel
Communications & Networking
1 4 (1.62%) Internet
2 1 (0.40%) RFID
Database & Business Intelligence
1 81 (32.79%) PostgreSQL
2 80 (32.39%) Amazon Athena
2 80 (32.39%) Apache Arrow
2 80 (32.39%) Apache Iceberg
2 80 (32.39%) Dremio
3 41 (16.60%) MySQL
4 29 (11.74%) SQL Server
5 28 (11.34%) Elasticsearch
6 26 (10.53%) MongoDB
7 23 (9.31%) Azure SQL Database
8 12 (4.86%) NoSQL
9 10 (4.05%) Apache Ignite
10 7 (2.83%) Redis
10 7 (2.83%) Relational Database
11 5 (2.02%) Power BI
12 3 (1.21%) Amazon RDS
12 3 (1.21%) BigQuery
12 3 (1.21%) Metadata
13 2 (0.81%) Big Data
13 2 (0.81%) MariaDB
Development Applications
1 66 (26.72%) Git
2 12 (4.86%) Jasmine
2 12 (4.86%) webpack
3 9 (3.64%) JIRA
3 9 (3.64%) NUnit
3 9 (3.64%) TeamCity
4 7 (2.83%) Vite
5 4 (1.62%) GitLab
5 4 (1.62%) Grunt
5 4 (1.62%) gulp
5 4 (1.62%) Mocha
5 4 (1.62%) PHPUnit
6 3 (1.21%) Babel
6 3 (1.21%) Jenkins
6 3 (1.21%) JUnit
6 3 (1.21%) Mockito
7 2 (0.81%) Bitbucket
7 2 (0.81%) Cypress.io
7 2 (0.81%) git-flow
7 2 (0.81%) Subversion
General
1 115 (46.56%) Finance
2 97 (39.27%) Front Office
3 33 (13.36%) Social Skills
4 12 (4.86%) Games
5 10 (4.05%) Marketing
6 9 (3.64%) Law
7 8 (3.24%) Inclusion and Diversity
8 7 (2.83%) Retail
9 6 (2.43%) Analytical Skills
10 5 (2.02%) Public Sector
11 3 (1.21%) Fire and Rescue
12 2 (0.81%) Automotive
12 2 (0.81%) Electronics
12 2 (0.81%) Manufacturing
12 2 (0.81%) Tech for Good
13 1 (0.40%) Aviation
13 1 (0.40%) Back Office
13 1 (0.40%) Banking
13 1 (0.40%) Organisational Skills
13 1 (0.40%) Telecoms
Job Titles
1 216 (87.45%) Developer
2 107 (43.32%) Software Engineer
3 97 (39.27%) Developer/Software Engineer
4 80 (32.39%) AWS Developer
4 80 (32.39%) AWS Engineer
4 80 (32.39%) AWS Software Engineer
5 60 (24.29%) Python Developer
6 57 (23.08%) Full-Stack Developer
7 56 (22.67%) Python Engineer
7 56 (22.67%) Python Software Engineer
8 37 (14.98%) Senior
9 31 (12.55%) .NET Developer
10 29 (11.74%) Java Developer
11 28 (11.34%) Senior Developer
12 24 (9.72%) Java Engineer
12 24 (9.72%) Java Software Developer
12 24 (9.72%) Java Software Engineer
13 23 (9.31%) PHP Developer
14 19 (7.69%) Front-End Developer (Client-Side Developer)
14 19 (7.69%) Full-Stack Engineer
Libraries, Frameworks & Software Standards
1 195 (78.95%) React
2 182 (73.68%) AngularJS
3 116 (46.96%) Node.js
4 81 (32.79%) Pandas
5 80 (32.39%) NumPy
5 80 (32.39%) SciPy
6 64 (25.91%) .NET
7 63 (25.51%) CSS
8 61 (24.70%) HTML
9 35 (14.17%) .NET Core
10 33 (13.36%) Laravel
11 32 (12.96%) ASP.NET
12 29 (11.74%) Redux
13 28 (11.34%) RESTful
14 26 (10.53%) HTML5
15 25 (10.12%) .NET Framework
16 23 (9.31%) ASP.NET Web API
16 23 (9.31%) CSS3
17 20 (8.10%) Entity Framework
17 20 (8.10%) Sass
Miscellaneous
1 97 (39.27%) Fixed Income
2 72 (29.15%) Equities
2 72 (29.15%) Foreign Exchange (FX)
3 17 (6.88%) Hedge funds
4 6 (2.43%) IoT
4 6 (2.43%) Legacy Code
4 6 (2.43%) Mobile App
5 5 (2.02%) Online Games
6 4 (1.62%) Cloud Native
7 3 (1.21%) Linux Command Line
7 3 (1.21%) Management Information System
7 3 (1.21%) Smart City
7 3 (1.21%) Virtual Team
8 2 (0.81%) Distributed Systems
8 2 (0.81%) Educational Technology
8 2 (0.81%) Onboarding
9 1 (0.40%) Legacy Systems
9 1 (0.40%) Low-Code
9 1 (0.40%) NHS
9 1 (0.40%) Product Ownership
Operating Systems
1 11 (4.45%) Linux
2 3 (1.21%) Ubuntu
3 1 (0.40%) Android
3 1 (0.40%) Apple iOS
3 1 (0.40%) CentOS
3 1 (0.40%) Debian
Processes & Methodologies
1 166 (67.21%) Agile
2 127 (51.42%) Software Engineering
3 105 (42.51%) Fintech
4 103 (41.70%) Asset Management
5 97 (39.27%) Investment Management
6 87 (35.22%) Full-Stack Development
7 80 (32.39%) Performance Attribution
8 70 (28.34%) Order Management
8 70 (28.34%) Risk Management
9 51 (20.65%) TDD
10 44 (17.81%) CI/CD
11 37 (14.98%) Microservices
11 37 (14.98%) MVC
11 37 (14.98%) Scrum
12 30 (12.15%) Problem-Solving
13 27 (10.93%) DevOps
14 21 (8.50%) Analytics
14 21 (8.50%) BDD
14 21 (8.50%) Mentoring
14 21 (8.50%) SOLID
Programming Languages
1 207 (83.81%) JavaScript
2 162 (65.59%) TypeScript
3 90 (36.44%) Python
4 60 (24.29%) C#
5 50 (20.24%) SQL
6 49 (19.84%) PHP
7 39 (15.79%) Java
8 9 (3.64%) Go
9 6 (2.43%) VB.NET
10 3 (1.21%) R
11 2 (0.81%) PowerShell
12 1 (0.40%) Bicep
12 1 (0.40%) Kotlin
12 1 (0.40%) Objective-C
12 1 (0.40%) Swift
12 1 (0.40%) T-SQL
Qualifications
1 9 (3.64%) Security Cleared
2 5 (2.02%) Degree
3 4 (1.62%) Computer Science Degree
3 4 (1.62%) SC Cleared
4 1 (0.40%) DV Cleared
Quality Assurance & Compliance
1 8 (3.24%) Accessibility
2 3 (1.21%) QA
2 3 (1.21%) WCAG
3 2 (0.81%) ISO/IEC 27001
System Software
1 31 (12.55%) Docker
Systems Management
1 17 (6.88%) Kubernetes
2 15 (6.07%) Terraform
Vendors
1 43 (17.41%) Microsoft
2 9 (3.64%) Rollbar
3 6 (2.43%) DevExpress
4 4 (1.62%) SAP
5 3 (1.21%) Adobe
5 3 (1.21%) Twitter
6 2 (0.81%) Databricks
6 2 (0.81%) Google
6 2 (0.81%) HubSpot
6 2 (0.81%) Netlify
6 2 (0.81%) Salesforce
7 1 (0.40%) Apple
7 1 (0.40%) Optimizely
7 1 (0.40%) Oracle
7 1 (0.40%) Red Hat